MACD Max MT5
- Indikatoren
- Version: 1.1
- Aktualisiert: 23 September 2021
- Aktivierungen: 5

Ein flexibler 2-Linien-MACD-Indikator
Der Standard-MACD-Indikator in MT4 beschränkt Sie auf die Verwendung des MACD mit einem Fast-EMA und Slow-EMA.
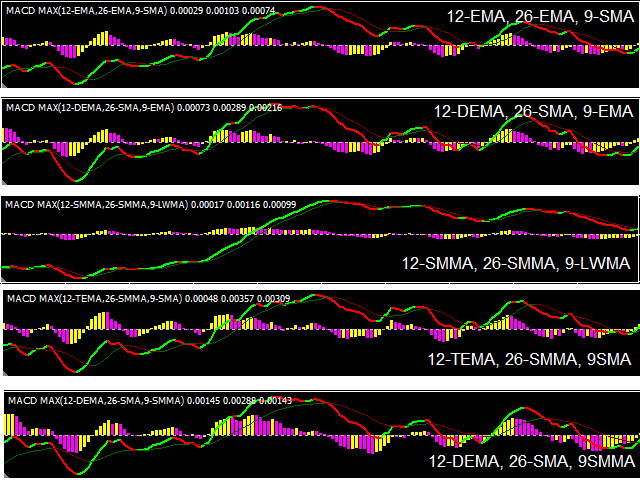
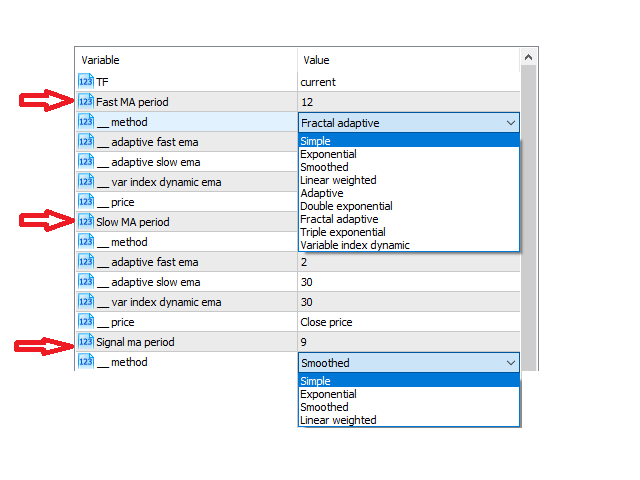
Mit diesem MACD-Indikator können Sie Ihre eigene MA-Methode für diese beiden Komponenten separat festlegen! Sie können zwischen SMA, EMA, SMMA, LWMA, ADAPTIVE MA, FRACTAL MA, DEMA, TEMA, VARIABLE INDEX DYNAMIC MA wählen und sogar eine separate Methode für jede der beiden Fast-Slow-Methoden verwenden. Die Signallinie hat Optionen von SMA-EMA-SMMA-LWMA.
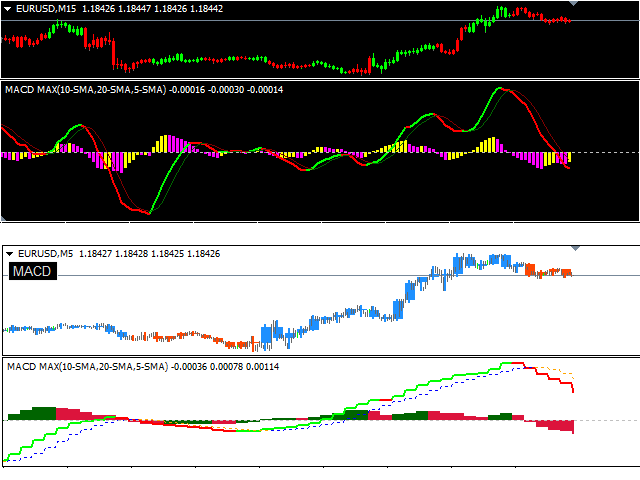
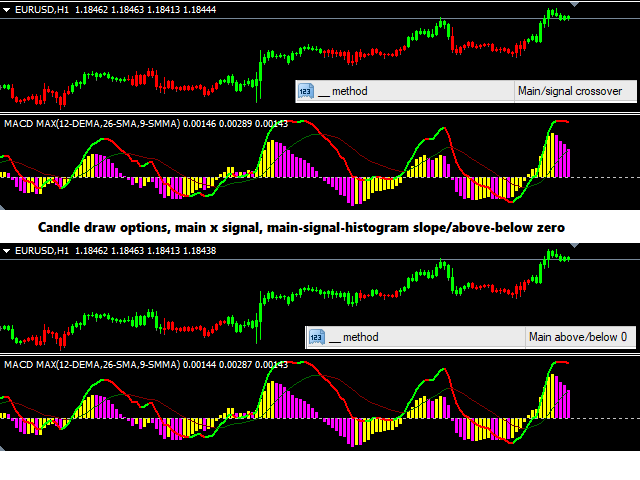
Farbige Kerzen auf dem Diagramm, mit Zeichnungsbedingungstypen sind ebenfalls enthalten, mit einer Ein/Ausblendtaste.
Merkmale
- Fast/Slow-Optionen: SMA, EMA, SMMA, LWMA, AMA, FrMA, DEMA, TEMA, VIDMA
- Signal-Optionen: SMA, EMA, SMMA, LWMA
- getrennte MA-Methoden-Optionen für jede schnelle/langsame MACD-Komponente, d.h. 12-schnelle-DEMA, 26-langsame-LWMA, 9-Signal-EMA
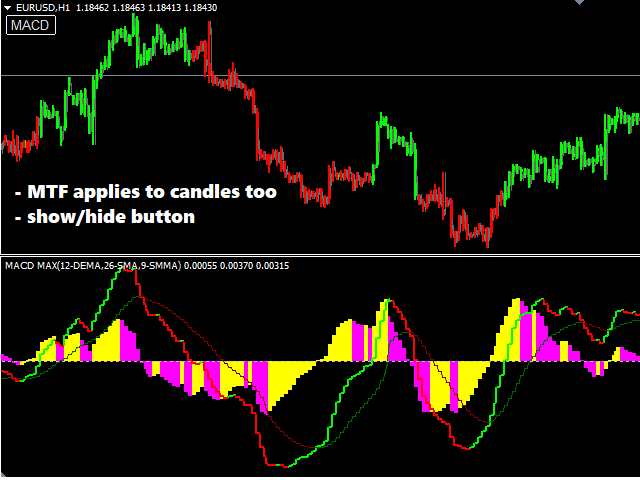
- MTF
- Linien und Historgramme sind farblich abgesetzt
- farbige Kerzen auf dem Chart, Option von 7 Zeichenbedingungen, d.h. Haupt-/Signal-Kreuzung, Histogramm-Steilheit, Haupt-Steilheit
- Schaltfläche zum Ein- und Ausblenden der Chart-Kerzen
- Vollalarm mit 3 Bedingungen
Fehlersuche:
- Wenn es irgendwelche Probleme oder Vorschläge für den Indikator, bitte kommentieren und lassen Sie mich wissen. Das Feedback wird zur Kenntnis genommen und in zukünftigen Updates berücksichtigt.