Pipsometer
- Indikatoren
-
Andrew Ingosi Likare
 A software engineer and a passionate forex trader.
https://icmarkets.com/trading-accounts/overview/?camp=31607 - Version: 1.2
- Aktualisiert: 17 Juni 2026
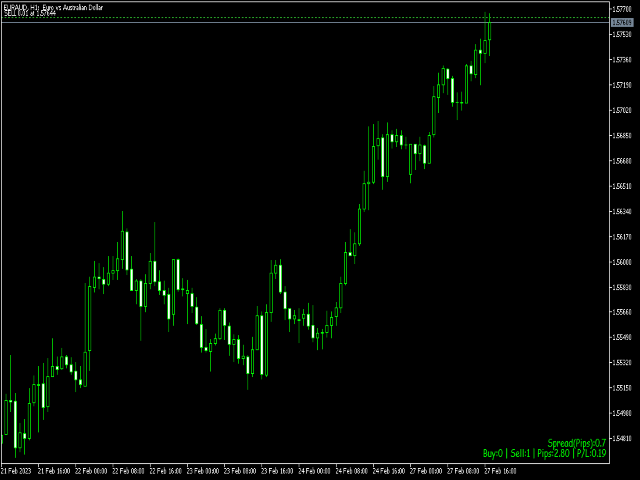
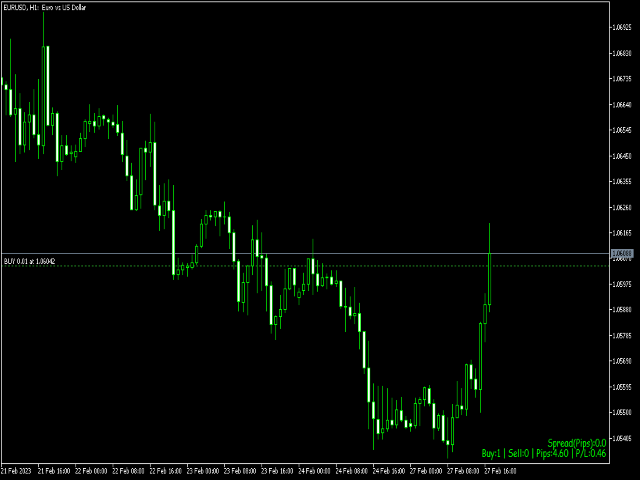
Pipsometer ist ein eleganter Echtzeit-Panel-Indikator für MT5, der Ihnen sofort sowohl Ihren kumulativen Geld- und Pip-Gewinn/Verlust als auch die Gesamtzahl der ausgeführten Trades im aktuellen Chart anzeigt. Er ändert dynamisch seine Anzeigefarbe - grün für Nettogewinn und rot für Nettoverlust - so können Sie die Leistung auf einen Blick beurteilen, ohne Berichte zu öffnen oder durch die Handelshistorie zu blättern.


It works fine. I like to use it. The only item I'd like to change is the font. I would like to have all letters of same width in order to avoid nervous movements from the left to the right and back. It happens when the wide digit is replaced with 1.