PHIBO Green Lines
- Indikatoren
- Version: 1.0
- Aktivierungen: 15

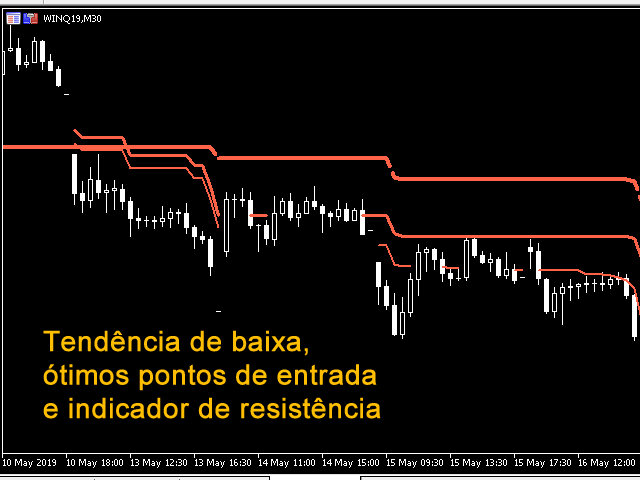
PHIBO-Indikator aus der PhiCube-Methodik. Er verhält sich genau wie der von Bo Williams in seinen Videos und Strategien verwendete Indikator.
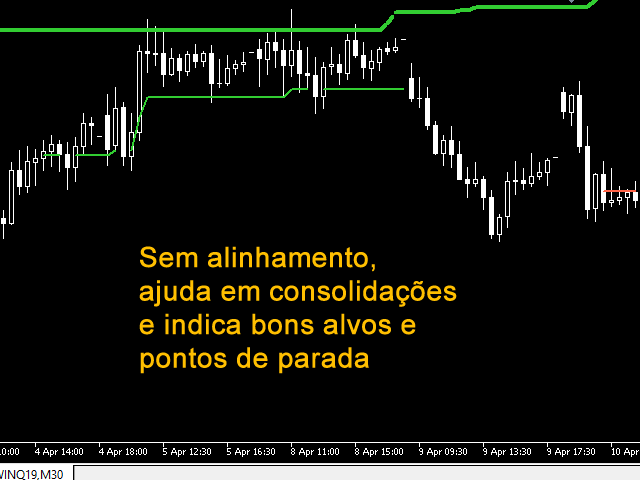
Wenn der Kurs über oder unter den drei Linien liegt, zeigt er einen starken Trend an. Wenn sie nicht aufeinander ausgerichtet sind, können sie Unterstützung, Widerstand und Ziele anzeigen.
Wenn sie nach einer langen Bewegung erscheinen, die bereits ausgedehnt wurde, können sie darauf hinweisen, dass die Bewegung zu Ende geht.

Olá. Algumas linhas estao com diferenças pro do BO, talvez seja porque as linhas dele sao contínuas e a do seu produto não. Talvez se tivesse a opçao de manter como está e tambem ter as linhas contínuas seria ótimo, no restante está 100% igual quando as linhas se agrupam pra tendência. O indicador é muito bom.