WilliamPercentChannel
- Indikatoren
- Version: 1.2
- Aktualisiert: 3 Februar 2019

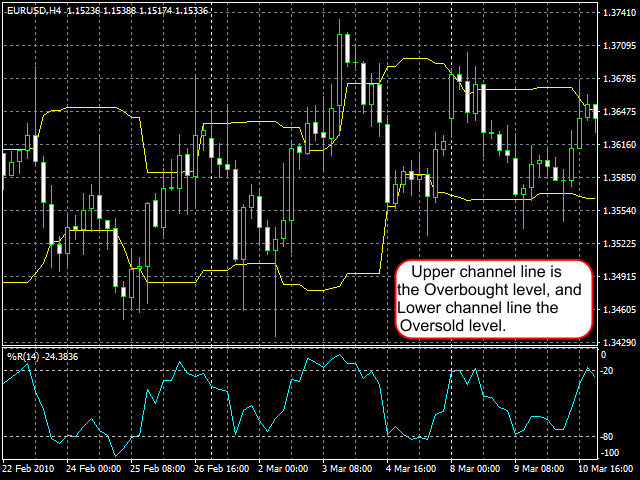
Dieser Indikator hilft Ihnen, überkaufte und überverkaufte Kurse auf der Grundlage des William %R zu finden.
Eingabe Beschreibung:
- WZeitraum: Zeitraum für den %R-Indikator.
- ÜberkauftLevel: Definieren Sie das überkaufte Niveau für %R. Muss zwischen 0 und -50 liegen.
- OverSoldLevel: Definieren Sie das überverkaufte Niveau für %R. Muss zwischen -50 und -100 liegen.
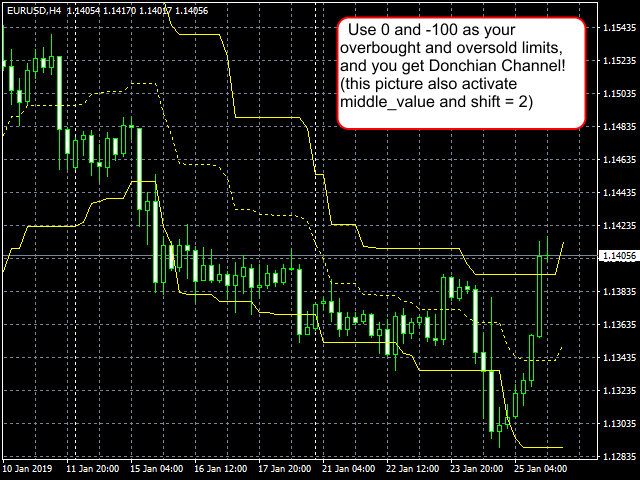
- mittlerer_Wert: Wenn true, zeichnet der Indikator auch die mittleren Punkte zwischen der oberen und unteren Linie.
- shift: Legt einen zusätzlichen Offset für den Indikator fest.
Mehrere Hinweise:
Setzen Sie 0 und -100 als überkaufte und überverkaufte Niveaus, und Sie erhalten den Donchian-Kanal!
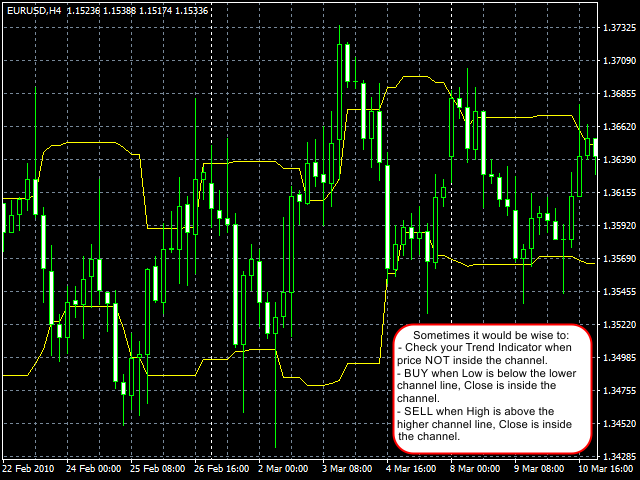
Manchmal wäre es ratsam:
- Überprüfen Sie Ihren Trendindikator, wenn der Kurs NICHT innerhalb des Kanals liegt.
- KAUFEN Sie, wenn das Tief unter der unteren Kanallinie liegt und der Schlusskurs innerhalb des Kanals liegt.
- VERKAUFEN Sie, wenn das Hoch über der oberen Kanallinie liegt und der Schlusskurs innerhalb des Kanals liegt.
Der Benutzer hat keinen Kommentar hinterlassen