Interactive RSI Matrix MT5
- Indikatoren
- Version: 1.2
- Aktualisiert: 2 November 2018
- Aktivierungen: 5

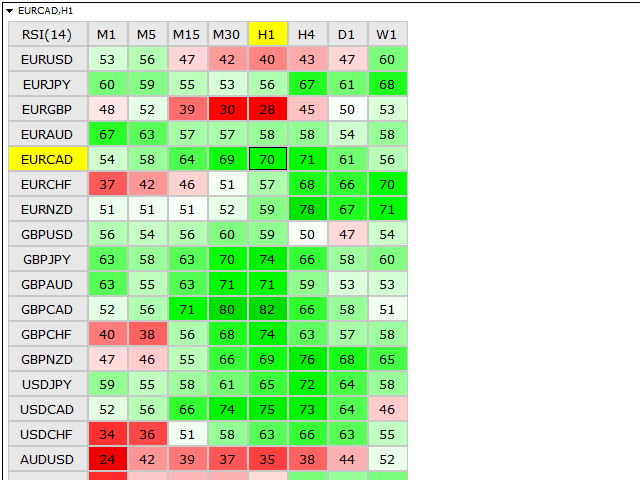
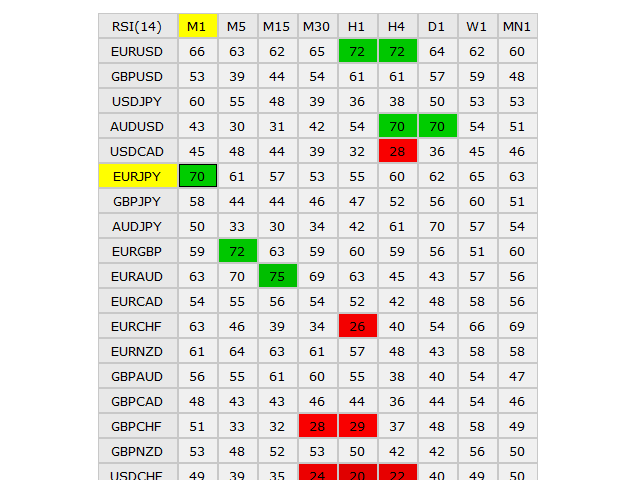
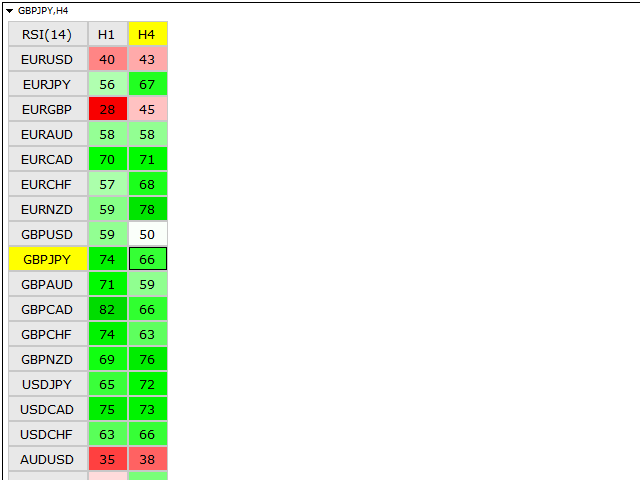
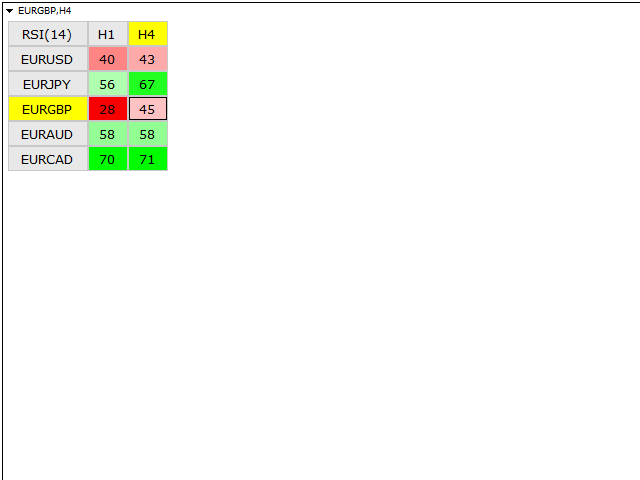
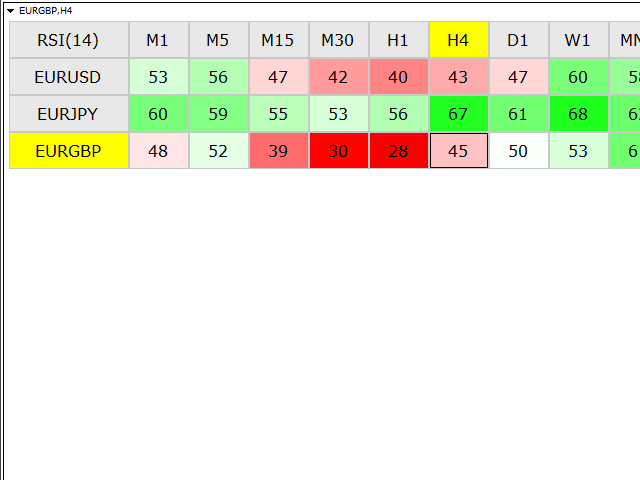
Dieser Indikator zeigt die aktuellen RSI-Werte für mehrere Symbole und mehrere Zeitrahmen an und ermöglicht es Ihnen, mit einem Klick direkt von der Matrix aus zwischen Zeitrahmen und Symbolen zu wechseln.
Mit diesem Indikator können Sie eine große Anzahl von Symbolen über mehrere Zeitrahmen analysieren und die stärksten Trends in nur wenigen Sekunden erkennen.
Merkmale
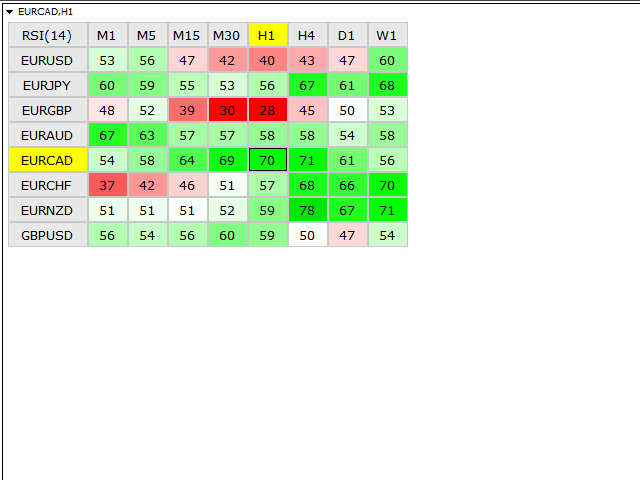
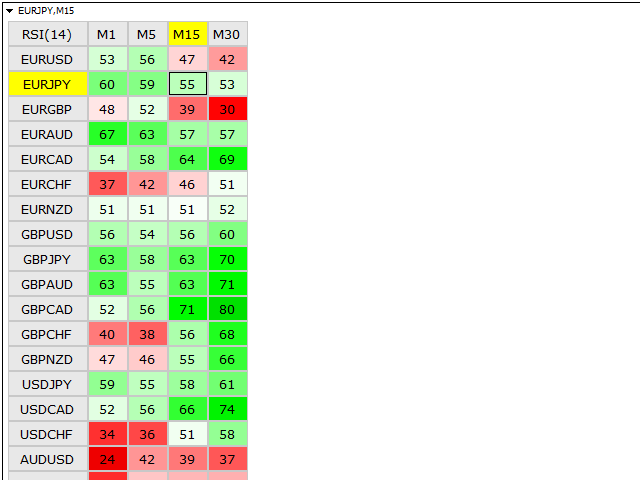
- Zeigt RSI-Werte für mehrere Symbole und Zeitrahmen gleichzeitig an.
- Farbige Zellen mit progressiver Farbintensität in Abhängigkeit von den RSI-Werten.
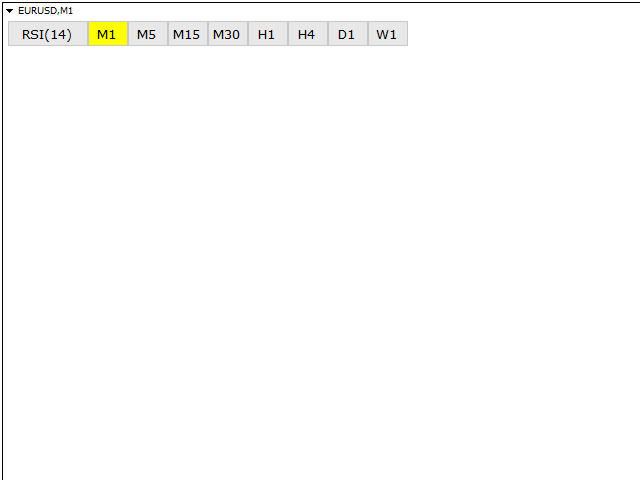
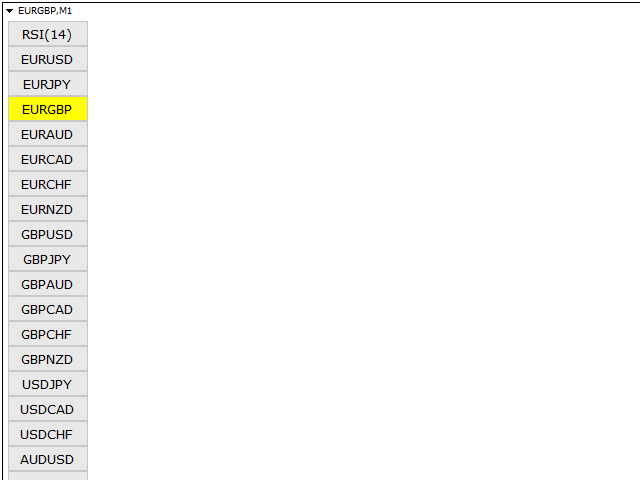
- Möglichkeit, das Symbol und den Zeitrahmen auf dem Chart mit einem Klick direkt von der Matrix aus zu ändern.
- Möglichkeit, die Größe der Schnittstelle und der Schriftart einzustellen.
- Möglichkeit, die Anzahl der Symbole und Zeitrahmen einzustellen.
- Möglichkeit der Einstellung einer neutralen Zone. (Zum Beispiel - rote Farbe unter 30, graue Farbe von 30 bis 70, grüne Farbe über 70)
- Der Indikator wird automatisch mit dem Fenster Market Watch in MetaTrader 5 synchronisiert, in dem Sie benutzerdefinierte Listen mit Symbolen einstellen können.
Einstellungen
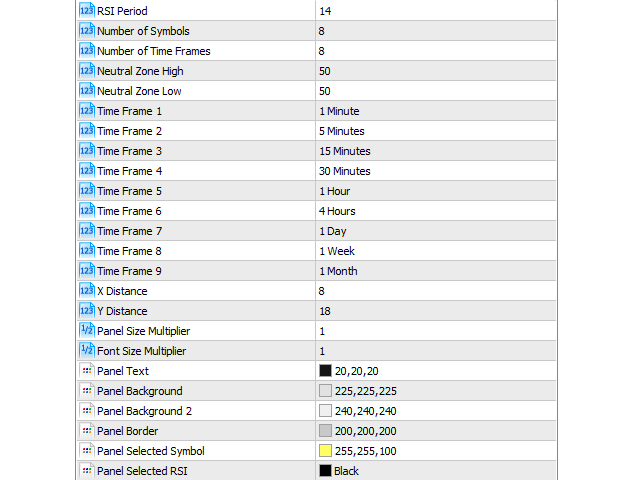
- RSI Periode - Anzahl der Perioden (der Standard ist 14).
- Anzahl der Symbole - wie viele Symbole angezeigt werden sollen.
- Anzahl der Timeframes - wie viele Timeframes angezeigt werden sollen.
- Neutrale Zone Hoch - maximaler RSI-Wert.
- Neutrale Zone Tief - minimaler RSI-Wert.
- Zeitrahmen 1 - Auswahl des Zeitrahmens.
- Zeitrahmen 2 - Auswahl des Zeitrahmens.
- Zeitrahmen 3 - Auswahl des Zeitrahmens.
- Zeitrahmen 4 - Zeitrahmen auswählen.
- Zeitrahmen 5 - Zeitrahmen auswählen.
- Zeitrahmen 6 - Zeitrahmen auswählen.
- Zeitrahmen 7 - Zeitrahmen auswählen.
- Zeitrahmen 8 - Zeitrahmen auswählen.
- Zeitrahmen 9 - Auswahl des Zeitrahmens.
- X Abstand - horizontaler Abstand von der oberen linken Ecke.
- Y-Abstand - vertikaler Abstand von der oberen linken Ecke.
- Multiplikator für Panelgröße - erhöht oder verringert die Größe der Schnittstelle.
- Schriftgrößenmultiplikator - erhöht oder verringert die Größe der Schrift.
- Farbeinstellungen.
Hinweis! Die Demo ist nicht voll funktionsfähig, da der Tester immer nur mit einem Symbol gleichzeitig arbeitet. Es gibt also keine Möglichkeit, zwischen Symbolen oder Zeitrahmen zu wechseln.
Wenn Sie Fragen haben oder Hilfe benötigen, kontaktieren Sie mich bitte per PM.


nice. thanks