MASi Keltner Channel
- Indikatoren
- Version: 1.3

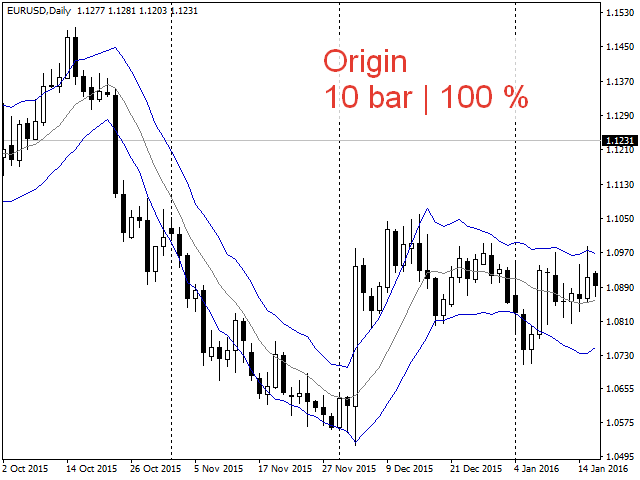
Der Keltner-Kanal-Indikator stellt einen Kanal entlang des gleitenden Durchschnitts dar, wobei die Breite durch die Berechnung der durchschnittlichen wahren Spanne in der Periode des gleitenden Durchschnitts definiert wird.
Dieser Indikator kann sowohl für den Empfang von Signalen als auch als Ersatz für den Indikator Moving Average Envelopes verwendet werden. Sein Vorteil ist die höhere Qualität der automatischen Auswahl der Kanalbreite, die über den Parameter Größe des Kanals in Prozent eingestellt werden kann.
Parameter des Indikators
- Zeitraum des Indikators - Berechnungszeitraum des Indikators
- Typ des Keltner-Kanals - Berechnungsart des Indikators:
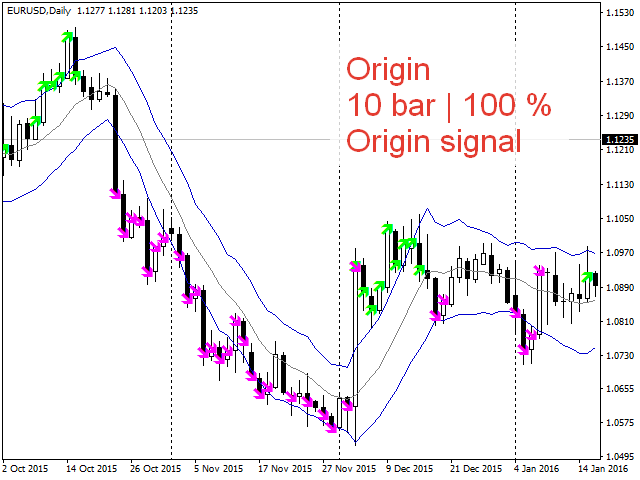
- Original - einfacher gleitender Durchschnitt auf der Grundlage des typischen Preises und der Handelsspanne.
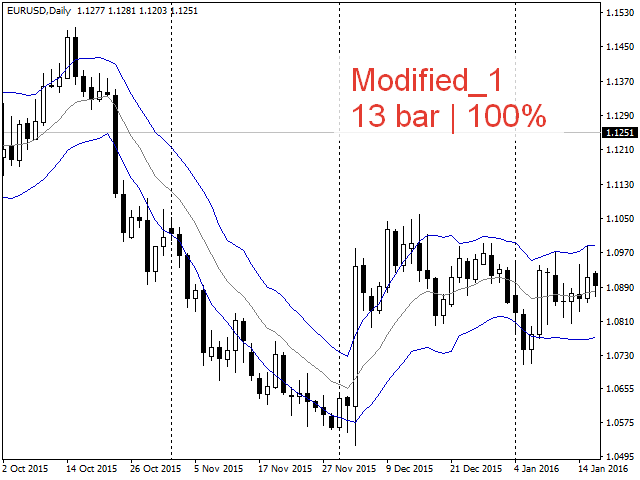
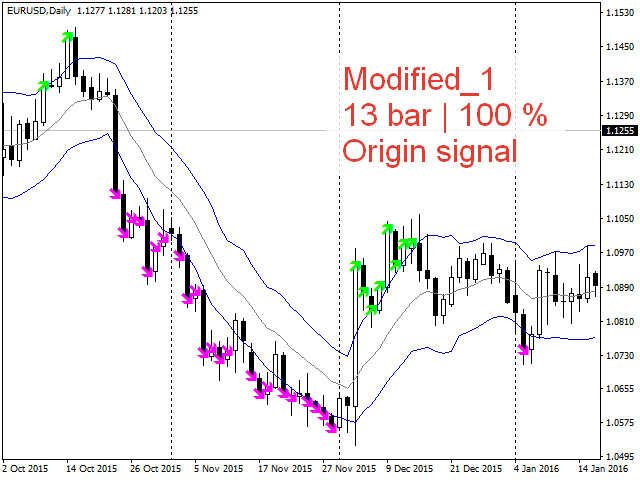
- Modifiziert_1 - exponentieller gleitender Durchschnitt auf der Grundlage des typischen Preises und der durchschnittlichen wahren Spanne.
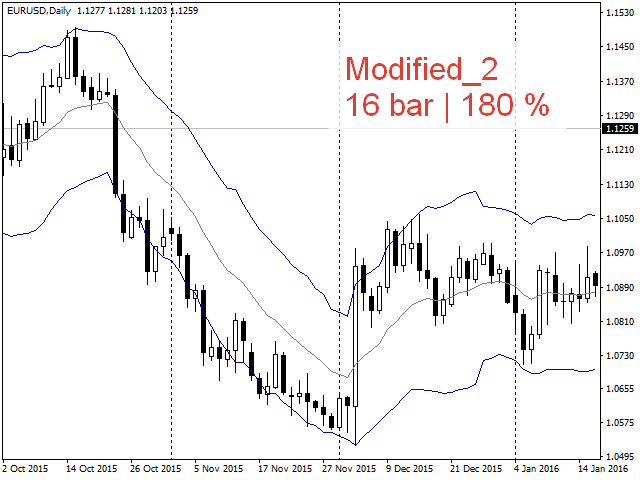
- Modified_2 - exponentieller gleitender Durchschnitt auf der Grundlage des Schlusskurses und der durchschnittlichen wahren Spanne.
- Größe des Kanals in Prozent - Größe des Kanals in Prozenten
Signale des Indikators
- Ursprüngliche Methodik - Signal unter Verwendung der ursprünglichen Methode
- Modifizierte Methode unter Verwendung eines Filters - Signal unter Verwendung der modifizierten Methode