EZT MultiTF rsi
- Indikatoren
- Version: 1.2
- Aktualisiert: 24 November 2021
- Aktivierungen: 10

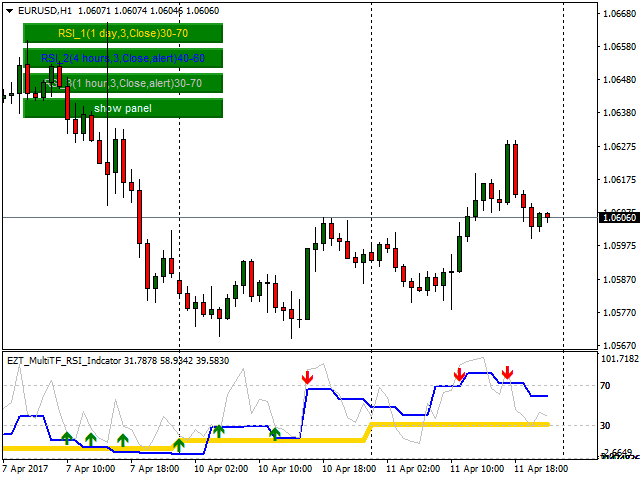
Dieser Indikator kann 1-6 RSI-Indikatoren für verschiedene Zeitrahmen und Einstellungen anzeigen. Die aktiven Indikatoren können visuelle und akustische Warnungen bei überverkauftem/überkauftem Niveau ausgeben, wenn der Benutzer diese Option wählt. Es gibt eine Anzeigetafel mit Schaltflächen auf dem Hauptdiagramm, die die aktiven Indikatoren und ihre Einstellungen anzeigt, und es gibt eine Option zum Ausblenden dieser Tafel. Mit den temporären Schaltflächen können Sie einige der aktiven RSI-Indikatoren ausblenden.
Beschreibung der Einstellungen
- Panel-Position - Das Anzeige-Panel auf dem Hauptchart, in welcher Ecke Sie es sehen wollen.
- Panelgröße - Sie können zwischen normaler und großer Größe wählen
- Panelverschiebung - wie weit das Panel von der Seite entfernt sein soll
- Farbe der aktiven RSI-Schaltfläche - aktiver RSI
- Farbe der inaktiven RSI-Schaltfläche - aktiver RSI, aber vorübergehend ausgeblendet
- RSI verwenden - wählen Sie nur einen oder alle sechs: wahr/falsch
- RSI-Zeitrahmen - jeder RSI kann sich auf einen anderen Zeitrahmen beziehen
- RSI-Alarm - Dieser aktuelle RSI ist Teil eines Alarms oder nicht: true/false
- RSI Farbe - die Farbe der RSI-Linie und auf der Anzeigetafel die Farbe der Buchstaben
- RSI overbought level - wenn der Alarm auf true gesetzt ist, ist der RSI oberhalb dieses Levels überkauft und zeigt einen Abwärtspfeil an
- RSI oversold level - wenn der Alarm wahr ist, ist der RSI unterhalb dieses Levels überverkauft und zeigt einen Pfeil nach oben an
- RSI show levels - true/false : Da alle sechs RSI für verschiedene überkaufte/überverkaufte Niveaus eingestellt werden können, kann das Indikatorfenster überfüllt werden.
- Alarm bei Pfeil - true/false : Pop-up-Alarm bei Pfeil.

Der Benutzer hat keinen Kommentar hinterlassen