Daily Range
- Indikatoren
- Version: 2.1
- Aktualisiert: 17 November 2021
- Aktivierungen: 5

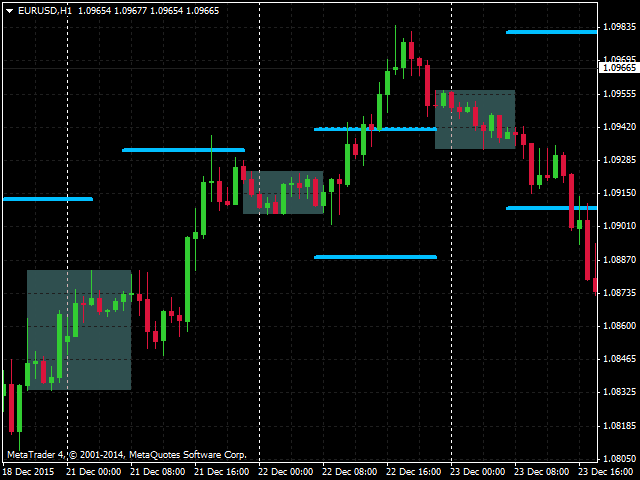
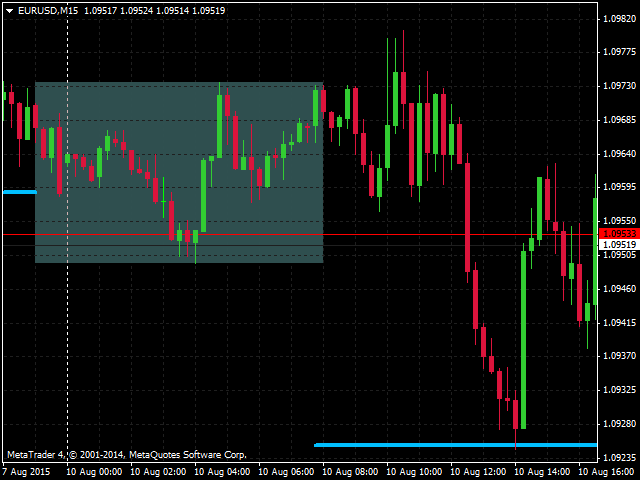
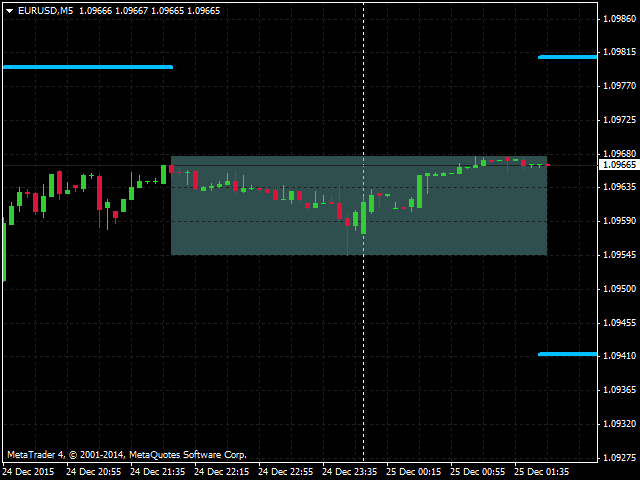
Der Indikator hebt den betroffenen Zeitraum unter Berücksichtigung der höchsten und niedrigsten Preise hervor. Es ist möglich, einen beliebigen Zeitraum von 1 Stunde bis 24 Stunden zu wählen. Optional zeigt er auch die Zielniveaus an, wenn beim Ausbruch aus der Spanne in eine beliebige Richtung gehandelt wird. Der Wert des Zielniveaus wird in Prozenten der Breite der vorherigen Spanne angegeben. Der Indikator ist die Verbesserung und Erweiterung der kostenlosen Version.
Er funktioniert auf Zeitrahmen von M1 bis H1. Er warnt bei den höheren Zeitrahmen.
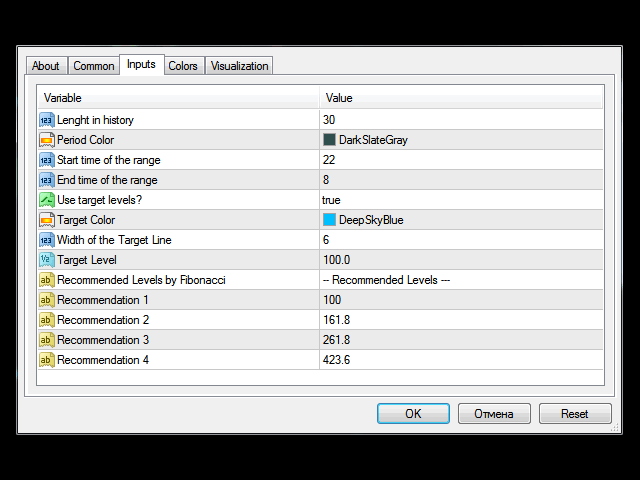
Einstellungen
- Länge in der Historie - Tiefe der Historie zur Anzeige der Bereiche
- Farbe des Zeitraums - Farbe des Rechtecks, das den Bereich hervorhebt
- Startzeit des Bereichs - Beginn des Bereichs
- Endzeitpunkt des Bereichs - Bereichsende
- Zielstufen verwenden - Anzeige der Zielstufen
- true - aktiviert
- falsch - deaktiviert
- Zielfarbe - Farbe der Ziellinie
- Breite der Ziellinie - Dicke der Ziellinie
- Zielniveau - Zielniveau in Prozent der Breite des Ausgangsbereichs