Kostenpflichtige technische Indikatoren für den MetaTrader 4 - 17
Discrete Trend bestimmt den vorherrschenden Trend. Dank des innovativen Algorithmus passt sich der Indikator automatisch an jeden Zeitrahmen und jedes Währungspaar an, so dass keine manuellen Anpassungen erforderlich sind. Der Indikator arbeitet auf Basis von Balkenabschlüssen. Daher ist es ratsam, Signale auf den bereits gebildeten Kerzen zu berücksichtigen. Das Produkt kann sowohl als Filter als auch als Hauptindikator verwendet werden.

A. Was ist A2SR ? * Es ist ein führender technischer Indikator (kein Repaint, kein Verzögern).
-- Orientierungshilfe : -- unter https://www.mql5.com/en/blogs/post/734748/page4#comment_16532516 -- und https://www.mql5.com/en/users/yohana/blog A2SR verfügt über eine spezielle Technik zur Bestimmung der Unterstützungsniveaus (Nachfrage) und des Widerstands (Angebot). Im Gegensatz zu der gewöhnlichen Methode, die wir im Internet gesehen haben, hat A2SR ein originelles Konzept zur Bestimmung de

Dieser Indikator ist für den M1-Zeitrahmen konzipiert und zeigt an: Die Summe der Ticks, wenn der Preis steigt (Farbe Grün - Die Hauptkomponente einer Kerze = der Körper). Summe der Punkte, wenn der Preis steigt (Farbe Grün - Die Verlängerungslinien am oberen Ende der Kerze). Summe der Punkte, wenn der Kurs sinkt (Farbe Rot -Die Hauptkomponente einer Kerze = der Körper). Summe der Punkte, wenn der Preis nach unten geht (Farbe Rot - Die Verlängerungslinien am unteren Ende der Kerze). Beachten Sie
Beschreibung Ein farbiger Multicurrency/Multisymbol-Indikator Aroon Global , der auf einem der dreiundzwanzig Standardindikatoren von MT4 basiert. Der Indikator besteht aus zwei Linien: Aroon Up und Aroon Down . Die Hauptfunktion des Indikators ist die Vorhersage des Trendwechsels. Der Indikator kann mit jedem Broker verwendet werden, unabhängig von der Bezeichnung des Finanzinstruments, da es notwendig ist, die Bezeichnung manuell als Eingabeparameter einzugeben. Wenn Sie einen nicht existieren

Einführung in Sideways Market Analyzer Ein bemerkenswerter Zeitraum mit geringer Volatilität und trendlosen Bewegungen auf dem Finanzmarkt wird als Seitwärtsmarkt bezeichnet. Früher oder später wird die geringe Volatilität zunehmen und der Kurs wird nach dem Seitwärtsmarkt einen Trend aufnehmen. Unter Handelsgesichtspunkten kann ein Seitwärtsmarkt als sehr guter Einstiegszeitpunkt für Händler dienen. Ein Sideways Market ist auch häufig Ausdruck einer Ansammlung von Großaufträgen von Großanlegern

Der FFx Dashboard MTF Alerter zeigt Ihnen auf einem einzigen Chart alle Zeitrahmen (M1 bis Monthly) mit ihrem jeweiligen Status für den Indikator an.
2 Alarm-Optionen: Einzelner Zeitrahmen: jeder ausgewählte Zeitrahmen wird separat alarmiert, wenn ein Signal auftritt Mehrere Zeitrahmen: alle ausgewählten Zeitrahmen müssen übereinstimmen, damit ein Alarm ausgelöst wird Beide Optionen verfügen über eine Eingabe zur Auswahl der Zeitrahmen, die für die Warnung(en) verwendet werden sollen.
Wie der

Der FFx Dashboard MTF Alerter zeigt Ihnen auf einem einzigen Chart alle Zeitrahmen (M1 bis Monthly) mit ihrem jeweiligen Status für den Indikator an.
2 Alarm-Optionen: Einzelner Zeitrahmen: jeder ausgewählte Zeitrahmen wird separat alarmiert, wenn ein Signal auftritt Mehrere Zeitrahmen: alle ausgewählten Zeitrahmen müssen übereinstimmen, damit ein Alarm ausgelöst wird Beide Optionen verfügen über eine Eingabe zur Auswahl der Zeitrahmen, die für die Warnung(en) verwendet werden sollen.
Wie ist

Three Moving Averages Message ist ein Benachrichtigungssystem für die MetaTrader 4 Plattform. Es besteht aus drei gleitenden Durchschnitten, die ihre eigenen einstellbaren Parameter haben. Die Linien Slow und Long bestimmen den langfristigen Trend, die Linien Fast und Slow den kurzfristigen. Wenn die Linien Fast und Slow während eines Trends gekreuzt werden, zeigt der Indikator eine Empfehlung zum Kauf (Verkauf) an. Wenn die Linien Slow und Long gekreuzt werden, meldet der Indikator den Beginn e

Der FFx Dashboard MTF Alerter zeigt Ihnen auf einem einzigen Chart alle Zeitrahmen (M1 bis Monthly) mit ihrem jeweiligen Status für den Indikator an.
2 Alarm-Optionen: Einzelner Zeitrahmen: Jeder ausgewählte Zeitrahmen wird separat alarmiert, wenn ein Signal auftritt. Mehrere Zeitrahmen: alle ausgewählten Zeitrahmen müssen übereinstimmen, damit ein Alarm ausgelöst wird. Beide Optionen verfügen über eine Eingabe zur Auswahl der Zeitrahmen, die für die Warnung(en) verwendet werden sollen.
Wie is

Der FFx Dashboard MTF Alerter zeigt Ihnen auf einem einzigen Chart alle Zeitrahmen (M1 bis Monthly) mit ihrem jeweiligen Status für den Indikator an.
2 Alarm-Optionen: Einzelner Zeitrahmen: jeder ausgewählte Zeitrahmen wird separat alarmiert, wenn ein Signal auftritt Mehrere Zeitrahmen: alle ausgewählten Zeitrahmen müssen übereinstimmen, damit ein Alarm ausgelöst wird Beide Optionen verfügen über eine Eingabe zur Auswahl der Zeitrahmen, die für die Warnung(en) verwendet werden sollen.
Wie ist
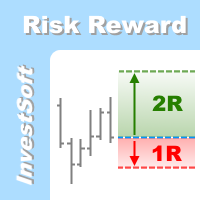
Dies ist die Forex visuelle Aufträge Werkzeug & Forex Positionsgröße (Lot) Rechner mit intuitiven Panel. Risk Reward Ratio Indicator funktioniert mit allen Arten von Symbolen: Währungspaare, Indizes, Metalle, Rohstoffe, Kryptowährungen, etc.
Wenn Sie sich vergewissern möchten, dass Risk Reward Ratio Indicator auf Ihren Lieblingssymbolen funktioniert, kontaktieren Sie uns (besuchen Sie unser Profil ) und fordern Sie eine kostenlose 7-Tage-Testversion an, um dieses Tool ohne Einschränkungen zu t

Ein Indikator für den Einstieg mit dem Trend und den rechtzeitigen Ausstieg. Er verfügt über eine Empfindlichkeitseinstellung, durch die er sowohl für langfristige als auch für kurzfristige Spekulationen verwendet werden kann. Die höchste Empfindlichkeit = 1, mit dieser Einstellung können Sie sogar auf M1 scalpen. Keine Verzögerung, kein Ausstieg nach Kerzenschluss. Eine der Einsatzmöglichkeiten: Einstieg nach dem Schließen einer Kerze, wenn die vertikale Linie aus gleichfarbigen Quadraten beste

Der FFx Dashboard MTF-Alarmer zeigt Ihnen auf einem einzigen Chart alle Zeitrahmen (M1 bis Monthly) mit ihrem jeweiligen Status an.
2 Alarm-Optionen: Einzelner Zeitrahmen: jeder ausgewählte Zeitrahmen wird separat alarmiert, wenn ein Signal auftritt Multi timeframes: alle ausgewählten Zeitrahmen müssen übereinstimmen, damit ein Alarm ausgelöst wird Beide Optionen verfügen über eine Eingabe zur Auswahl der Zeitrahmen, die für die Warnung(en) verwendet werden sollen.
Wie ist der Status zu verste

Der Profit Factor Indikator berechnet einen der drei Parameter: 1 - das Niveau des Markteintritts (im Parameter "Berechne den" - Market Open Trade), 2 - das Niveau des Stop Loss (Berechne den - Market Price Loss), 3 - das Niveau des Take Profit (Berechne den - Market Price Profit) - mit einem gewünschten Gewinn/Verlust-Verhältnis (Profit Factor), sowie die Losgröße (Handelsvolumen) entsprechend dem Wert des Risikoprozentsatzes der verfügbaren Mittel, der in den Einstellungen angegeben ist (ein e

Dies ist ein Zukunftsprognose-Indikator, der auf dem so genannten Backward WPR basiert. Der Indikator berechnet die bedingte Wahrscheinlichkeit von Umrechnungen zwischen WPR- und Backward-WPR-Werten auf der Grundlage der verfügbaren Kursentwicklung. Dann schätzt er die künftige Kursbewegung anhand dieser Wahrscheinlichkeiten und der letzten WPR-Werte. Der Backward WPR ist nichts Besonderes, außer dass er von rechts nach links gezählt wird, d.h. von der Zukunft in die Vergangenheit. Der Hauptvort
Power Trend Paid - der Indikator zeigt die Trendstärke im ausgewählten Zeitraum an.
Eingabe-Parameter Der Indikator hat die folgenden Eingabeparameter: Hauptlinie - eine optionale Funktion zum Zeichnen einer Linie auf den für die Berechnung des Indikators verwendeten Werten (in der kostenlosen Version nicht verfügbar). Periode - eine positive Zahl, die größer als eins ist und die Anzahl der für die Berechnungen verwendeten Candlesticks angibt. Wenn Sie eine oder Null eingeben, wird kein Fehler

Der Indikator bildet Fraktale auf Extrema des OsMA-Indikators
Erscheint auf dem Chart als Fraktal oder als Fraktalkanal.
Er ist flexibel einstellbar und verzögert sich im Gegensatz zu den Standardfraktalen nur um 1 Bar. Einstellungen:
DeepBars - die Anzeigetiefe des Indikators; Sensitivity_1_or_2 - 1 - für kleine Perioden von OsMA, 2 - für große Perioden; Arrow_or_channel - Anzeige auf dem Chart Fraktale oder Kanal; FastMA - Periode des schnellen gleitenden Durchschnitts; SlowMA - Periode des la

Wichtige Breakout- und Jump/Fall-Ebenen. Keine Verzögerung. Kein Nachzeichnen. Die Trendlinie ist nützlich für die Erkennung von Mustern, die für das Dreiecksmuster, Unterstützungs- und Widerstandslinien und als Ausbruchslinie nach oben oder unten bestimmt sind. Die Trendlinien werden zuerst gebildet, bevor der Preis des Paares sie erreicht. Sie werden also nicht neu gezeichnet. Jede Linie hat eine Beschreibung, z. B. Unterstützung, Widerstand, aktuelle Unterstützung als wichtiger Ausbruch nach

" Folgen Sie dem Wunsch des Marktes" . Der Indikator zeigt das "Verlangen" (Kraft) des Marktes auf dem aktuellen und dem höheren Zeitrahmen (TF), gibt die aktuellen und bestätigten Ziele an, identifiziert und zeigt die Widerstands- (Res) und Unterstützungslinien (Sup) des aktuellen und/oder älteren TF. Nicht immer deckt sich das Desire auf einem TF mit der Möglichkeit (reale Kursbewegung), aber das bestätigte Ziel wird immer in den folgenden "Leben" erreicht. Nicht immer haben benachbarte TFs id

Die Differenz zwischen dem arithmetischen und dem geometrischen Mittelwert im angegebenen Bereich. Je größer die Differenz zwischen den Werten ist, desto größer ist der resultierende Wert, d.h. der Indikator weist Volatilitätsschwankungen auf. The arithmetic mean of a certain number of values is the sum of the values divided by their number. Das geometrische Mittel ist die Wurzel aus der Potenz der Anzahl der Werte, die aus dem Produkt dieser Werte gezogen wird. Wenn alle Werte gleich sind,
Ein Indikator für das Muster #55 ("Dead cat bounce, inverted") aus Encyclopedia of Chart Patterns von Thomas N. Bulkowski.
Parameter: Alerts - Alarm anzeigen, wenn ein Pfeil erscheint Push - sendet eine Push-Benachrichtigung, wenn ein Pfeil erscheint (erfordert Konfiguration im Terminal) PeriodBars - Zeitraum des Indikators GapSize - Mindestgröße der Lücke in Punkten ArrowType - ein Symbol von 1 bis 17 ArrowVShift - vertikale Verschiebung der Pfeile in Punkten Auto5Digits - automatische Multip

Ein Indikator für die Muster #24, #25, #26 und #27 ("Head and Shoulders", "Complex Head and Shoulders") aus Encyclopedia of Chart Patterns von Thomas N. Bulkowski.
Parameter: Alerts - Alarm anzeigen, wenn ein Pfeil erscheint Push - sendet eine Push-Benachrichtigung, wenn ein Pfeil erscheint (erfordert Konfiguration im Terminal) PeriodBars - Zeitraum des Indikators K - ein zusätzlicher Parameter, der die Genauigkeit der Musterformerkennung beeinflusst. Je kleiner der Wert ist, desto glatter sol
Ein Indikator für die Muster #9 und #10 ("Cup with handle") aus Encyclopedia of Chart Patterns von Thomas N. Bulkowski.
Parameter: Alerts - Alarm anzeigen, wenn ein Pfeil erscheint Push - sendet eine Push-Benachrichtigung, wenn ein Pfeil erscheint (erfordert Konfiguration im Terminal) PeriodBars - Zeitraum des Indikators K1 - ein zusätzlicher Parameter, der die Erkennungsgenauigkeit und die Form des Musters beeinflusst (je niedriger der Wert, desto glatter ist die Tassenkante) K2 - ein zusätzl
Ein Indikator für die Muster #13 - #20 ("Double Tops" und "Double Bottoms", Typen Adam-Adam, Adam-Eva, Eva-Adam, Eva-Eva) aus Encyclopedia of Chart Patterns von Thomas N. Bulkowski. Adam - scharfe Tops/Bottoms, Eva - flache Tops/Bottoms. Parameter: Alerts - Warnung anzeigen, wenn ein Pfeil erscheint Push - sendet eine Push-Benachrichtigung, wenn ein Pfeil erscheint (erfordert Konfiguration im Terminal) PeriodBars - Zeitraum des Indikators K - ein zusätzlicher Parameter, der die Genauigkeit der M
Ein Indikator für die Muster #2 und #3 ("Broadening formation right-angled and ascending" und "Broadening formation right-angled and descending") aus Encyclopedia of Chart Patterns von Thomas N. Bulkowski.
Parameter: Alerts - Alarm anzeigen, wenn ein Pfeil erscheint Push - sendet eine Push-Benachrichtigung, wenn ein Pfeil erscheint (erfordert Konfiguration im Terminal) PeriodBars - Zeitraum des Indikators K - ein zusätzlicher Parameter, der die Genauigkeit der Musterformerkennung beeinflusst. J
Ein Indikator für die Muster #1 und #4 ("Broadening Tops" und "Broadening Bottoms") aus der Enzyklopädie der Chartmuster von Thomas N. Bulkowski. Version 1: unten, oben, unten, oben, Ausbruch nach oben. Version 2: oben, unten, oben, unten, oben Ausbruch.
Parameter: Alerts - Alarm anzeigen, wenn ein Pfeil erscheint Push - sendet eine Push-Benachrichtigung, wenn ein Pfeil erscheint (erfordert Konfiguration im Terminal) Variante1 - zeigt Version 1 des Musters an Variant2 - zeigt Version 2 des Must
Ein Indikator für die Muster #5 und #6 ("Wedges, ascending, broadening" und "Wedges, descending, broadening") aus Encyclopedia of Chart Patterns von Thomas N. Bulkowski.
Parameter: Alerts - Warnung anzeigen, wenn ein Pfeil erscheint Push - sendet eine Push-Benachrichtigung, wenn ein Pfeil erscheint (erfordert Konfiguration im Terminal) PeriodBars - Zeitraum des Indikators ArrowType - ein Symbol von 1 bis 17 ArrowVShift - vertikale Verschiebung der Pfeile in Punkten ShowLevels - Anzeige von Eben
Ein Indikator für die Muster #52 und #53 ("Falling/rising wedges") aus Encyclopedia of Chart Patterns von Thomas N. Bulkowski.
Parameter: Alerts - Warnung anzeigen, wenn ein Pfeil erscheint Push - sendet eine Push-Benachrichtigung, wenn ein Pfeil erscheint (erfordert Konfiguration im Terminal) PeriodBars - Zeitraum des Indikators K - ein zusätzlicher Parameter, der die Genauigkeit der Musterformerkennung beeinflusst ArrowType - ein Symbol von 1 bis 17 ArrowVShift - vertikale Verschiebung der Pf

Ein Indikator für die Muster #21, #22, #23 ("Flag") aus Encyclopedia of Chart Patterns von Thomas N. Bulkowski. Parameter: Alerts - Alarm anzeigen, wenn ein Pfeil erscheint Push - sendet eine Push-Benachrichtigung, wenn ein Pfeil erscheint (erfordert Konfiguration im Terminal) PeriodBars - Periode in Balken K - ein zusätzlicher Parameter, der die Genauigkeit der Musterformerkennung beeinflusst. Der Einfluss des Parameters wird sichtbar, wenn nicht alle Mustervarianten aktiviert sind (nicht alle
Gap-Indikator (Muster #23) aus Encyclopedia of Chart Patterns von Thomas N. Bulkowski.
Parameter: Alerts - Warnung anzeigen, wenn ein Pfeil erscheint Push - sendet eine Push-Benachrichtigung, wenn ein Pfeil erscheint (erfordert Konfiguration im Terminal) GapSize - Mindestgröße der Lücke in Punkten ArrowType - ein Symbol von 1 bis 17 ArrowVShift - vertikale Verschiebung der Pfeile in Punkten Auto5Digits - automatische Multiplikation von GapSize und ArrowVShift mit 10 bei der Arbeit mit 5- und 3-
Ein Indikator für die Muster #24 und #26 ("Head and Shoulders") aus Encyclopedia of Chart Patterns von Thomas N. Bulkowski. Parameter: Alerts - Alarm anzeigen, wenn ein Pfeil erscheint Push - sendet eine Push-Benachrichtigung, wenn ein Pfeil erscheint (erfordert Konfiguration im Terminal) PeriodBars - Zeitraum des Indikators K - ein zusätzlicher Parameter, der die Genauigkeit der Musterformerkennung beeinflusst ArrowType - ein Symbol von 1 bis 17 ArrowVShift - vertikale Verschiebung der Pfeile
Ein Indikator für die Muster #28 und #29 ("Horn bottoms" und "Horn tops") aus Encyclopedia of Chart Patterns von Thomas N. Bulkowski. Parameter: Alerts - Alarm anzeigen, wenn ein Pfeil erscheint Push - sendet eine Push-Benachrichtigung, wenn ein Pfeil erscheint (erfordert Konfiguration im Terminal) BarsInsideFrom - Mindestanzahl von Bars zwischen den Tops BarsInsideAdd - die Anzahl der Bars zwischen den Tops kann im Bereich von BarsInsideFrom bis BarsInsideFrom+BarsInsideAdd-1 liegen. Wenn der
Ein Indikator für das Muster #31 ("Long Island") aus der Encyclopedia of Chart Patterns von Thomas N. Bulkowski. Parameter: Alerts - Warnung anzeigen, wenn ein Pfeil erscheint Push - sendet eine Push-Benachrichtigung, wenn ein Pfeil erscheint (erfordert Konfiguration im Terminal) GapSize - Mindestgröße der Lücke in Punkten ArrowType - ein Symbol von 1 bis 17 ArrowVShift - vertikale Verschiebung der Pfeile in Punkten ShowLevels - zeigt Ebenen an ColUp - Farbe einer aufwärts gerichteten Linie ColD

Ein Indikator für Muster #31 ("Long Island") aus Encyclopedia of Chart Patterns von Thomas N. Bulkowski. Die zweite Lücke verläuft in die entgegengesetzte Richtung.
Parameter: Alerts - Warnung anzeigen, wenn ein Pfeil erscheint Push - sendet eine Push-Benachrichtigung, wenn ein Pfeil erscheint (erfordert Konfiguration im Terminal) GapSize - Mindestgröße der Lücke in Punkten ArrowType - ein Symbol von 1 bis 17 ArrowVShift - vertikale Verschiebung der Pfeile in Punkten ShowLevels - zeigt Ebenen
Ein Indikator für die Muster #32 und #33 ("Measured Move Up/Down") aus Encyclopedia of Chart Patterns von Thomas N. Bulkowski. Parameter: Alerts - Alarm anzeigen, wenn ein Pfeil erscheint Push - sendet eine Push-Benachrichtigung, wenn ein Pfeil erscheint (erfordert Konfiguration im Terminal) PeriodBars - Zeitraum des Indikators MinMovment - minimaler Bewegungswert (in Punkten) BackMovment - maximaler Wert der Rückbewegung (in Dezimalwerten) ArrowType - ein Symbol von 1 bis 17 ArrowVShift - verti
Ein Indikator für die Muster #35 und #36 ("Pipe bottoms" und "Pipe tops") aus Encyclopedia of Chart Patterns von Thomas N. Bulkowski. Parameter: Alerts - Alarm anzeigen, wenn ein Pfeil erscheint Push - sendet eine Push-Benachrichtigung, wenn ein Pfeil erscheint (erfordert Konfiguration im Terminal) PeriodBars - Eine Indikatorperiode (Anzahl der Balken, die ein Top/einen Bottom bilden) K1 - ein zusätzlicher Parameter, der die Genauigkeit der Musterformerkennung beeinflusst K2 - ein zusätzlicher
Ein Indikator für die Muster 7 und 8 ("Bump-and-Run" und "Bump-and-Run Reversal") aus der Encyclopedia of Chart Patterns von Thomas N. Bulkowski. Parameter: Alerts - Warnung anzeigen, wenn ein Pfeil erscheint Push - sendet eine Push-Benachrichtigung, wenn ein Pfeil erscheint (erfordert Konfiguration im Terminal) PeriodBars - Zeitraum des Indikators K - ein zusätzlicher Parameter, der die Genauigkeit der Musterformerkennung beeinflusst ArrowType - Zeichen: von 1 bis 17 ArrowVShift - vertikale Ve
Ein Indikator für die Muster #37 und #38 ("Rectangle Tops" und "Rectangle Bottoms") aus Encyclopedia of Chart Patterns von Thomas N. Bulkowski. Parameter: Alerts - Warnung anzeigen, wenn ein Pfeil erscheint Push - sendet eine Push-Benachrichtigung, wenn ein Pfeil erscheint (erfordert Konfiguration im Terminal) PeriodBars - Zeitraum des Indikators VertexCount - Anzahl der Tops und Bottoms: 2, 3, 4. ArrowType - ein Symbol von 1 bis 17 ArrowVShift - vertikale Verschiebung der Pfeile in Punkten Show
Ein Indikator für die Muster #11 und #12 ("Diamond Tops" und "Diamond Bottoms") aus der Encyclopedia of Chart Patterns von Thomas N. Bulkowski. Parameter: Alerts - Alarm anzeigen, wenn ein Pfeil erscheint Push - sendet eine Push-Benachrichtigung, wenn ein Pfeil erscheint (erfordert Konfiguration im Terminal) PeriodBars - Zeitraum des Indikators K - ein zusätzlicher Parameter, der die Genauigkeit der Musterformerkennung beeinflusst ArrowType - ein Symbol von 1 bis 17 ArrowVShift - vertikale Vers
Ein Indikator für die Muster #39 und #40 ("Rounding Tops" und "Rounding Bottoms") aus Encyclopedia of Chart Patterns von Thomas N. Bulkowski. Parameter: Alerts - Warnung anzeigen, wenn ein Pfeil erscheint Push - sendet eine Push-Benachrichtigung, wenn ein Pfeil erscheint (erfordert Konfiguration im Terminal) PeriodBars - Zeitraum des Indikators K - ein zusätzlicher Parameter, der die Genauigkeit der Musterformerkennung beeinflusst. Kann von 0 auf 1 geändert werden. ArrowType - ein Symbol von 1
Ein Indikator für das Muster #49 ("Triangle, symmetrical") aus Encyclopedia of Chart Patterns von Thomas N. Bulkowski. Parameter: Alerts - Alarm anzeigen, wenn ein Pfeil erscheint Push - sendet eine Push-Benachrichtigung, wenn ein Pfeil erscheint (erfordert Konfiguration im Terminal) PeriodBars - Zeitraum des Indikators K - ein zusätzlicher Parameter, der die Genauigkeit der Musterformerkennung beeinflusst ArrowType - ein Symbol von 1 bis 17
ArrowVShift - vertikale Verschiebung der Pfeile in Pu
Ein Indikator für die Muster #47 und #48 ("Triangle, ascending" und "Triangle, descending") aus Encyclopedia of Chart Patterns von Thomas N. Bulkowski.
Parameter: Alerts - Warnung anzeigen, wenn ein Pfeil erscheint Push - sendet eine Push-Benachrichtigung, wenn ein Pfeil erscheint (erfordert Konfiguration im Terminal) PeriodBars - Zeitraum des Indikators K1 - ein zusätzlicher Parameter, der die Genauigkeit der Musterformerkennung beeinflusst K2 - ein zusätzlicher Parameter, der die Genauigkeit

Der Heatmap-Indikator Mit diesem Heatmap-Indikator können Sie eine "Heatmap" aller in der Market Watch ausgewählten Symbole anzeigen. In dieser Version zeigt es die prozentuale Kursänderung im Verhältnis zum letzten Tagesschluss an, was einen schnellen Überblick über den Markt geben kann. Dies ist ein Tool, das Händlern hilft, herauszufinden, wie stark eine Währung im Verhältnis zu allen anderen Paaren ist. Dies ist ein visuelles Werkzeug und kann nicht in Expert Advisors verwendet werden. In d

Der Indikator findet die markantesten Extremwerte (Höchst- und Tiefstwerte) in der Geschichte und zeigt deren Kursniveaus für den aktuell sichtbaren Kursbereich an. Es werden maximal 8 Niveaus angezeigt. Dies ist ein Werkzeug für diejenigen, die in der Geschichte nach wichtigen Niveaus suchen, die durch Ausreißer von Umkehrpunkten gebildet werden. Wenn die Preisskala manuell geändert oder automatisch an Änderungen der Zeitskala angepasst wird, zeigt der Indikator alle gefundenen Niveaus (falls v

Der MACD Converter ist ein Analogon des MACD Message mit erweiterten Funktionen: Er hat zwei Signallinien: Signallinie 1 und Linie 2, die Balkenumrisse werden entsprechend der Linie 1 eingefärbt, er löst auch die Trendbenachrichtigungen aus. Der MACD Konverter konvertiert die Parameter von Fast MA, Slow MA und Signal Line 1 und Line 2 von dem in den Einstellungen (Convert Time Frame) angegebenen Intervall in kleinere Zeitrahmen. Dies ermöglicht es, ein Signal zu erhalten, um eine Entscheidung in

NewsMomentum ist ein Indikator, der den Markt zwischen den angegebenen Stunden überwacht und eine Warnung zum potenziellen Kauf oder Verkauf sendet, wenn die Dynamik des Marktes so zunimmt, dass es eine Reaktion auf die Nachrichten für das beobachtete Währungspaar geben könnte. Wie immer ist es am besten, diese Bewegungen mit anderen Faktoren wie Unterstützungs- und Widerstandsdurchbrüchen zu bestätigen. Dieser Indikator funktioniert auf jedem Zeitrahmen, aber es wird empfohlen, ihn auf einem kl
Der Indikator ist für die einfache Konstruktion von synthetischen Charts auf der Grundlage von Daten verschiedener Finanzinstrumente konzipiert. Er ist sowohl für den Arbitrage- und Paarhandel als auch für Analysezwecke nützlich. Sein Hauptvorteil ist die Einfachheit und Klarheit. Jedes Diagramm wird in Form einer gemeinsamen mathematischen Formel dargestellt. Wenn Sie beispielsweise den Spread (Unterschied) zwischen EURUSD und GBPUSD mit den Koeffizienten 4 und 3 darstellen möchten, geben Sie d
Verwenden Sie bei Ihrem Handel dynamische Bandbreiten (wie Bollinger Bänder oder Hüllkurven)? Normalerweise wird bei solchen Berechnungen ein fester Zeitraum verwendet, aber spiegelt dies die Natur des Marktes wider? In der Tat besteht das Preisdiagramm aus einer Reihe von aufeinander folgenden Prozessen - Trends und Flats. In diesem Fall können wir nur über die interne Entwicklungslogik innerhalb eines einzigen Prozesses sprechen. Dementsprechend passen die dynamischen Bandbreiten, die für den
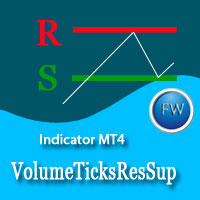
Der Marktpreis wird von den Market-Makern mit großem Eigenkapital bewegt. Die einzige Möglichkeit, die Absichten der großen Akteure zu verstehen, besteht darin, ihre Aktivitäten anhand der Konzentration des Volumens auf einer bestimmten Ebene zu verfolgen. Volume Ticks ResSup zeichnet ein Niveau mit der maximalen Konzentration eines Tick-Volumens seit Beginn des Tages. In den meisten Fällen handelt es sich dabei um ein tatsächliches Unterstützungs- oder Widerstandsniveau. Parameter ColorLevelSup

Dies ist ein Multi-Timeframe (MTF) Indikator, der Unterstützungs- und Widerstandslinien anzeigt. Die Unterstützungs- und Widerstandslinien werden automatisch aus drei höheren Zeitrahmen (TF) berechnet. Händler können Unterstützungs- und Widerstandslinien nutzen, um Positionen einzugehen und einen Stop-Loss-Wert zu aktualisieren.
Eingabe-Parameter bPeriod - verwenden Sie diesen Parameter, um die Indikatoren für jeden Zeitrahmen zu optimieren; VisibleBars - für wie viele Bars (ab dem aktuellen) d

Einführung in den Harmonic Pattern Scenario Planner
Der gegenwärtige Zustand des Devisenmarktes kann viele verschiedene mögliche Preispfade durchlaufen, um sein zukünftiges Ziel zu erreichen. Die Zukunft ist dynamisch. Daher ist die Planung Ihres Handels mit möglichen Zukunftsszenarien ein wichtiger Schritt für Ihren Erfolg. Um einem solch mächtigen Konzept gerecht zu werden, stellen wir Ihnen den Harmonic Pattern Scenario Planner vor, das erste prädiktive Harmonic Pattern Tool der Welt unter

Der Hauptzweck dieses Indikators besteht darin, 2 Linien möglicher Trailing Stop Loss-Werte anzuzeigen: Gelbe/Aqua-Linie für einen Trailing Stop Loss, der näher am aktuellen Kurs liegt Orange/Blaue Linie für einen riskanteren (aber profitableren) Trailing Stop Loss. Wenn die Linie (die wie eine Treppe aussieht) ihre Farbe von Gelb zu Aqua (Linie 1) und/oder von Orange zu Blau (Linie 2) ändert, bedeutet dies, dass sich ein Trend in sein Gegenteil verkehrt hat. Dieser Indikator kann also auch für

Dieser Indikator basiert auf dem klassischen Indikator "Relative Strength Index". IT zeichnet 2 Linien: Die blaue Hauptlinie mit dem Eingabeparameter RSIPeriod . Signal rote Linie. Kaufen , wenn die Hauptlinie (Blau) unter ein bestimmtes Niveau = 30 fällt und dann über dieses Niveau ansteigt und die Hauptlinie über die Signallinie (Rot) ansteigt. Verkaufen , wenn die Hauptlinie (Blau) über ein bestimmtes Niveau = 70 ansteigt und dann unter dieses Niveau fällt und die Hauptlinie unter die Signall

Dieser Indikator ist für den M1-Zeitrahmen konzipiert und zeigt an: Summe der Ticks, wenn der Preis steigt, geteilt durch die Summe der Ticks, wenn der Preis fällt (rote Farbe); die Summe der Punkte, wenn der Kurs steigt, geteilt durch die Summe der Punkte, wenn der Kurs fällt (grüne Farbe). Die Korrelation zwischen der Anzahl der Ticks und der Anzahl der Punkte für jede einzelne Minute liefert genügend Daten für das Scalping.
Dieser Indikator wird Ihr Handelsleben vereinfachen. Der Indikator hat keine Eingabeparameter. Rote Pfeile zeigen den Beginn eines Abwärtstrends an und es ist ein guter Zeitpunkt, um eine Short-Position zu eröffnen. Grüne Pfeile zeigen den Beginn eines Aufwärtstrends an, und es ist ein guter Zeitpunkt, um eine Long-Position zu eröffnen.

Dieser Indikator wurde von М & W Wave Patterns von A. Merrill inspiriert. 5 Extremwerte oder 4 Kanten von ZigZag reichen aus, um ein M- oder W-Muster an einem beliebigen Offset in der Geschichte zu bilden. Der klassische Ansatz beinhaltet eine Tabelle mit vordefinierten Zahlen von ZigZag-Wellen, die sich nach bestimmten Regeln ineinander umwandeln können, so dass die nächste Kante auf der Grundlage dieser Regeln vorhergesagt werden kann. Im Gegensatz zu diesem Ansatz analysiert der Indikator die

Der EwoMov-Indikator ist nützlich, um einen Trend mit höheren gleitenden Preisdurchschnitten zu bestimmen (er sollte höher als 200 sein).
Ich verwende diesen Indikator für Swing-Trade auf M5-M30-Charts.
Dieser Indikator verwendet zur Berechnung mehrere Balken. Sie werden alle in externen Parametern gespeichert. Die richtigen Werte sind 5 - 13 - 34, aber Sie können sie ändern.
Es ist für alle Zeitrahmen geeignet, gibt aber sein Bestes für M5-H1. Es ist so konzipiert, dass es für andere Zeitra

Dieser Indikator hat nur einen Eingabeparameter - Alerts. Wenn Alerts wahr ist, wird eine Warnmeldung angezeigt, wenn ein Long- oder Short-Trend beginnt. Jede Meldung enthält: Zeit, Name des Währungspaares und den aktuellen Zeitrahmen. Ein grüner Pfeil zeigt einen Aufwärtstrend an. Ein roter Pfeil zeigt einen Abwärtstrend an. Dieser Indikator ist hilfreich, wenn man sich für eine Kauf- oder Verkaufsposition entscheidet.
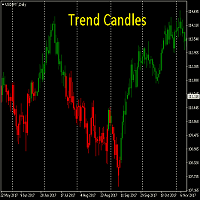
Erkennen Sie den TREND auf den ersten Blick. Die Fähigkeit, sofort zu erkennen, in welche Richtung sich der Markt bewegt. Dies ist ein Muss für alle Trendhändler. Funktioniert auf allen Zeitrahmen. Kein Optimieren erforderlich
Wiederholt sich nicht, wenn die Kerze geschlossen ist Die Trendkerzen sind ein großartiges Werkzeug, um die Standardkerzen zu ersetzen. Sie helfen auch, die Unordnung auf Ihren Charts zu reduzieren und zeigen Ihnen, was Sie sehen müssen - RICHTUNG
Werden Sie Mitglied in m

Dieser Indikator berechnet den nächstmöglichen Balken für jedes Währungspaar und jeden Zeitrahmen. Wenn der nächstmögliche Schlusskurs größer als der Eröffnungswert ist, wird der nächstmögliche Balken in der Farbe Aqua angezeigt. Wenn der nächstmögliche Schlusskurs kleiner als der Eröffnungswert ist, wird der nächstmögliche Balken in Orange angezeigt. Natürlich zeigt der nächste mögliche Balken nicht die große Preisbewegung an. Dieser Indikator ist am nützlichsten in der ruhigen Zeit.

Dieser Indikator ist für den M1-Zeitrahmen konzipiert und zeigt an: Die Summe der Ticks, wenn der Preis steigt (Farbe Grün - Die Hauptkomponente einer Kerze = der Körper). Summe der Punkte, wenn der Preis steigt (Farbe Grün - Die Verlängerungslinien am oberen Ende der Kerze). Summe der Punkte, wenn der Kurs sinkt (Farbe Rot -Die Hauptkomponente einer Kerze = der Körper). Summe der Punkte, wenn der Preis nach unten geht (Farbe Rot - Die Verlängerungslinien am unteren Ende der Kerze). Zusätzlich w
Riskscope zeigt alle relevanten Informationen über Ihre Trades auf dem Bildschirm an. Informationen zu Stop Loss und Take Profit können als Preis, Pips oder Exposure angezeigt werden. Außerdem kann Riskscope eine Hoch- und Niedrigwasser-Marke des Gesamtbetrags Ihres Handelskorbs anzeigen. Einstellungen Die Standardeinstellungen von Riskscope sind in den meisten Fällen gut genug. Fast alle von ihnen sind ziemlich standardisiert. Hier sind die Einstellungen, die einer Erklärung bedürfen. Monospace
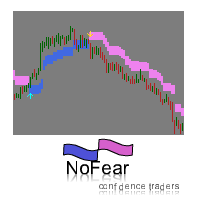
Der NoFear-Indikator basiert auf dem Advanced Moving Average. Er wird in der technischen Chartanalyse verwendet und liefert Signale, sobald eine Kursänderung auftritt, die die obere oder untere Grenze überschreitet. Der Indikator funktioniert sehr gut auf Trendmärkten. Anhand der blauen/violetten Pfeile ist es einfach, gute Einstiegspunkte zu finden. Die oberen und unteren Bänder sollten als Unterstützungs-/Widerstandsniveaus und Stopp-/Ausstiegspunkte verwendet werden. Alle Signale wiederholen
Der Zig-Zag-Indikator ist äußerst nützlich für die Bestimmung von Preistrends, Unterstützungs- und Widerstandsbereichen und klassischen Chartmustern wie Kopf und Schultern, Doppelböden und Doppelspitzen. Dieser Indikator ist ein Multi Time Frame Indikator. Der Indikator berechnet automatisch die 3 nächsten verfügbaren TF und sät ZigZag aus diesen TimeFrames. Sie können diesen Indikator nicht für die TF größer als D1 (täglich) verwenden.

Legen Sie den Indikator einfach auf dem Chart ab und die Fibonacci-Levels werden automatisch angezeigt! Der Indikator wurde für das automatische Zeichnen von Fibonacci-Levels auf dem Chart entwickelt. Er bietet die Fähigkeiten zu: Auswahl der anzuzeigenden Standard-Fibonacci-Levels Hinzufügen von benutzerdefinierten Niveaus Zeichnen des Indikators auf anderen Zeitrahmen als dem aktuellen. Zum Beispiel wird der Indikator für die wöchentliche Periode (W1) berechnet und für die monatliche Periode (

Der MACD bietet das Beste aus beiden Welten: Trendfolge und Momentum. Händler können nach Signallinienüberkreuzungen, Mittellinienüberkreuzungen und Divergenzen suchen, um Signale zu generieren. Da der MACD nicht begrenzt ist, ist er nicht besonders nützlich, um überkaufte und überverkaufte Niveaus zu erkennen. Es ist nicht einfach, einen Indikator auf kleineren Zeitrahmen zu verwenden, da der Händler nicht vom Bildschirm wegschauen kann. Dieser klassische Indikator verfügt über eine "Alert"-Fun
Der MetaTrader Market ist eine einzigartige Plattform für den Verkauf von Robotern und technischen Indikatoren.
Das Merkblatt für Nutzer der MQL5.community informiert Sie über weitere Möglichkeiten: nur bei uns können Trader Handelssignale kopieren, Programme bei Freiberuflern bestellen, Zahlungen über das Handelssystem automatisch tätigen sowie das MQL5 Cloud Network nutzen.
Sie verpassen Handelsmöglichkeiten:
- Freie Handelsapplikationen
- Über 8.000 Signale zum Kopieren
- Wirtschaftsnachrichten für die Lage an den Finanzmärkte
Registrierung
Einloggen
Wenn Sie kein Benutzerkonto haben, registrieren Sie sich
Erlauben Sie die Verwendung von Cookies, um sich auf der Website MQL5.com anzumelden.
Bitte aktivieren Sie die notwendige Einstellung in Ihrem Browser, da Sie sich sonst nicht einloggen können.