Kostenpflichtige technische Indikatoren für den MetaTrader 4 - 13

Ich habe eine sehr gefragte Anfrage für ein Footprint-Diagramm hinzugefügt. Der Indikator ist sehr einfach und zeigt Geld- und Briefvolumen. Es ist kein Signalindikator, es zeigt nur die Volumina in den Kerzen und zeigt auch vergangene Werte an. Forex hat kein zentralisiertes Volumen, aber dieses bricht auf und zeigt das Tick-Volumen an. Beim Verkauf von Kerzen werden die Nachfragen und beim Kauf von Kerzen die Gebote angezeigt. Kann als einzelnes Analysesystem oder mit anderen Faktoren gehande
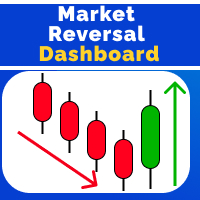
Market Reversal Catcher Dashboard indicator looks for market reversal points or major pullback. To do this, it analyzes previous price movements and using a flexible algorithm for estimating the probability of a reversal, also gives recommendations on entry points and sets recommended profit targets for positions opened on a signal. The dashboard is designed to sit on a chart on it's own and work in the background to send you alerts on your chosen pairs and timeframes. Dashboard does not requi

SMARTMASS INDICATOR This indicator is different from all known volume indicators. It has a significant distinction; it is an algorithm that relates price movement to volume, attempting to find proportionality and efficient movement while filtering out noise and other movements that are more random and do not follow a trend or reversal. Ultimately, it reveals the true strength of the movement, indicating whether it has genuine support from bulls or bears or if it's merely a high-volume movement

"SOLVE ALL YOUR PROBLEMS FOREVER WITH THIS UNIQUE TRADING SYSTEM!" Buy Trend Reversing PRO Indicator And You Will Get Forex Trend Commander Indicator for FREE !
The one who makes money from the forex market, wins by doing something very simple, he wins 6 out of every 10 trades. Of course for this you need a good indicator and proper money management if you ever hope to become a profitable trader. Anyone who doesn't do so ALWAYS ends up empty handed! Because, I'll say it again: "Traders who don

Wir stellen Ihnen Auto Trendline vor, den innovativen MT4-Indikator, der das
Zeichnen von Trendlinien in Ihren Diagrammen automatisiert. Verabschieden Sie sich von der mühsamen und zeitaufwändigen Aufgabe, Trendlinien manuell zu zeichnen,
und lassen Sie Auto Trendline die Arbeit für Sie erledigen!
*Kontaktieren Sie mich nach dem Kauf, um Ihnen Anweisungen und eine Schritt-für-Schritt-Anleitung zu senden.
Mit seinem fortschrittlichen Algorithmus erkennt und zeichnet Auto Trendline aut

Der Indikator zeigt die Höchst-/Tiefst-/Eröffnungs-/Schlussniveaus aus anderen (und nicht standardmäßigen) Zeitrahmen an – Jahr, 6 Monate, 4 Monate, 3 Monate, 2 Monate, Monat, Woche, Tag, H3-H6-H8-H12 Stunden . Sie können auch die Verschiebung für das Öffnen von Kerzen festlegen und virtuelle Kerzen erstellen. „Periodentrennzeichen“ für einen dieser Zeitrahmen sind in Form vertikaler Linien verfügbar. Alarme können für Ausbrüche des aktuellen oder vorherigen Niveaus konfiguriert werden (Ausbruc

Multicurrency and multitimeframe modification of the Commodity Channel Index (CCI) indicator. You can specify any desired currencies and timeframes in the parameters. Also, the panel can send notifications when crossing overbought and oversold levels. By clicking on a cell with a period, this symbol and period will be opened. This is MTF Scanner. The key to hide the dashboard from the chart is "D" by default.
Parameters CCI Period — averaging period.
CCI Applied price — price type.
Clear

Overview Automated smart money market structure identification following smart money concept and inner circle trader concept, it gives an unprecedented edge on your smart money and market structure analysis by automatically identifies valid market structure using smart money concept: Identify impulsive and corrective moves Identify valid pullbacks built by impulsive and corrective market moves Idenitfy bearish or bullish leg and their inducements for smart money concept Identify valid market st

DAYTRADING nur für Aktien (CFDs).
Der Handel erfordert Arbeit. Es gibt keine Abkürzungen oder Indikatoren, die Ihnen alle Ein- und Ausgänge mitteilen. Profit kommt von der Geisteshaltung. Indikatoren sind Werkzeuge, die in Verbindung mit Geldmanagement und Erfolgspsychologie verwendet werden. Finden Sie Ungleichgewichte im Volumenprofil. Handelspreis-Volumen-Ungleichgewichte.
Viele Ungleichgewichte treten beim Schließen und Öffnen und bei Nachrichten auf. Sehen Sie sich die Käufer vs. Verkä

Das Ziel des Dashboards ist es, einen schnellen Überblick über die tägliche, wöchentliche und monatliche Bandbreite der konfigurierten Assets zu geben. Im "Single-Asset-Modus" zeigt Ihnen das Dashboard mögliche Umkehrpunkte direkt im Chart an und macht so Statistiken direkt handelbar. Wird ein konfigurierter Schwellenwert überschritten, kann das Dashboard einen Bildschirm-Alarm, eine Benachrichtigung (an den mobilen MT4) oder eine E-Mail versenden.
Es gibt verschiedene Möglichkeiten, diese I

v. 1.0 This indicator can show with maximum accuracy up to 1 bar the presence of a Maximum/minimum on the chart, regardless of the timeframe. It has a flexible configuration. You can use either one value on all TF, or you can use your own value on each TF individually.
This indicator is already being improved and those who purchase it receive all updates for free.
Next, it is planned to display an indication of the strength of the pivot point at each extremum (in % or in color drawing). It

This strategy is best used for Scalping and Binary Options. Strategy: There are 3 EMAs: Faster, Medium and Slower. When Price is Trending, wait for Price to bounce an EMA and scalp at each bounce. Features: - Check if 3 MAs are Stacked - Check Price Bounce Off MAs (Faster, Medium, Slower) - Min Distance Between Faster and Medium MA Filter - Max Distance Between Entry Price and Faster MA Filter - High Volume Check - Heiken Trend Check - Volatility Check - Higher/Lower Timeframes MA Stacked check
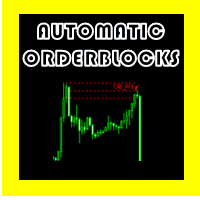
AUTOMATIK-ORDERBLÖCKE OSW
(METATRADER 5)
Dieser Indikator ist dafür verantwortlich, die Orderblöcke nach einigen vordefinierten Regeln anzuzeigen, darunter:
> dass es einen Impuls gibt, der den vorherigen Impuls bricht.
>Wenn es gefunden wird, ist es dafür verantwortlich, das gebildete Candlestick-Muster zu finden, das Hoch und Tief des Ortes auf die effizienteste Weise zu berechnen und das Hoch und Tief des Orderblocks zu erstellen.
>Nachdem der Orderblock erstellt wurde, überprüft d

Der Choppines-Roboter wird als Indikator im MT4-Indikatorordner geladen
Es wird empfohlen, eine Kerzenzeit von 5 Minuten zu verwenden, die empfohlene Ablaufzeit des Roboters beträgt 5 Minuten.
Der Roboter kann so konfiguriert werden, dass er Signale an die Plattformen MT2, MX2 und PRICEPRO sendet. Um Signale zu senden, müssen Sie das Connector-Programm der Plattform verwenden, mit der wir arbeiten möchten.
Führen Sie zur Installation auf dem Connector das folgende Verfahren durch (ein Bil
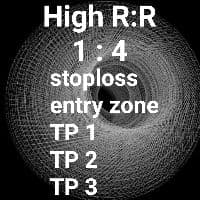
Fibonacci Breakout ist eine Handelsstrategie, die das Fibonacci-Retracement verwendet. Diese Technik ist eigentlich eine Technik, die es uns ermöglicht, den Anfang des Trends zu betreten. Es ist auch für Anfänger sehr leicht zu verstehen. Die Strategie besteht darin, dass Sie nur auf das Erscheinen der automatischen benutzerdefinierten Fibonacci warten müssen, dann manuell Ihre ausstehende Order platzieren, den Verlust stoppen und den Gewinn auf dem Niveau von Fibonacci mitnehmen. Die Position

Scalping Binary option Pro is a dial gauge. --------complete lack of redrawing ---------
The indicator does not work correctly in the strategy tester.
The red down arrow indicates that sales should be considered, and the green one - up (purchases).
All that needs to be set up is the colors of the signal arrows, as well as the activation or deactivation of the sound signal when a signal appears in one direction or another.
It is best to use high-pair pairs with a small spread in tradin
Dieser Indikator scrollt mehrere Charts gleichzeitig, wenn Sie den Chart scrollen, an den der Indikator angehängt ist. Es ist nützlich für das Backtesting von Multi-Timeframe-Strategien, Multi-Pair-Strategien, die gleichzeitige Überwachung mehrerer Charts und den Rückblick, um zu sehen, wie sich mehrere Märkte gleichzeitig in der Vergangenheit entwickelt haben. Der Indikator ist leichtgewichtig und kann verwendet werden, um bis zu 99 Diagramme gleichzeitig zu verschieben.

Bar Strength Divergence Indicator for MT4 BarStrength Indicator is an exclusive indicator to trade Forex, Stocks, Indices, Futures, Commodities and Cryptos.
BarStrength Indicator shows the strength of each candle.
The indicator shows in a separate windows candles relatively to 2 price levels representing resistance and support in the market.
Once candle is near resistance it is highly probable that price movement will change direction and will go down in the next candles.
Once candle is
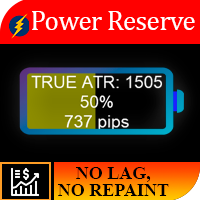
Arbeitslogik Die Bedeutung dieses Indikators liegt darin, dass Sie erkennen können, wie viel „Brennstoff noch auf dem Instrument ist“. Stellen Sie sich die Situation vor, Sie haben ein Auto mit halb entladener Batterie verlassen, im Durchschnitt reicht diese Energiemenge normalerweise für ein Auto für 250 km, wenn Sie also möchten, können Sie eine Strecke von 700 km nicht überwinden. Für jedes Instrument gibt es also eine bestimmte tägliche Preisbewegung, und als Ergebnis statistischer Beobacht

M1 Scalper System ist ein einzigartiges manuelles Scalping-Handelssystem. Dieses Handelssystem analysiert automatisch den Markt, bestimmt Preisumkehrpunkte und zeigt dem Händler, wann er Orders öffnen und schließen muss. Dieses System zeigt alle Informationen, die ein Trader benötigt, visuell auf dem Chart an. M1 Scalper System - sendet einen Händler an das Telefon und E-Mail-Signale! Sie müssen also nicht ständig am PC sitzen und auf ein Signal warten. Wenn auf dem Markt ein gutes Signal zur

Dieses Produkt dient zur Anzeige der Handelssitzungen von 15 Ländern basierend auf der Zeitzone Ihres Broker-Servers und verschiedenen Anzeigemodi basierend auf Ihren gewünschten Einstellungen, um eine Überlastung der Diagramme zu verhindern und die Möglichkeit zu bieten, eine Sitzung mit der vom Benutzer gewünschten Zeit festzulegen.
Auf dem Forex-Markt geht die Sonne nie unter, aber ihr Rhythmus tanzt im Takt der verschiedenen Handelssitzungen. Das Verständnis dieser Sitzungen, ihrer Übersc

All patterns from Encyclopedia of Chart Patterns by Thomas N. Bulkowski in one indicator. It draws an up or down arrow whenever a pattern is identified. Patterns are selected in the drop-down list of the Pattern variable (located at the beginning of the properties window). The indicator has numerous external parameters, some of them apply to all patterns, while others are selective. To see more information on the parameters used for the selected pattern, enable the ShowHelp variable (located at
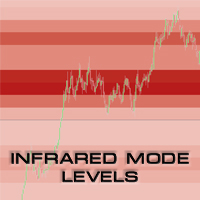
UPDATE 3 - Scan what you see - the indicator will scan and draw levels for all VISIBLE bars on the chart, rather than Current Bar - till first visible bar on the chart (historical bar on the left side). Assumption is, if you are going back in history and you want to check levels, you care about that specific moment in time and what the levels were during that moment (excluding data of the future which is not visible). UPDATE 2 - version 2.1 introduces the "Always ON" feature. If enabled, you ca
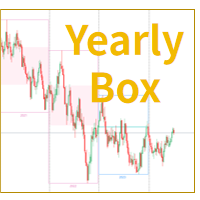
MT4 Jahreskerzenbox-Indikator
Der "Jahreskerzenbox"-Indikator auf der MetaTrader 4-Plattform ist ein Chartanalysetool, das die Preisentwicklungen eines Jahres in einem rechteckigen Kasten intuitiv darstellt. Dieser Indikator hebt die jährlichen Eröffnungs- und Schlusskurse hervor, indem er den Preisbereich umrahmt und den Hintergrund einfärbt. Trader können auf einen Blick jährliche Preisfluktuationen erkennen und analysieren, indem sie den Jahreskerzenbox-Indikator nutzen, um Trends und Must

5/10 Kopien zu 30$ ---> nächste 50$ // MT5 Version
Forex Vigor ist ein technischer Indikator, der die Momentumstärke der 8 Hauptwährungen (EUR, GBP, AUD, NZD, USD, CAD, CHF, JPY) bewertet. Der Indikator stützt sich auf mathematische Berechnungen, die den Mangel an Korrelation zwischen 28 Währungspaaren messen. Zur Berechnung der Werte wird die prozentuale Differenz zwischen den Schlusskursen mit der Methode der linear gewichteten Mittelwertbildung (LWMA) und einem statistischen System analysi
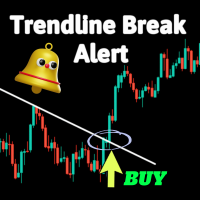
Dies ist ein einfacher Indikator, der eine Warnung bei Durchbrüchen von Trendlinien liefert.
Er kann nützlich sein, wenn Sie es gewohnt sind, Trendlinien in Ihrem Handel zu verwenden. Einstellbare Parameter umfassen:
Kerzenidentifikator: bei welcher Kerze nach einem Durchbruch ein Signal gegeben werden soll Und drei Arten von Warnungen: E-Mail senden Hörbare Warnungen Push-Benachrichtigungen
Sehen Sie sich dieses Video an, um zu erfahren, wie Sie Benachrichtigungsalarme auf Ihrem Telefon
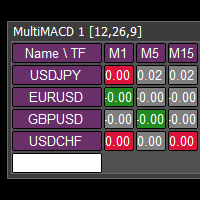
This tool monitors MACD indicators on all time frames in the selected markets. Displays a table with signals to open a BUY trade (green) or SELL trade (red). You can set the conditions for the signal. You can easily add or delete market names / symbols. If the conditions for opening a trade on multiple time frames are met, you can be notified by e-mail or phone message (according to the settings in MT4 menu Tools - Options…) You can also set the conditions for sending notifications. The list of

Nehmen Sie am Handel mit dem WolfeWaveBuilder-Indikator teil! Dies ist ein einzigartiges Tool, das speziell dafür entwickelt wurde, die erfolgreichsten und profitabelsten Investitionsentscheidungen zu treffen. Es ist ideal für Live-Konten und profitiert von einer gründlich getesteten und praktisch garantierten Handelsstrategie. Verpassen Sie nicht Ihre Gelegenheit! Fangen Sie an, mit dem WolfeWaveBuilder-Indikator Geld zu verdienen!
MT5-Version https://www.mql5.com/ru/market/product/82360
I

harmonic patterns Harmonic patterns can be used to spot new trading opportunities and pricing trends – but only if you know exactly what you are looking for. Harmonic patterns are formed by combining geometric shapes and Fibonacci levels. As a result, Fibonacci levels are the key concept of these patterns. Identifying harmonic patterns requires more practice than other market classical patterns. But by learning these patterns, you can recognize the future trend of the price chart. These patter

Waddah Explosion Scanner Features : - Waddah Trend, Explosion Increase/Decrease
- Trend Percentage with Threshold
- DeadZone
- Trend Direction Aligned Checks
- Highlight and Alerts
- Multi-Timeframe & Multi-Currency
Check out the blog post for more info: https://www.mql5.com/en/blogs/post/758020
Customizable Threshold: With customizable threshold, you can identify best trading opportunities in volume-based trading. Use Trend Height (x times Explosion) : Trend height in relat
Dreizeiliger Strike-Indikator für MetaTrader 4 (MT4). Dieses fortschrittliche Tool soll Ihnen dabei helfen, potenzielle Umkehrungen auf dem Markt präzise und einfach zu erkennen.
Egal, ob Sie Anfänger oder erfahrener Händler sind, dieser Indikator kann Ihre Handelsentscheidungen verbessern und Ihre Gewinne maximieren. Contact me after purchase for guidance Hauptmerkmale: Präzise Umkehrsignale : Erkennen Sie potenzielle Trendumkehrungen anhand des Dreilinien-Strike-Musters, einer bewähr

Echter Angebots- und Nachfrageindikator - ermöglicht es Ihnen, die Position von Widerstands- und Unterstützungsniveaus in allen Zeitrahmen schnell zu bestimmen. Der Indikator wird für diejenigen nützlich sein, die technische Analysen in ihrem Handel verwenden. Der Indikator ist einfach zu verwenden, ziehen Sie ihn einfach per Drag-and-Drop auf den Chart und der Indikator zeigt Ihnen die wahrscheinlichsten Unterstützungs- und Widerstandsniveaus. Wenn Sie den Zeitrahmen wechseln, sehen Sie

The technical indicator "Reversal patterns" is a mathematical interpretation of the classic reversal patterns: Pin Bar, Harami and Engulfing. That is, the "reversal bar", "Harami" and "Absorption". This indicator allows you to determine the moment of reversal of quotes based on market dynamics and the winner between the "bulls" and "bears".
The indicator displays the moment of reversal at the local highs and lows of the chart of any timeframe, which allows you to increase the accuracy of the
Intelligentes Handelssystem. Alle Zeitrahmen, Währungen, Kryptowährungen, Metalle … Alle MT4 und alle Bildschirme und Vorlagen werden automatisch konfiguriert. Ein Anfänger handelt einfach auf der Grundlage eines Signals. Die Parameter eines einzigartigen flexiblen Algorithmus sind in den Einstellungen offen, und der prozentuale Erfolg des Traders ist das Ergebnis seiner Einstellungen.
Idee 1: Wenn „Take Profit“ oder „Stop Loss“ ausgelöst werden oder wenn Sie den Handel geschlossen haben, gibt

MA Trend Following Indicator for MT4 is a simple technical analysis tool designed to follow the trend in any currency pair chosen by the trader by combining 3 moving averages on two different time frames, one long term and one short term.
It basically provides a bullish or bearish signal when the moving averages on one time frame align with the moving averages on a different time frame to have a confluence signal.
The indicator is presented as a screener with multiple currency pairs (that

VR Pivot ist ein Indikator für wichtige Drehpunkte (pivot). Umkehrpunkte sind eine spezielle Art von Unterstützung (support) und Widerstandsstufen (resistance), die verwendet werden, um die stärksten Preiszonen zu identifizieren. Professionelle Händler verwenden Umkehrpunkte, um die Preise zu bestimmen, zu denen eine hohe Wahrscheinlichkeit einer Preisumkehr besteht. Die Niveaus werden nach speziellen mathematischen Formeln berechnet, die Preise des Schließens, Öffnens, Maximums, Minimums des vo

Der Reversal Alert Pro- Indikator ist ein leistungsstarkes Tool zur automatischen Erkennung von Umkehrbereichen im Markt. Es bietet praktische Benachrichtigungen, die direkt an Ihr Mobilgerät gesendet werden, und zeigt Popup-Benachrichtigungen mit Ton an. Indem Sie diesen Indikator in Ihre Handelsstrategie integrieren, können Sie Handelspositionen effektiv filtern. Darüber hinaus bietet der Indikator die Möglichkeit, CCI-, RSI- und stochastische Indikatoren zu nutzen, um die generierten Sign
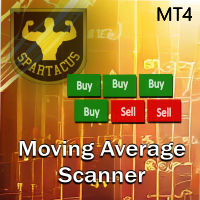
Moving Average Scanner ist ein Multi-Timeframe-Scanner, mit dem Sie den Trend über mehrere Zeitrahmen auf einen Blick sehen können, ohne das Diagramm zu ändern.
Es können bis zu 4 gleitende Durchschnitte Ihrer Wahl über 9 Zeiteinheiten verwendet werden. Es ist vollständig konfigurierbar und kann per Drag & Drop an eine beliebige Stelle im Diagramm verschoben werden.
Gleitende Durchschnitte können in 4 verschiedenen Berechnungsmethoden konfiguriert werden. Sie können auch Benachrichtigungen

Ultimate Trend Finder (Multi Pair And Multi Time Frame) : ---LIMITED TIME OFFER: NEXT 25 CLIENTS ONLY ---46% OFF REGULAR PRICE AND 2 FREE BONUSES ---SEE BELOW FOR FULL DETAILS Institutional traders use moving averages more than any other indicator. As moving averages offer a quick
and clear indication of the institutional order flow. And serve as a critical component in the decision making
within numerous institutional trading rooms.
Viewing the market through the same lens as the i

Ultimate Breakout Scanner (Multi Pair And Multi Time Frame) : ---LIMITED TIME OFFER: NEXT 25 CLIENTS ONLY ---46% OFF REGULAR PRICE AND 2 FREE BONUSES ---SEE BELOW FOR FULL DETAILS Breakout trading is one of the most popular trading approaches used in the institutional trading world.
As it takes advantage of the never ending phenomena of price expansion and contraction (through volatility) .
And this is how institutional traders are able to take advantage of explosive moves in the market .
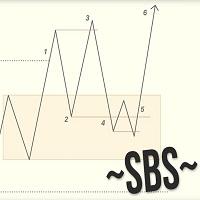
Swing Breakout Sequence | SBS presents a comprehensive trading strategy designed to help traders identify and capitalize on market swings and breakouts. The Swing Breakout Sequence (SBS) strategy is built around a series of well-defined steps to optimize trading decisions and improve profitability. In version 1.3 I added important functions to increase winrate (although it may reduce the number of recognized models). These are: 1. Add pre-condition filter with following option: + Have to BOS + H
Der Smart Volume Tracker ist ein Indikator, der Einblicke in die Marktstimmung bietet, indem er Geld- und Briefvolumendaten in einem speziellen Fenster visuell darstellt. Dieses intuitive Tool hilft Händlern, schnell zu erkennen, wo sich Kauf- und Verkaufsaktivitäten konzentrieren, und ermöglicht es ihnen, fundiertere Handelsentscheidungen zu treffen.
Mit Smart Volume Tracker können Sie leicht abschätzen, ob der Markt zu einem Aufwärts- oder Abwärtstrend tendiert. Es zeigt Cluster von Geld- u

Ultimate Pinbar Scanner (Multi Pair And Multi Time Frame) : ---LIMITED TIME OFFER: NEXT 25 CLIENTS ONLY ---46% OFF REGULAR PRICE AND 2 FREE BONUSES ---SEE BELOW FOR FULL DETAILS A strong pinbar is clear evidence that the institutions are rejecting a particular price level.
And the more well defined the pinbar, the higher the probability that the institutions will
soon be taking prices in the opposite direction.
Pinbar patterns are widely used by institutional traders around the world.

The indicator (Current Strength) is represented in a separate window by Blue and Pink histogram . The parameter NPeriod represents the number of bars on which we calculate the variation of forces, the recommended value is 5. The Blue histogram measures the buyers force , while the Pink histogram measures the sellers force . The change in color signifies the change in strength which leads t he price . Each drop (especially below 52.8) after touching levels 96.3 or 1.236 must be condidered

I recommend you to read the product's blog (manual) from start to end so that it is clear from the beginning what the indicator offers. This multi oscillator, multi time frame and multi symbol indicator identifies when a divergence occurs between price and an oscillator/indicator. It identifies both regular/classical (trend reversal) and hidden (trend continuation) divergences. It has moving average, RSI/Bollinger, ADX, pin bar and engulfing filter options which makes it possible to filter

This multi indicator/oscillator (hereafter indicator), multi time frame and multi symbol indicator identifies when a divergence occurs between price and one, two or three indicators. It identifies both regular/classical (trend reversal) and hidden (trend continuation) divergences. It has RSI and MA trend filter options which makes it possible to filter out only the strongest setups. Combined with your own rules and techniques, this indicator will allow you to create (or enhance) your own powerfu
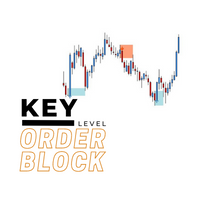
The key level order block indicator automatically draws order-blocks for you on the chart. The indicator compliments any strategy and can also be used as an independent tool. It can work with smart money concepts, harmonic patterns, supply and demand, flag patterns, Quasimodo strategy and many more.
Advantages
The key level order block DOES NOT RE-PAINT, giving you confidence when a signal appears and also helps when looking back. The key level order block includes an on/off button on th

Suggested timeframes to trading :M1-M5 - M15-M30 -H1 wait london and newyork markert open after wait best then select the best strong index and weakest index by sniper. histogram is indicated by one arrow at a time. The signal in the end direction of weak and strong all red and green mean trending index,natural market is displayed only in white SL Sniper Indicator can be used for short term long and scalping. It is better to confirm entry signals with high low price action. currency is gaining

Anzeige der Sonarmechanik. Kontaktieren Sie mich nach dem Kauf, um die SonarHistogram-Leistungsbilanzanzeige kostenlos zu erhalten! Der Sonar Mechanic-Indikator ist ein wirklich funktionierender Indikator, denn er arbeitet mit drei Algorithmen des Autors, die Trend- und Gegentrendsignale für den Markteintritt korrekt identifizieren. Der Indikator funktioniert für alle Vermögenswerte und Zeitrahmen. Indikatoren-Leitfaden: https://www.mql5.com/en/blogs/post/750128 Bei Gold und Währungspaar

TrendSwift Es ist so konzipiert, dass es von jedem genutzt werden kann, selbst der absolute Anfänger im Trading kann es nutzen. NIEMALS neu streichen. Die Angaben erfolgen von Schlusskurs zu Schlusskurs. Konzipiert für den alleinigen Gebrauch, es sind keine weiteren Indikatoren erforderlich.
Wie funktioniert es TrensSwift verwendet einen internen Trendindikator in Kombination mit einem Preisaktions- und Fibonacci-System. Die Strategie wird strikt angewendet, ohne Nachberechnungen, Glättung
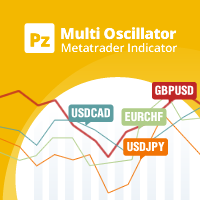
Der Multi-Oscillator ist das ultimative Schweizer Taschenmesser für den Handel mit mehreren Währungen und Zeiträumen. Es zeichnet Ihren gewünschten Oszillator für viele Währungspaare und / oder Zeiträume in einem einzigen Diagramm auf. Es kann zum Handel mit statistischer Arbitrage, als Marktscreening-Tool oder als verfeinerter Multi-Timeframe-Indikator verwendet werden. [ Installationsanleitung | Update-Anleitung | Fehlerbehebung | FAQ | Alle Produkte ] Einfache Interpretation und Konfiguratio
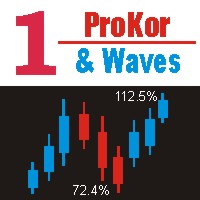
MT4. Показывает процент коррекции цены к предыдущей волне, процент превышения цены над предыдущим пиком или впадиной волны. Помечает волны. Диапазон волн регулируется параметром на графике, путём ввода в поле цифры от 5 до 300. Рисует уровни Фибоначчи от вершин или впадин предыдущей волны, а так же в противоположную сторону от текущей вершины или впадины волны.

Super Trend Filter Indicator Super trend Arrow Consider as a Master Candle , If super trend in Buy signal , then signal candle calculate as master candle and master candle close above the open candle then calculate filter Buy Arrow. If super trend in Sell signal , then signal candle calculate master candle and master candle close below the open candle calculate filter Sell Arrow. 3 Target with Trailing Stop Loss
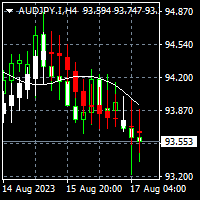
To download MT5 version please click here . - This is the exact conversion from TradingView: "Linear Regression Candles" By "ugurvu". - This is a non-repaint and light processing load indicator - You can message in private chat for further changes you need. This is a sample EA code that operates based on bullish and bearish linear regression candles . #property strict input string EA_Setting= "" ; input int magic_number= 1234 ; input string Risk_Management= "" ; input double fixed_lot_size=
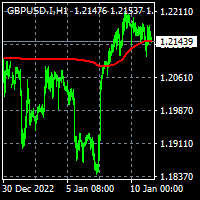
To get access to MT5 version please click here . - This is the exact conversion from TradingView: "Trend Regularity Adaptive Moving Average","TRAMA" By " LuxAlgo ". - This is a light-load processing and non-repaint indicator. - Buffer is available for the main line on chart. - You can message in private chat for further changes you need. Thanks for downloading

To get access to MT5 version please click here . - This is the exact conversion from TradingView: "Stochastic Momentum Index" By "UCSgears". - This is a popular version of stochastic oscillator on tradingview. - This is a light-load processing and non-repaint indicator. - Buffers are available for the lines on chart. - You can message in private chat for further changes you need. Thanks for downloading
Pinbar Pattern Scanner: Your Ultimate Forex Trading Tool The Pinbar Pattern Scanner is a cutting-edge, non-repainting, non-lagging price action tool designed for both novice and expert traders. With its unique ability to scan across 9 timeframes, this tool alerts you of potential price rejections in any forex symbol, all from a single chart.
Key Features:
Versatility: Originally developed for forex, it's also suitable for binary options for those well-versed in price action.
Customizable:

This Real Magic Trend indicator is designed for signal trading. This indicator generates trend signals.
It uses many algorithms and indicators to generate this signal. It tries to generate signals from the points with the highest trend potential.
This indicator is a complete trading product. This indicator does not need any additional indicators.
The indicator is never repainted. The point at which the signal is given does not change.
Features and Recommendations Time Frame
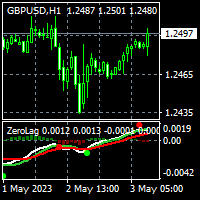
To get access to MT5 version please click here . This is the exact conversion from TradingView: "Zero Lag MACD Enhanced - Version 1.2" by " Albert.Callisto ". This is a light-load processing and non-repaint indicator. All input options are available. Buffers are available for processing in EAs. You can message in private chat for further changes you need. Thanks

To get access to MT5 version please click here . This is the exact conversion from TradingView: "[SHK] Schaff Trend Cycle (STC)" by "shayankm". This is a light-load processing indicator. This is a non-repaint indicator. Buffers are available for processing in EAs. All input fields are available. You can message in private chat for further changes you need. Thanks for downloading
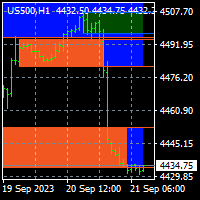
To get access to MT5 version please create personal order. This is the exact conversion from TradingView: Order Blocks & Breaker Blocks [LuxAlgo] This is a light-load processing and repaint indicator. All input options are available. This is not a multi time frame indicator. Buffers are available for processing in EAs. You can message in private chat for further changes you need.
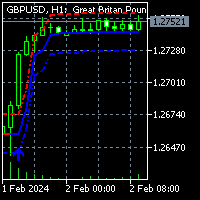
To get access to MT5 version please click here . This is the exact conversion from TradingView: "HalfTrend" by "Everget". This is a light-load processing indicator. This is a non-repaint indicator. Buffers are available for processing in EAs. All input fields are available. You can message in private chat for further changes you need. Thanks for downloading

The True Magic Oscillator indicator is designed for signal trading. This indicator generates trend signals.
It uses many algorithms and indicators to generate this signal. It tries to generate signals from the points with the highest trend potential.
This indicator is a complete trading product. This indicator does not need any additional indicators.
The indicator is never repainted. The point at which the signal is given does not change.
Features and Recommendations Wor
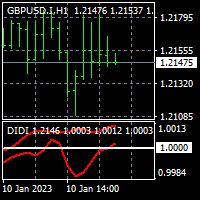
To get access to MT5 version please click here . - This is the exact conversion from TradingView: "Didi Index" by " everget ". - This is a popular version of DIDI index on tradingview. - This is a light-load processing and non-repaint indicator. - Buffer is available for the lines on chart and arrows on chart. - You can message in private chat for further changes you need. Thanks for downloading
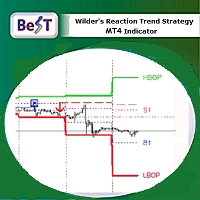
Best _Wilder’s Trend Reaction Strateg y is a Metatrader indicator that is based on the J.W.Wilder’s corresponding work as we can find it at his own legendary book:
“ NEW CONCEPTS IN TECHNICAL TRADING SYSTEMS ”(1978) and on pages 71-86/SECTION VII.
This strategy is both an anti-trend system (named as REACTION_MODE ) and a trend system (named as TREND_MODE ). The REACTION_MODE reverses at each Buy point and most Sell points while the TREND_MODE usually exits the market at a Trailing Stop.
T

Graphing calculator for quick calculation of order grids or averaging strategies. This is an improved English version of the "Grid calculator" program, which shows order volumes by level (lot), martingale ratio (MG), grid step (step), drawdown of each order and the entire grid, breakeven level (Line Breakeven). For the program to perform calculations, it is enough to pull the grid onto the chart by dragging the initial (Level 1) or control (Control line) levels with the mouse. The default param

True Order Blocks is an excellent indicator for day traders, swing traders, and even scalpers. It is combined with multiple market-moving strategies. It identifies market structure, marks supply and demand zones, displays imbalance moves, structure break, trendline breakout, and much more. True order blocks are compatible with forex, stocks, cryptocurrency, and any market with any timeframe. NOTICE:- CONTACT ME TO GET FREE ACCESS OF ADVANCED TREND
And I'll show you how to use this tool in yo

SF TREND SIGNAL - уникальный индикатор использующий несколько входных данных для определения тенденции, и сигнала для входа в сделку, в ее направлении. Подходит для любой валютной пары, любого таймфрейма, и не меняет свои показания. Индикатор очень прост в настройке, что является хорошим преимуществом для исследований.
Параметры индикатора Основные настройки ( Main Settings ): SlowPeriod - период для расчета тенденции. FastPeriod - период для расчета сигнала. SlowSmooth - сглаживание значен
NO REPAINT ADVANCED CHART PATTERN INDICATOR
By definition, a price ( chart) pattern is a recognizable configuration of price movement that is identified using a series of trendlines and/or curves. When a price pattern signals a change in trend direction, it is known as a reversal pattern; a continuation pattern occurs when the trend continues in its existing direction following a brief pause. Advanced Chart Pattern Tracker is designed to find the MOST ACCURATE patterns. A special script is
Панель предназначена для быстрого визуального нахождения и отображения ложных пробоев по всем периодам и на любых выбранных валютных парах одновременно . Цвет сигнальных кнопок , указывает на направление возможного движения . По клику на сигнальную кнопку , осуществляется открытие графика с данным паттерном . Отключить не используемые периоды , можно кликом по его заголовку . Кнопка "All" открывает графики всех сигналов по данному периоду . Имеется поиск в истории ( по предыдущим барам ). Прокру
MetaTrader Market - Handelsroboter und technische Indikatoren stehen Ihnen direkt im Kundenterminal zur Verfügung.
Das MQL5.community Zahlungssystem wurde für die Services der MetaTrader Plattform entwickelt und steht allen registrierten Nutzern der MQL5.com Webseite zur Verfügung. Man kann Geldmittel durch WebMoney, PayPal und Bankkarten einzahlen und sich auszahlen lassen.
Sie verpassen Handelsmöglichkeiten:
- Freie Handelsapplikationen
- Über 8.000 Signale zum Kopieren
- Wirtschaftsnachrichten für die Lage an den Finanzmärkte
Registrierung
Einloggen
Wenn Sie kein Benutzerkonto haben, registrieren Sie sich
Erlauben Sie die Verwendung von Cookies, um sich auf der Website MQL5.com anzumelden.
Bitte aktivieren Sie die notwendige Einstellung in Ihrem Browser, da Sie sich sonst nicht einloggen können.