 MetaTrader 5
 Expert Advisors
 Indikatoren
 Skripte
 Bibliotheken
 Speicher
und werden Sie Mitglied unserer Fangruppe
Veröffentliche einen Link auf das Skript, damit die anderen ihn auch nutzen können
Bewerten Sie es im Terminal MetaTrader 5

ATR Monitor — Daily, Weekly and Monthly Range - Indikator für den MetaTrader 4

- Ansichten:
- 194
- Rating:
- Veröffentlicht:
-
 Sie verpassen Handelsmöglichkeiten:
- Freie Handelsapplikationen
- Über 8.000 Signale zum Kopieren
- Wirtschaftsnachrichten für die Lage an den Finanzmärkte
Registrierung EinloggenSie stimmen der Website-Richtlinie und den Nutzungsbedingungen zu.
Wenn Sie kein Benutzerkonto haben, registrieren Sie sich -
 Benötigen Sie einen Roboter oder Indikator, der auf diesem Code basiert? Bestellen Sie ihn im Freelance-Bereich
Zum Freelance
Benötigen Sie einen Roboter oder Indikator, der auf diesem Code basiert? Bestellen Sie ihn im Freelance-Bereich
Zum Freelance
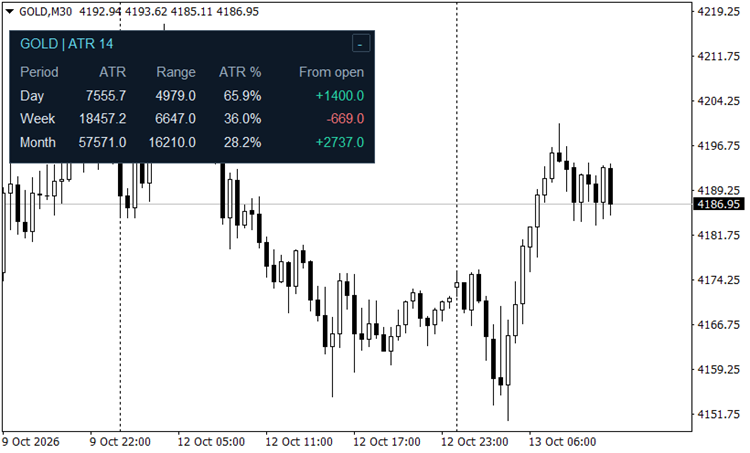
ATR Monitor compares the current daily, weekly and monthly price ranges with Average True Range (ATR). It shows how large each period's range is relative to its ATR and whether the current price is above or below the period's opening price.
The panel displays three rows: Day, Week and Month. All three timeframes are available on the current chart, regardless of its timeframe.
Reading the table
| Column | Meaning |
|---|---|
| Period | Daily, weekly or monthly candle. |
| ATR | Built-in ATR for that timeframe, expressed in pips. |
| Range | Current period's high minus low, expressed in pips. |
| ATR % | Current range divided by ATR, multiplied by 100. |
| From open | Current price minus the period's opening price, expressed in pips. |
For example, a daily range of 66 pips against a daily ATR of 60 pips gives an ATR % reading of 110%. A weekly range of 144 pips against an ATR of 240 pips gives 60%, and a monthly range of 160 pips against an ATR of 400 pips gives 40%.
ATR % uses the full high–low range. From open is a separate direction measurement: positive values are green and negative values are red. A value rounded to zero is neutral.
Readings at or above MaxATRPercent are highlighted in amber. The default threshold is 100%. Changing this setting affects highlighting only; the displayed percentage is never capped.
Inputs
| Input | Default | Purpose |
|---|---|---|
| ATRPeriod | 14 | ATR lookback applied independently to daily, weekly and monthly data. |
| MaxATRPercent | 100.0 | Percentage at which amber highlighting starts. |
| PanelX | 7 | Horizontal position from the chart's upper-left corner, in pixels. |
| PanelY | 30 | Vertical position from the chart's upper-left corner, in pixels. |
| PanelXSize | 400 | Expanded panel width before scaling. |
| PanelYSize | 146 | Expanded panel height before scaling. |
| PanelScale | 1.0 | Panel and font scale, from 0.5 to 3.0. Position offsets are unchanged. |
| Colors | Dark theme | Background, border, text, direction and threshold colors. |
Click minus to minimize the panel and plus to restore it. Hover the title or column headings for explanations of the values and their units.
Calculation and updates
Prices and ATR use the current forming candle, shift 0, on each timeframe. The indicator attempts to load values when attached and refreshes on incoming ticks. ATR therefore changes as the current candle develops; it is not a fixed reference from the previous completed candle.
Period boundaries follow the broker's candles. Range measures high minus low, while ATR uses true range and includes gaps relative to the previous close. A range above 100% ATR does not by itself imply that price will reverse.
Pip conversion uses ten points per pip for three- and five-digit quotes and one point otherwise. Values display one decimal place. Other instruments may use different pip conventions.
Unavailable data is shown as -- and retried on later ticks. A zero ATR shows N/A for ATR %. Without incoming ticks, there is no automatic retry after history finishes loading. Restoring the panel also refreshes available values. Values are not refreshed while the panel is minimized.
Installation
Place AtrMonitor.mq4 in the terminal data folder under MQL4/Indicators, compile it in MetaEditor, refresh Navigator, and attach the indicator to a chart. No external libraries or DLLs are required.
 FXR_TripleHybridSR
Good Trading System
ATR Sylvain Vervoort Trading System
Excellent Trend-Following system based on ATR.
Best Slope TS
Combination optimum of sloping native MT4 indicators.
Barometer Optimum
Show Align Mean optimum all chart profit.