und werden Sie Mitglied unserer Fangruppe
Veröffentliche einen Link auf das Skript, damit die anderen ihn auch nutzen können
Bewerten Sie es im Terminal MetaTrader 5
- Ansichten:
- 18297
- Rating:
- Veröffentlicht:
- Aktualisiert:
-
Benötigen Sie einen Roboter oder Indikator, der auf diesem Code basiert? Bestellen Sie ihn im Freelance-Bereich Zum Freelance
This Indicator is based on the True Range which is the maximum of (High - Low), Abs(High - Close[1]) and Abs(Low - Close[1]), with Abs being mathematical absolute.
In order to get the first data, it calculates the true range value for a number of bars (which is the input Length) and then calculates the SMA of these values (which is the sum of all these values by the Length - a simple average). This average is set as the first ATR value.
Smoothing methods:
RMA: a coefficient alpha is defined as : alpha = 1/Length. The calculation of RMA is: rma = alpha * (true range value of this candle) + (1-alpha) * (last rma).
SMA: for each bar it calculates the simple average of the true range value for the defined number of bars (Length). This mode is equal to the iATR value.
EMA: a coefficient alpha is defined as : alpha = 2/(1+Length). The calculation of EMA is: ema = alpha * (true range value of this candle) + (1-alpha) * (last ema).
WMA: for each bar it calculates the weighted average of the true range value for the defined number of bars (Length) like this:
sum = N * (tr[0]) + (N-1) * (tr[1]) + ... + 1 * (tr[N-1]); tr is true range value of the candle
wma = sum / (N*(N+1)/2)
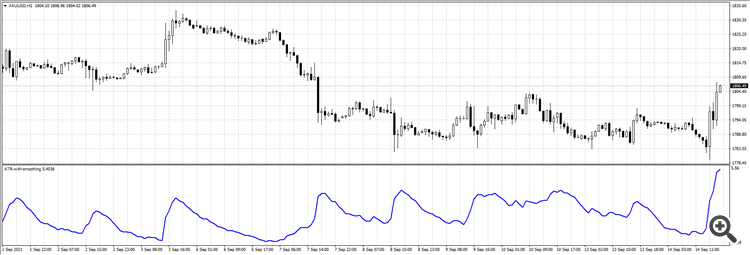
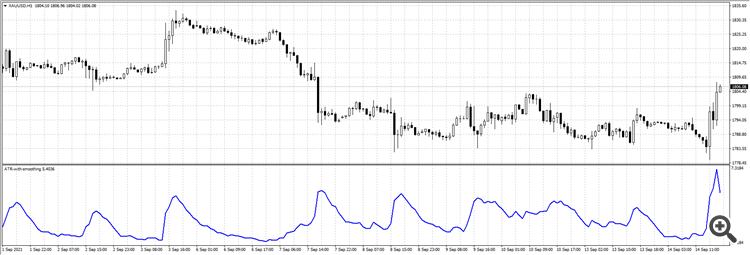
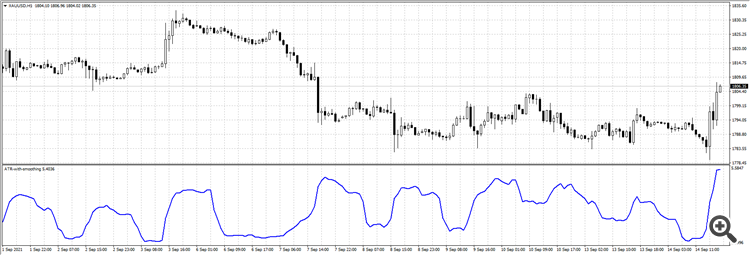
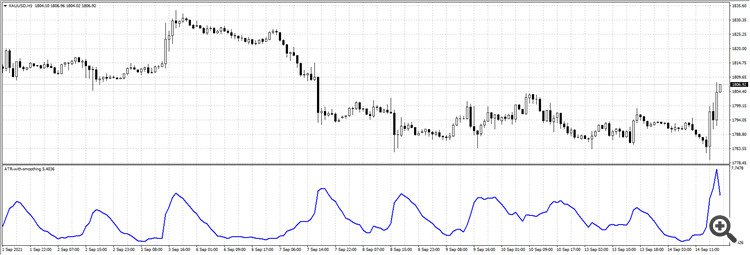
Example: XAUUSD, H1
- RMA
- EMA
- SMA
- WMA
 Timeframe Flow
Sharing this trend indicator made by me. Called "Timeframe Flow". It will draw a user defined higher time-frame candle on every shift on your current time-frame. Meaning you can have H4, H12 or D1 candles on every shift of your H1 Charts. Or you can have D2, D3 or D5 candles on every shift of your Daily Charts. Combined with the current time-frame ATR Bands, you have a trend indicator with some filter. You may also use the Mid Line crosses as exit( Calculated using Higher timeframe candles displayed in the indicator(Close + Open)/2 ).
 Tops and bottoms in trend
with rsi .
 Trailing stop MT4
Use trailing stop point with MT4
 G channel
G channel is a channel indicator with 3 lines- a middle line representing a central tendency and 2 Upper and Lower boundaries calculated based on the past values of same indicator. Its based on the paper "Recursive Bands - A New Indicator For Technical Analysis" by Alex Grover and is a code conversion from TradingView. The channel breakout of Upper or Lower boundaries represent a new trend or trend continuation while narrowing of bands represents ranging or low volatility conditions. The channel can prove to be a good indicator of a trend direction and also a guide for trailing of stop loss. It has only 2 variables. Channel period - default set to 100. Price type.


