und werden Sie Mitglied unserer Fangruppe
Veröffentliche einen Link auf das Skript, damit die anderen ihn auch nutzen können
Bewerten Sie es im Terminal MetaTrader 5
- Ansichten:
- 65365
- Rating:
- Veröffentlicht:
- Aktualisiert:
-
 Sie verpassen Handelsmöglichkeiten:
- Freie Handelsapplikationen
- Über 8.000 Signale zum Kopieren
- Wirtschaftsnachrichten für die Lage an den Finanzmärkte
Registrierung EinloggenSie stimmen der Website-Richtlinie und den Nutzungsbedingungen zu.
Wenn Sie kein Benutzerkonto haben, registrieren Sie sich -
 Benötigen Sie einen Roboter oder Indikator, der auf diesem Code basiert? Bestellen Sie ihn im Freelance-Bereich
Zum Freelance
Benötigen Sie einen Roboter oder Indikator, der auf diesem Code basiert? Bestellen Sie ihn im Freelance-Bereich
Zum Freelance
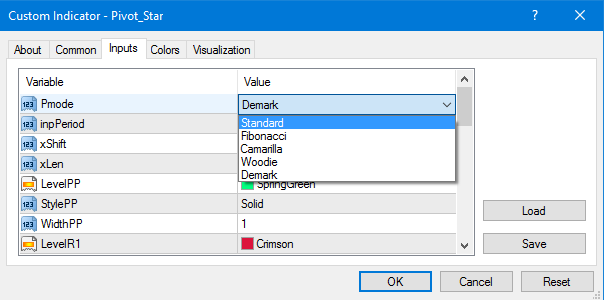
This indicator draws current pivot points, it does not plot history. Clean and simple.
Choice of Standard, Fibonacci, Camarilla, Woody's and Demark pivot calculations.
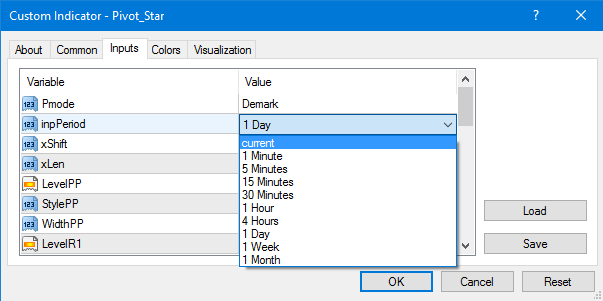
Calculation is based on previous bar of chosen period.
double xClose= iClose(0,inpPeriod,1);
double xHigh = iHigh(0,inpPeriod,1);
double xLow= iLow(0,inpPeriod,1);
Default setting is H1, for scalping.
input int xLen = 25; // Line Length
- xShift positions pivot lines relative to the first bar (positive number shifts to the right).
- xLen sets length of lines (by number of bars, in theory).
Two additional lines are drawn — Previous day's High and Low.
Every and each line can be set up to your liking: Color, Style, Thickness (set color to None to disable line).

Thicker lines are previous day's High/Low. Drawn only on lower than D1 time frames.

Camarilla Pivot includes L3, L4, L5, H3, H4, H5 lines. Other points are omitted as they're not really needed.
If viewing time frame is larger than indicator's set period, the lines are not drawn, otherwise they only obstruct.
if(inpPeriod>=Period())
{
if(Period()<=1440)
{
DrawLevel("Yesterdays High",xYH,StyleYH,WidthYH,LevelYH);
DrawLevel("Yesterdays Low",xYL,StyleYL,WidthYL,LevelYL);
}
DrawLevel("R3",xR3,StyleR3,WidthR3,LevelR3);
DrawLevel("R2",xR2,StyleR2,WidthR2,LevelR2);
DrawLevel("R1",xR1,StyleR1,WidthR1,LevelR1);
DrawLevel("PP",xPP,StylePP,WidthPP,LevelPP);
DrawLevel("S1",xS1,StyleS1,WidthS1,LevelS1);
DrawLevel("S2",xS2,StyleS2,WidthS2,LevelS2);
DrawLevel("S3",xS3,StyleS3,WidthS3,LevelS3);
}
Updated 05 Jun 2017.
Few changes, showing Previous Day's High/Low is optional; code changed so that it is now possible to use couple of instances for different time-frames (e.g. one for daily pivots, one for weekly, etc.).
 Automatic Fixed Scale with Top/Bottom Margins
This code was written as an indicator. It adds top and bottom margin to the chart. Both can be adjusted separately.
 Notify
This library has smart notification(alert, push and alert) function with an option of having a single notification per candle at a time.
 Example of MACD Automated
Code example of MACD automated with advanced money management function.
Yen Trader
Expert Advisor to trade Yen Crosses based on Major Pairs and USDJPY divergence/convergence.