und werden Sie Mitglied unserer Fangruppe
Veröffentliche einen Link auf das Skript, damit die anderen ihn auch nutzen können
Bewerten Sie es im Terminal MetaTrader 5
- Ansichten:
- 61034
- Rating:
- Veröffentlicht:
- Aktualisiert:
-
 Sie verpassen Handelsmöglichkeiten:
- Freie Handelsapplikationen
- Über 8.000 Signale zum Kopieren
- Wirtschaftsnachrichten für die Lage an den Finanzmärkte
Registrierung EinloggenSie stimmen der Website-Richtlinie und den Nutzungsbedingungen zu.
Wenn Sie kein Benutzerkonto haben, registrieren Sie sich -
 Benötigen Sie einen Roboter oder Indikator, der auf diesem Code basiert? Bestellen Sie ihn im Freelance-Bereich
Zum Freelance
Benötigen Sie einen Roboter oder Indikator, der auf diesem Code basiert? Bestellen Sie ihn im Freelance-Bereich
Zum Freelance
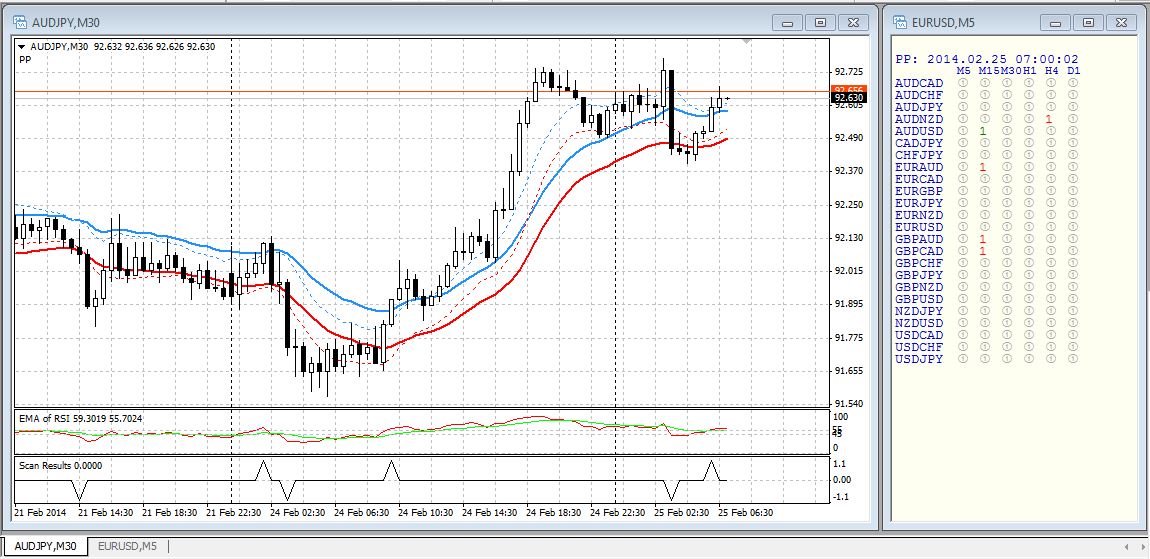
Condition Scanner (cs)
To install:
To demonstrate what the scanner can do:
The code common to all scans:
The code specific to the PP (Power Pro) strategy:
The code specific to the MAX (moving average crossover) strategy:
The code whose ids begin with csXXXX:
How I go about coding for a new condition:
I decide on a strategy identifier (eg PB for pinbars).
I set my window up as above under "To demonstrate what the scanner can do", removing any existing indicators.
If my new scan relies on on-chart indicators, I build them using csXXXX_0.mq4 as a pattern. I remember to 'save as...' csPB_0.mq4. I apply my custom indicator to the left hand chart.
If I need a separate window indicator, I build it too. I remember to 'save as...' csPB_1.mq4. I apply it to the left hand chart.
I build custom indicators rather than using standard indicators so that I can refer to them elsewhere using the iCustom function. This way, if I change my mind about the basic parameters of my strategy (eg moving average method) I only have to change my custom indicators. If I used standard indicators, I would have to change them and then go digging into the bowels of my code to accommodate my mind change.
I grab csXXXX_Chart.mq4, replace all instances of 'XXXX' by my strategy identifier 'PB', and save the code as csPB_Chart.mq4. It wont compile yet because there is some "include" code still to be written.
Now to provide the "include" code.
If the conditions for which I want to test are dead easy, I just use the "include" file csXXXX_GetBarFlag.mqh, code up what I want, and 'save as...' csPB_GetBarFlag.mqh. But if the coding is tricky, I go back to the csPB_Chart.mq4 that I previously created, I comment out the line of code that now reads "#include <csPB_GetBarFlag.mqh>, and I build the code I want directly within the csPB_Chart.mq4 file. When I've got it clean, I move/paste the condition-finding code to the "include" file 'csPB_GetBarFlag.mqh' and un-comment the #include statement in the 'csPB_Chart.mq4 file.
Now the 'csPB_Chart.mq4' file can be compiled and applied to the left hand chart.
At this point, I save the template for the left hand chart as csPB-CHART.tpl. It incorporates any on-chart custom indicators, separate-window custom indicators, and the plot of results as they apply to the current chart
I load the file 'csXXXX_Panel.mq4', replace all instances of "XXXX" by "PB", then 'save as...' "csPB_Panel.mq4". This last file is compiled and applied to the right hand chart. It can be a bit slow to run when first applied but doesn't use much resource when running.
I store csPB_panel.tpl as a template for the right hand chart.
I will then usually store csPB as a profile.
NOTE: When building custom indicators and then referring to them with the iCustom function, I take care that the names are exactly right. You get no warning if iCustom refers to an indicator that doesn't exist.
NOTE: There may be a bug such that when the panel indicator is first loaded, it produces results which are not consistent with those on the specific chart on display. I find that if I change the timescale on the panel window (thus forcing a re-calc), everything comes out right. I would be grateful if anyone can steer me right with this problem.
NOTE: In the ...GetBarFlag.mqh code which you develop yourself, you can return any integer to the calling program to be displayed. As the code stands, zero means 'no result' and causes display of a gray wingding indicating which bar was tested. Returning a negative integer will result in a red display while a positive integer will result in a green display.
Some aspects of the software:
The code was written as indicators so that, when a panel is on display and you want to look at a particular pair and timeframe, you just pick the pair from the Market Watch window, drag and drop it onto the current chart space and change the timeframe to suit. The template looks after the rest.
In an effort to reduce computer overload, I did two things.
Firstly, when dealing with time-series arrays, I mostly only go back 200 bars.
Secondly, the panel display software doesn't test the user's conditions at every tick. It uses a timer mechanism such that testing is applied to bar[0] only if bar[0] is 90% formed, otherwise testing is applied to bar[1]. If bar[1] has the focus (i.e. bar[0] is less than 90% formed), it is tested once and a changeover to bar[0] time is calculated. For every subsequent tick that comes along until the changeover time is reached, nothing happens. I am not 100% sure that I have got this coded up right yet but it seems to work pretty good.
 Universal EA
This is my first Expert Advisor so please give feedback on how I can improve it to make the best possible EA. Thanks for the inputs in advance and happy trading.
 JSON Parser
This is a Class for the new MQL4 that parses JSON. It requires the Hash.mqh class.
 FiboRetracementLevels.mq4
Fibonacci Retracement Levels indicator draws Fibonacci Retracement Levels on the trading chart.
EA SmartAssTrade
This EA just using a very simple formula, but according to my experience, the formula was accurate enough to make a profit.