
How to read absorption at a key level, a breakout that is really accepted and a breakout that fails, with the footprint and the setup assistant of DRX OrderFlux 1.35 in MetaTrader 5. Including an honest look at what a setup does not tell you.
Most traders look at a candle and guess why it moved. A footprint chart removes the guessing: you see the traded volume at every price, split into aggressive buyers and aggressive sellers. Order flow becomes useful when several of these facts happen at a level that matters. Below are three patterns that show up again and again, how each looks on the chart, and what the setup assistant of OrderFlux marks for you. At the end there is the part most posts leave out: what these setups cannot do.
The setup assistant shows facts that line up on closed bars. It does not predict, it is not a signal service and it never says buy or sell. Every setup lists the checks that were met and the price where the idea is wrong. You decide.
The building blocks, in one minute
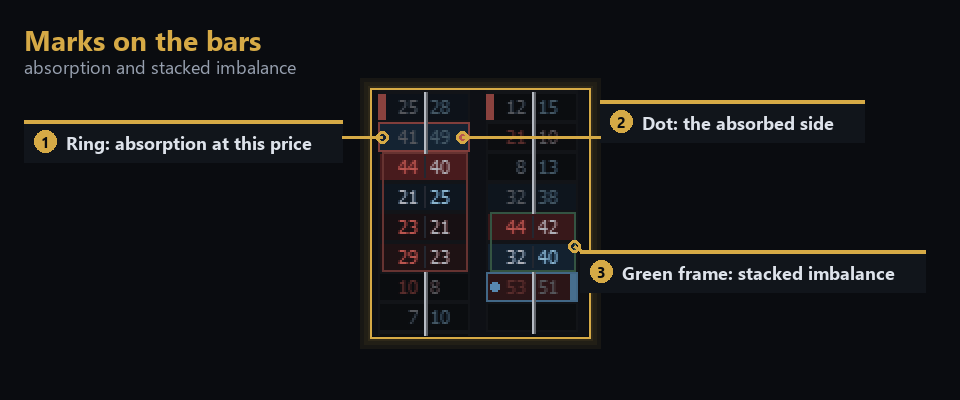
Every row of a footprint bar is one price. Left is volume sold at the bid, right is volume bought at the ask. Delta is buyers minus sellers. An imbalance means one side dominates a price by a wide margin; three or more in a row are a stacked imbalance. A level is a support or resistance zone that the indicator draws from higher timeframes. The setups below are combinations of these pieces.
Setup 1 — Absorption at a key level
Absorption happens when one side trades aggressively into a level, heavy selling or heavy buying, but price barely moves. A passive player is soaking up the aggression with large limit orders. When the aggressive side gives up, price often turns the other way.
OrderFlux marks this when, at a support or resistance level, the volume at the extreme prices of the bar is clearly larger than usual (more than twice the average on the aggressive side), the whole bar is busy, the bar closes away from the extreme and the delta turns. On the chart you see a ring and a dot on the cell and a zone with the label Sellers absorbed or Buyers absorbed.
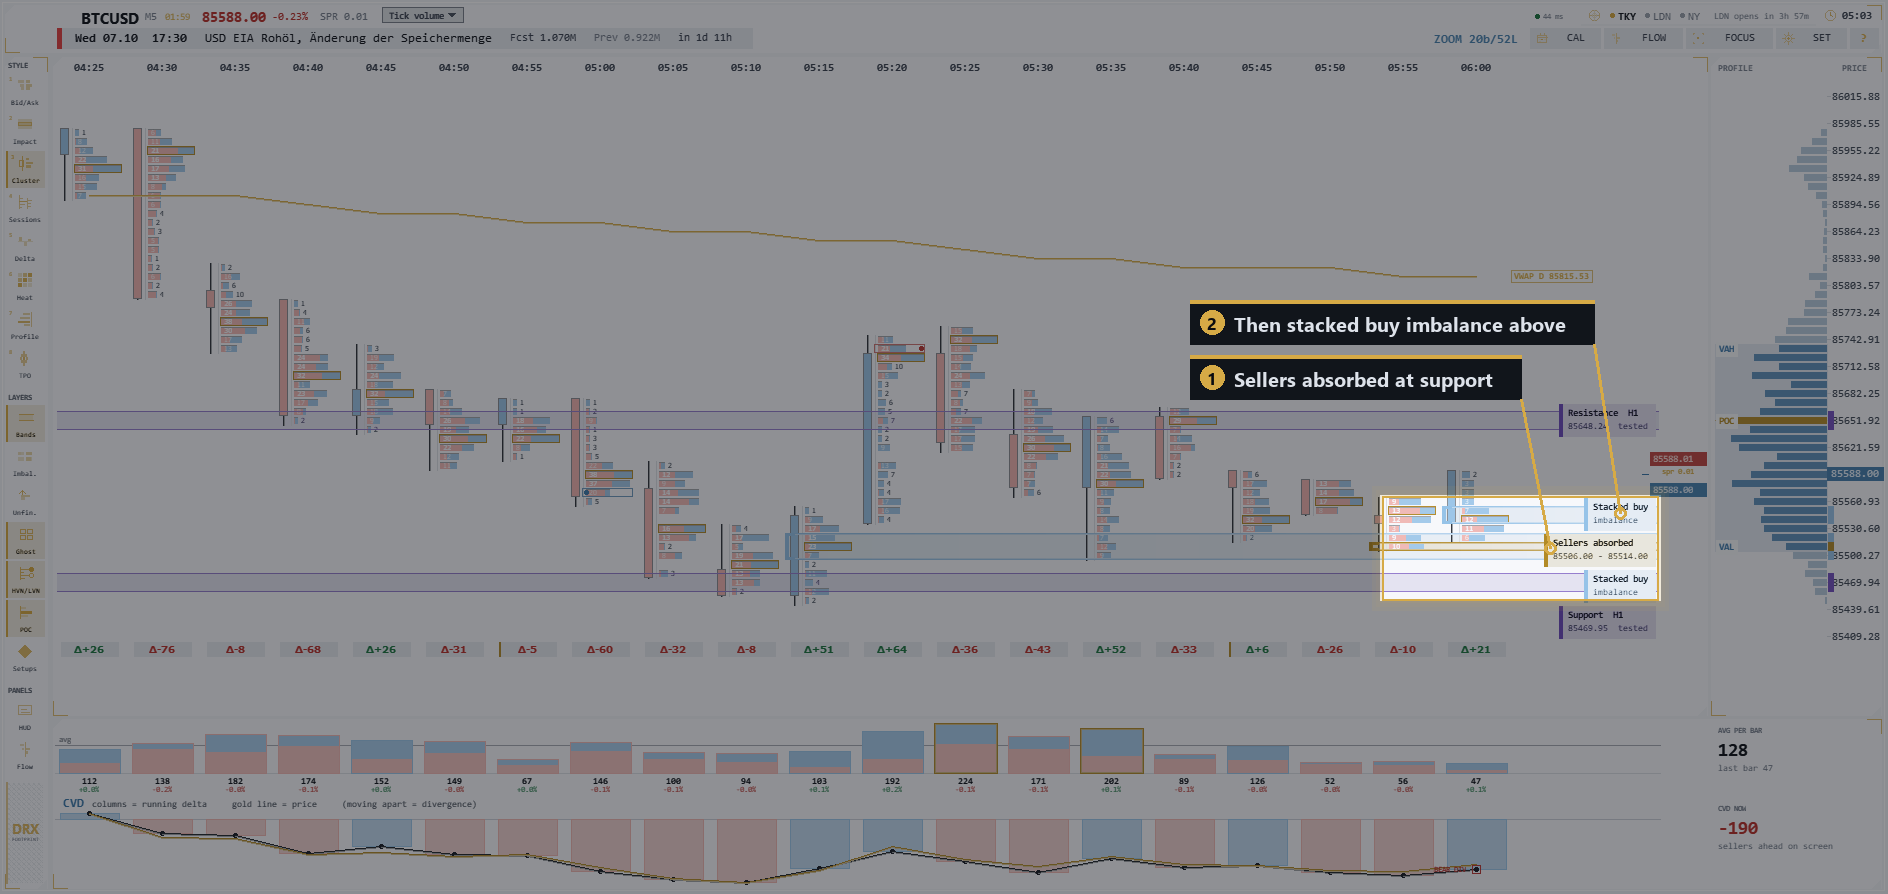
BTCUSD, M5 — sellers hit the support and are absorbed ("Sellers absorbed"); above it a stacked buy imbalance appears.
What happened here: sellers pushed into the level again and again, but the numbers show that buyers took everything at the same prices. The close stayed in the upper half of the bar and the delta of the next bar turned. That combination is the tell. Nothing guarantees a move from here, but the level has just proven that it matters.
Setup 2 — Breakout with acceptance (and a stacked imbalance as the wall)
A single imbalance is noise. Three or more in a row in the same direction are not: that is a wall of aggression, and it often becomes the next support or resistance. A breakout is more believable when price is accepted beyond the level instead of just touching it.
The assistant marks a breakout with acceptance when two bars close beyond the level, a stacked imbalance of at least three rows points in the breakout direction, the delta agrees on both bars and the volume is at least average. The zone of the stacked imbalance is drawn as a band, so you can see where buyers or sellers stepped in.
In the picture above, the stacked buy imbalance on the right is exactly this. Notice that it is a sequence, not one big candle. That is what separates a stacked imbalance from a one-off spike: the other side does not come back to contest it.
Setup 3 — The failed breakout
Sometimes price pokes through a level and falls straight back. If the delta does not follow the move and there is little business beyond the level, the breakout was not supported. The people who bought the break are now trapped on the wrong side. The assistant calls this a failed breakout and marks it when a bar pokes through the level, closes back inside, the delta does not follow the break and there is little volume beyond the level.
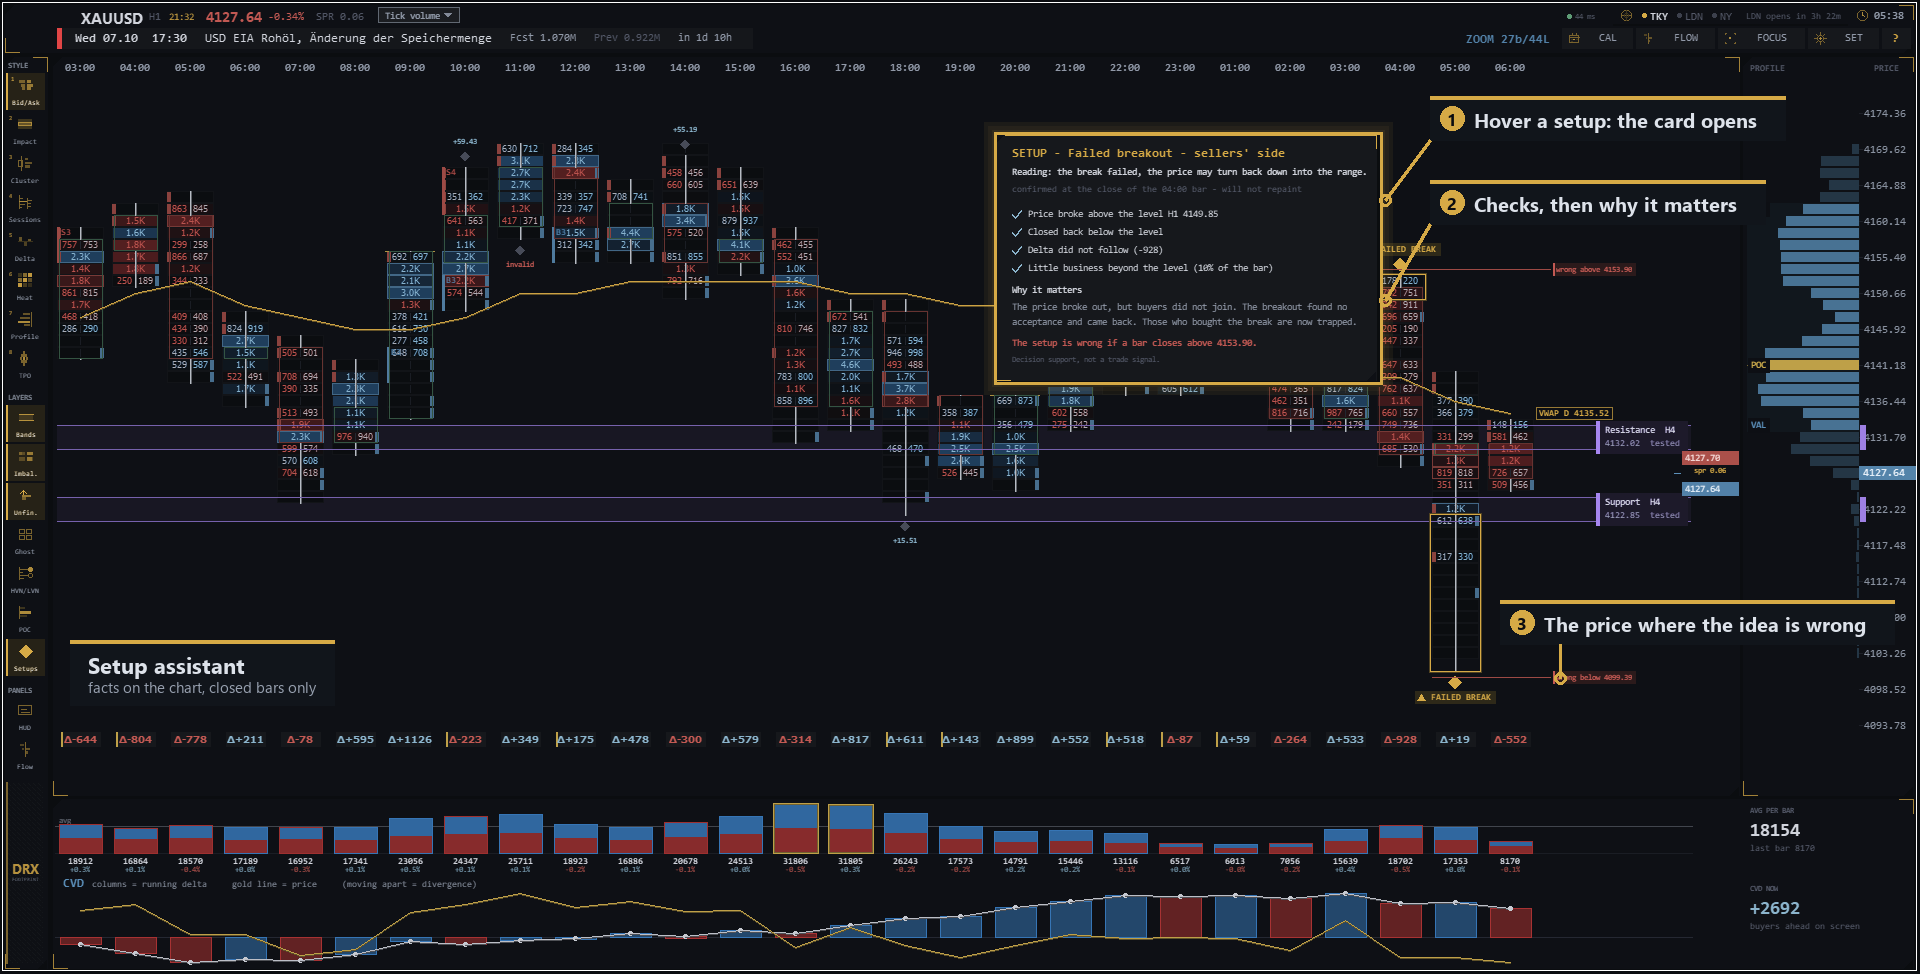
XAUUSD, H1 — the break above the level failed. The card lists what was checked and where the idea is wrong.
Open the explanation card by pointing at the diamond. You see the checks with a tick, a short "Why it matters" in plain words and the price at which the idea is wrong. If a bar closes beyond that price, the setup is marked invalid. A setup without a clear "wrong if" is just an opinion.
Reading divergence by eye: price and cumulative delta
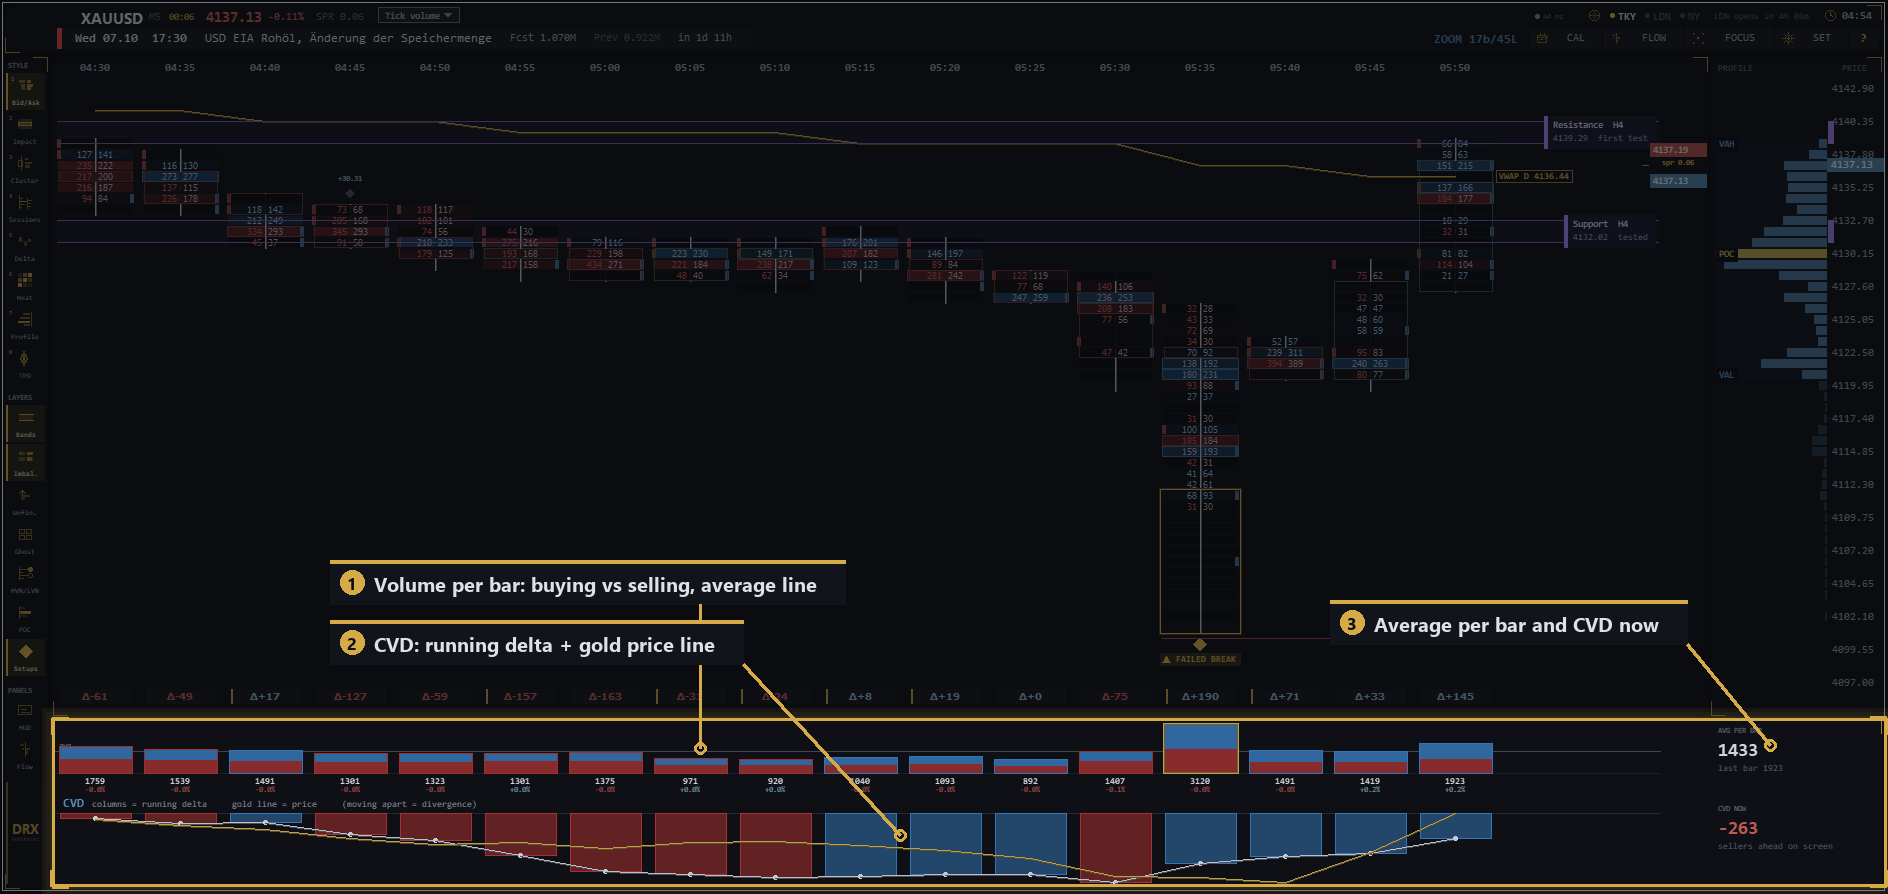
Price and cumulative delta (CVD) usually move together. When price makes a new high but the CVD line rolls over, the aggression that should drive the move is fading. OrderFlux draws the CVD in the strip below the chart (gold line = price, columns = running delta) so you can see the divergence at a glance. The setup assistant does not mark divergences by itself; treat it as context for the three setups above, not as a fourth signal.
The honest part: setups end, and many end badly
Most order-flow content only shows the setups that worked. A setup is active for six bars. After that it moves to the history with its outcome: how far price moved in its direction, or invalid if the "wrong" price was hit. The FLOW tab keeps the newest six, including the ones that failed. That list is the most useful teacher in the tool, because it shows how often a clean-looking pattern simply does not work.
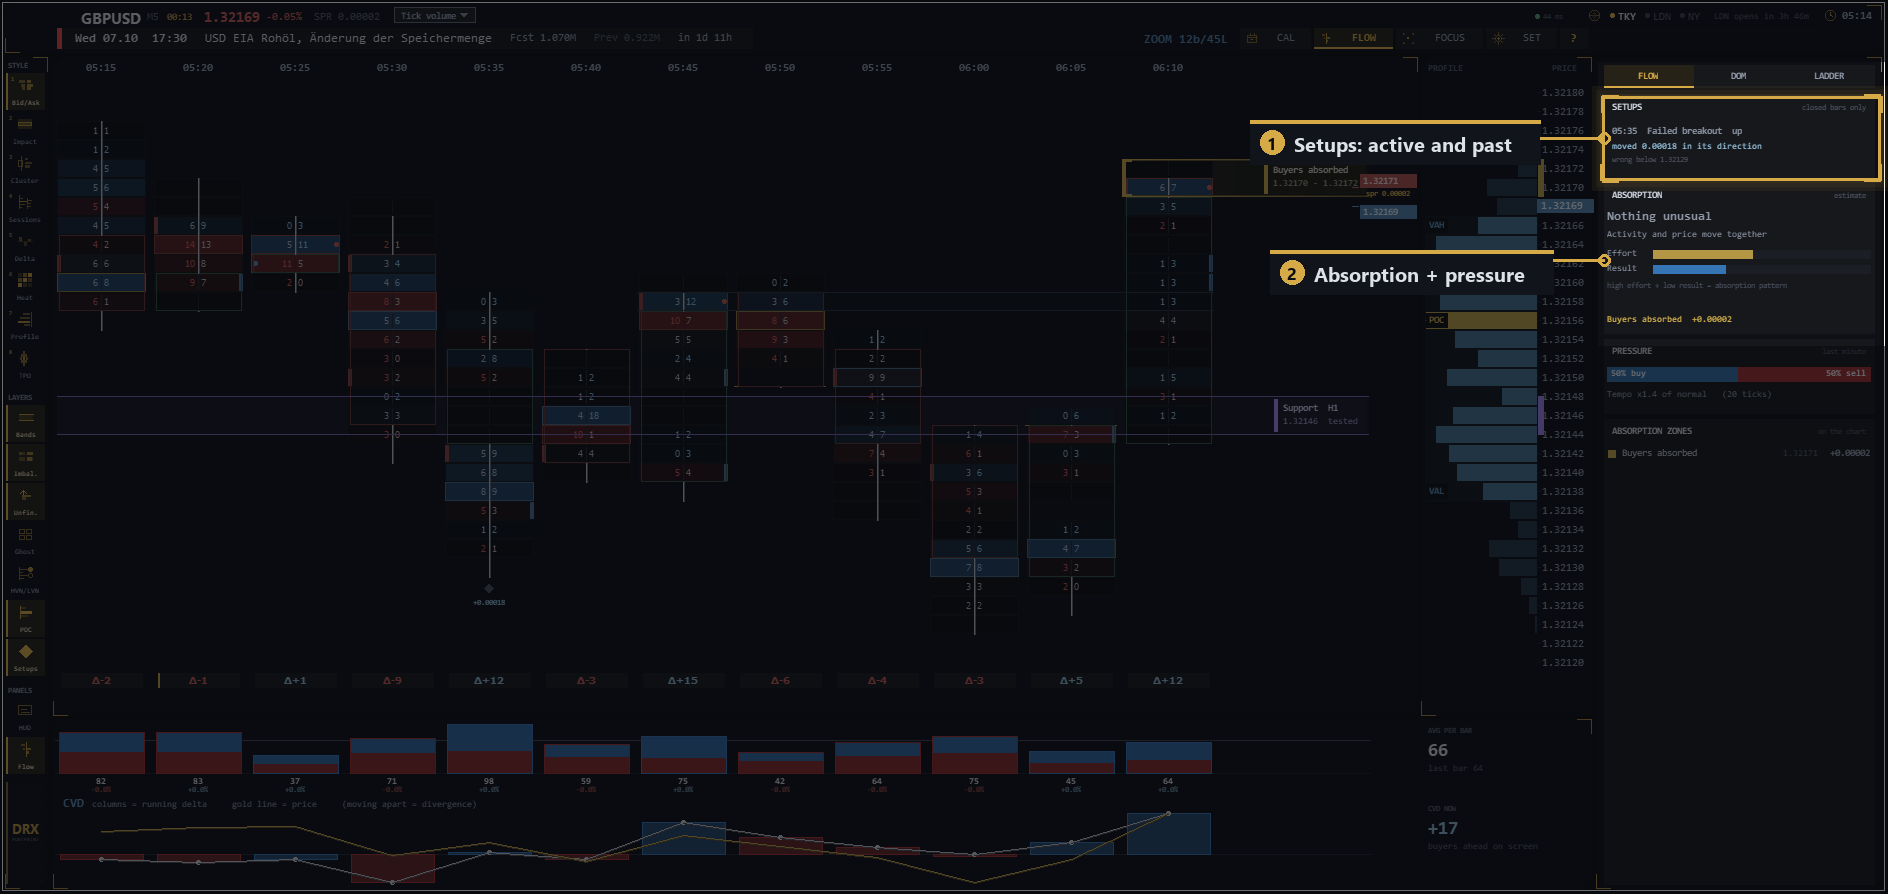
When two facts agree and a third stays flat, the right answer is often "wait". The skill is not to find a signal in every chart. It is to recognise that there is none yet and not to force a trade to make the story fit.
Three mistakes that wreck most order-flow reads
- Reading delta without context. The delta of a single bar means little on its own. It matters relative to the level it printed at and the bars around it.
- Acting on one fact alone. An imbalance without a level, or absorption without a delta shift, is a coin flip. The setups above work as a filter because two or three things line up at once.
- Ignoring what your feed is. On Forex and CFD feeds the volume is tick activity, not contracts, so the numbers show relative activity. That is still useful, but be honest about it. The chip at the top of the chart tells you which feed you have. Futures feeds deliver real trades.
Where OrderFlux fits in
The setup assistant is optional (key A, or the Setups button in the left rail) and each of the three setups can be switched off separately in SET. Everything it marks is measured from the data on closed bars. The demo version lets you try every function on your own symbols.
OrderFlux — Orderflow Footprint Chart for MT5 (view product) · Read the full manual: how to read every panel
Which of these three have you already spotted live: absorption, a breakout with acceptance or a failed breakout? Drop your own example in the comments, with the symbol and timeframe. If you want more of these broken down in short video form, I post them on YouTube.
This post is educational and not financial advice. Trading carries risk.