Abcde MT4
- 指标
- 版本: 1.0
- 激活: 5

ABCDE指标:
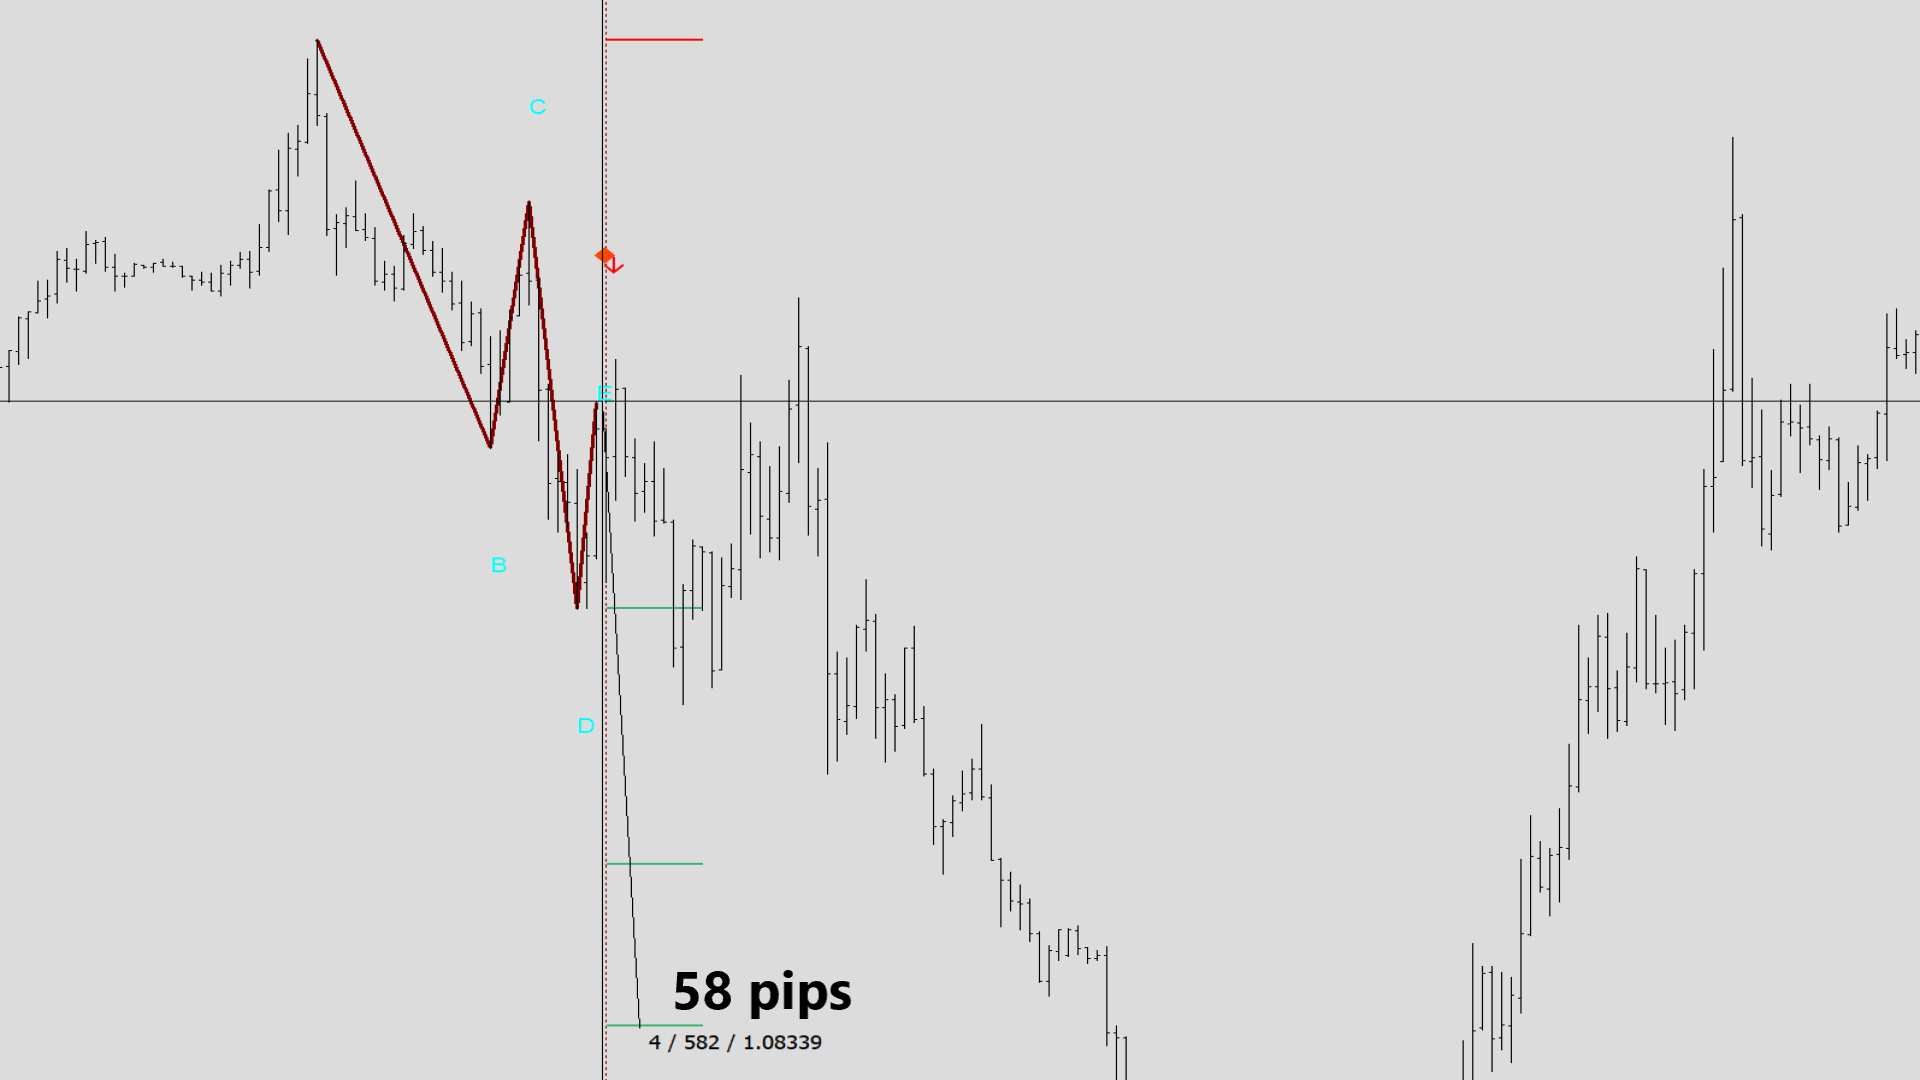
这个指标基于价格行为的主要ABC模式(即突破、回撤、运动)。这些模式类似于上涨基础上涨模式,需要进行趋势分析和背离分析等一系列分析来检查并发出准确的信号。它将提供相当准确的交易信号,并告诉您什么时候开仓和平仓最为合适。它可以应用于任何金融资产:外汇、加密货币、贵金属、股票和指数。
主要特点:
• 非常易于使用
• 多时间框架警报
• 固定价格的止损和获利订单。
• 可以与任何交易工具一起使用(外汇、差价合约、期货等)
• 电子邮件提醒
• 电话通知
• 它将提供相当准确的交易信号,并告诉您何时最好开启和关闭交易。
• 在图表上显示开仓线、止损、获利。
• 有免费演示版本。
推荐设置:
• EURUSD,M15(15分钟图表)
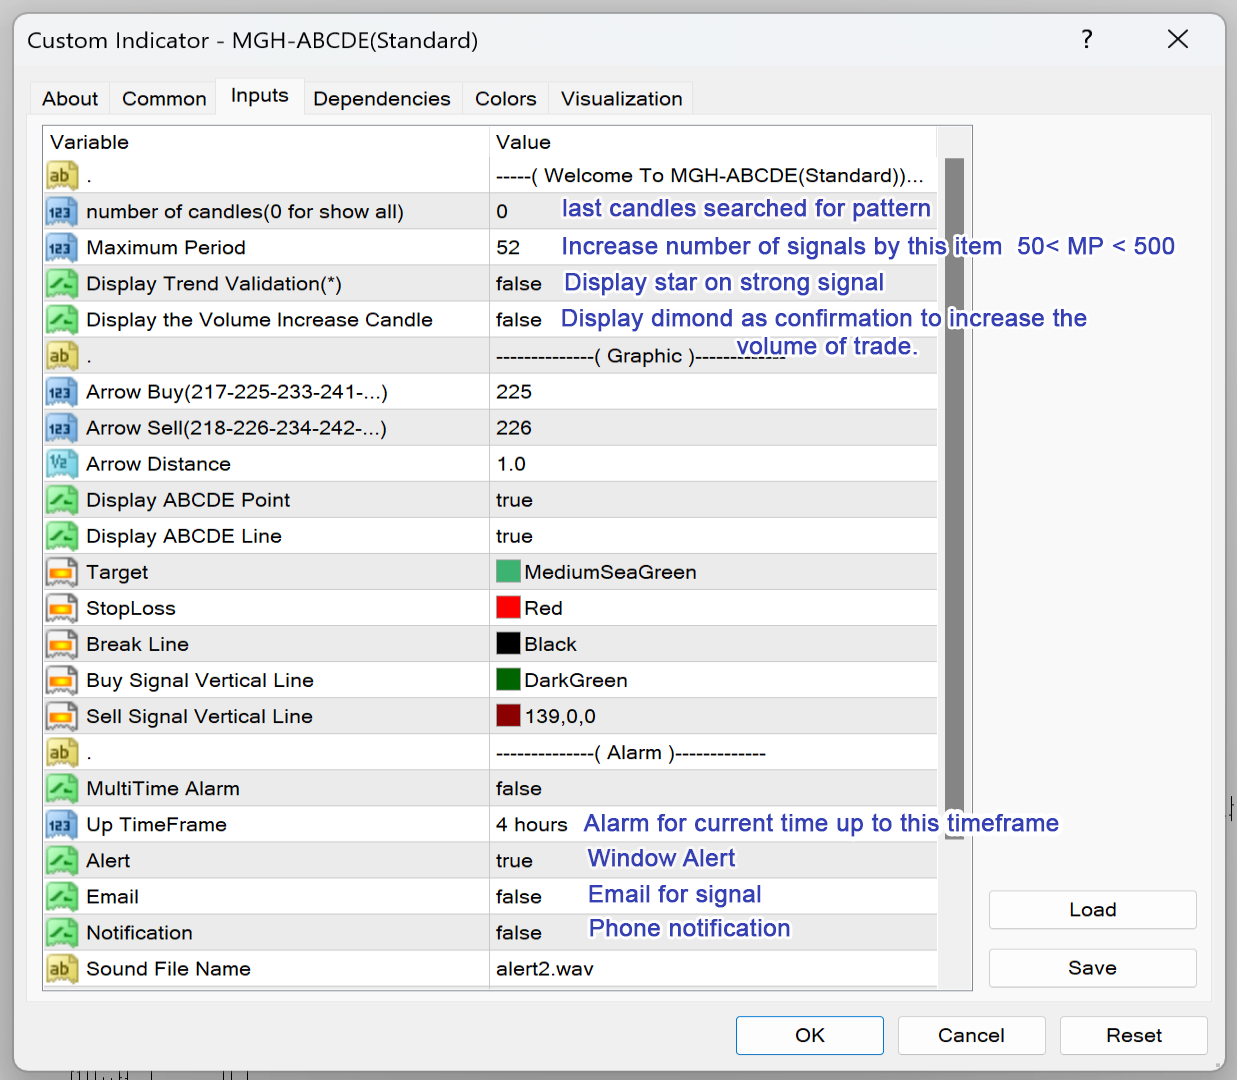
• 显示趋势验证:True
• 显示增量蜡烛图:True
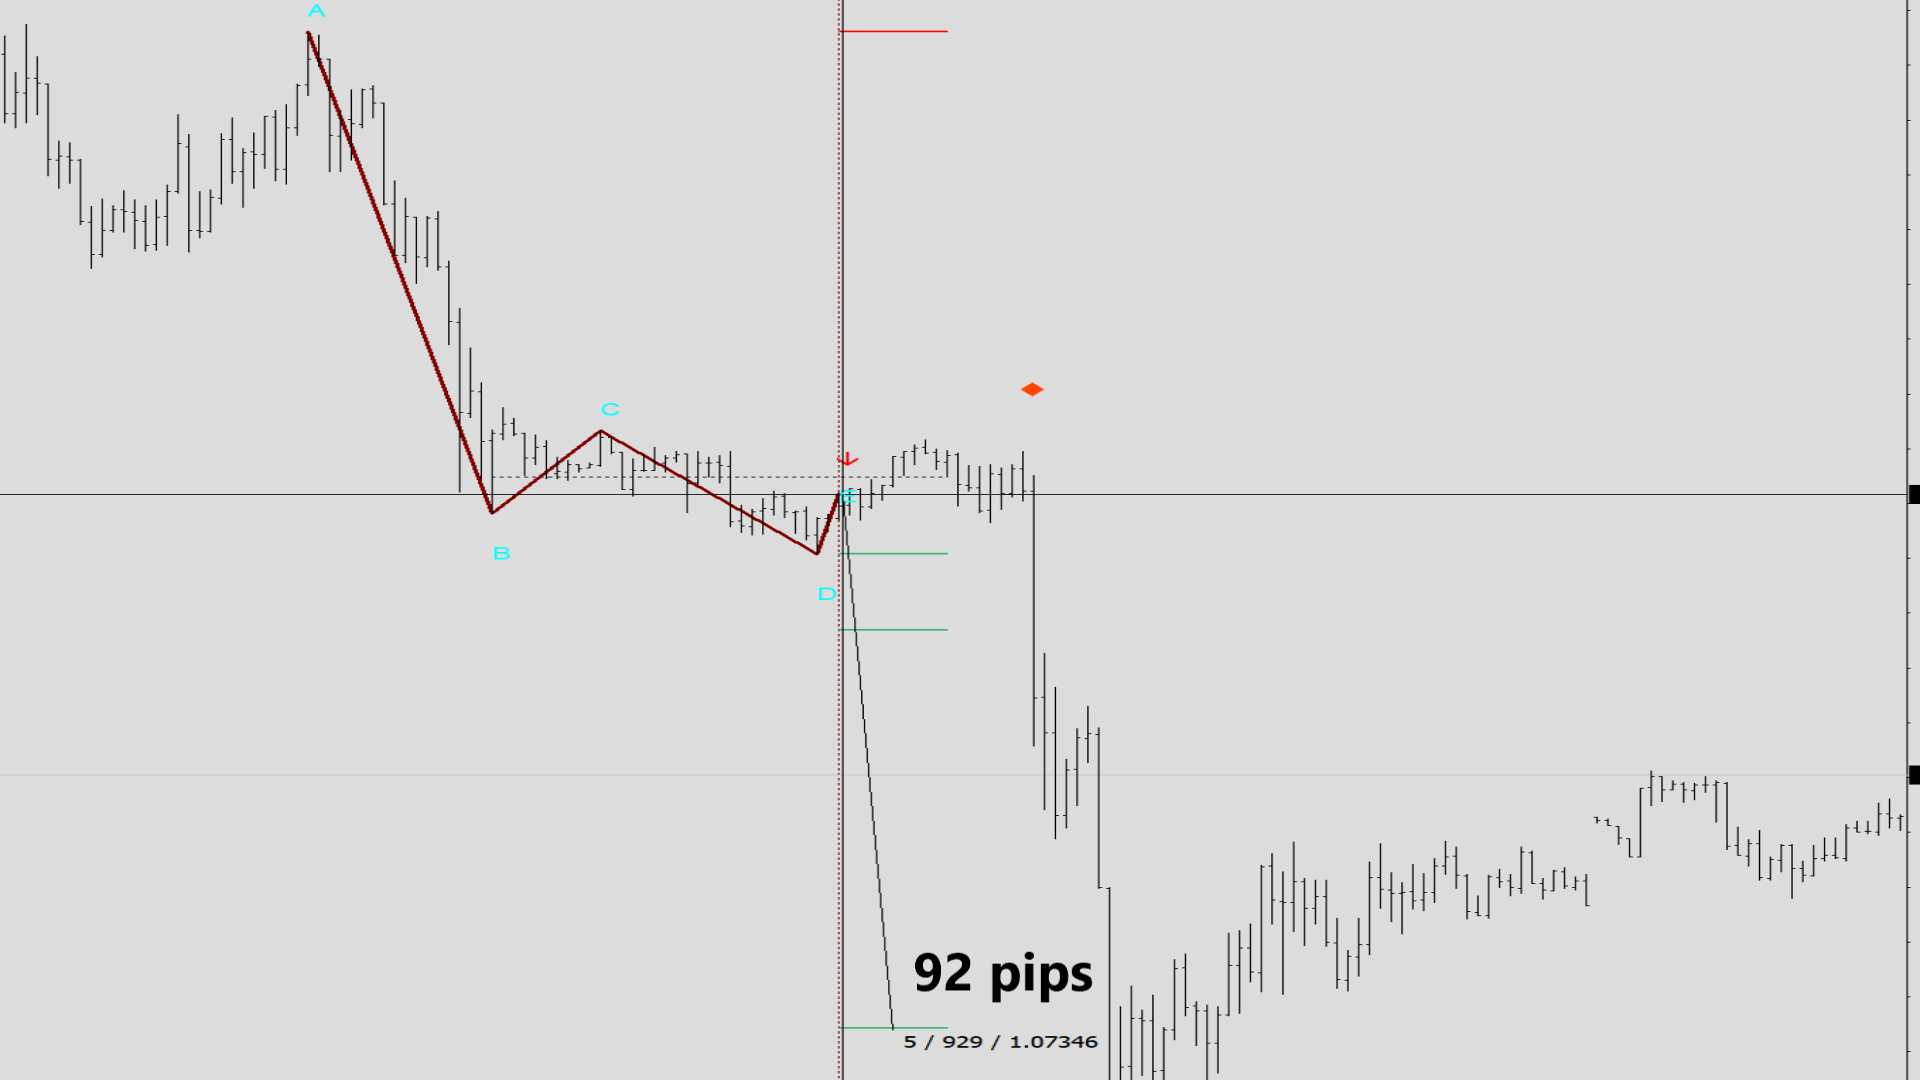
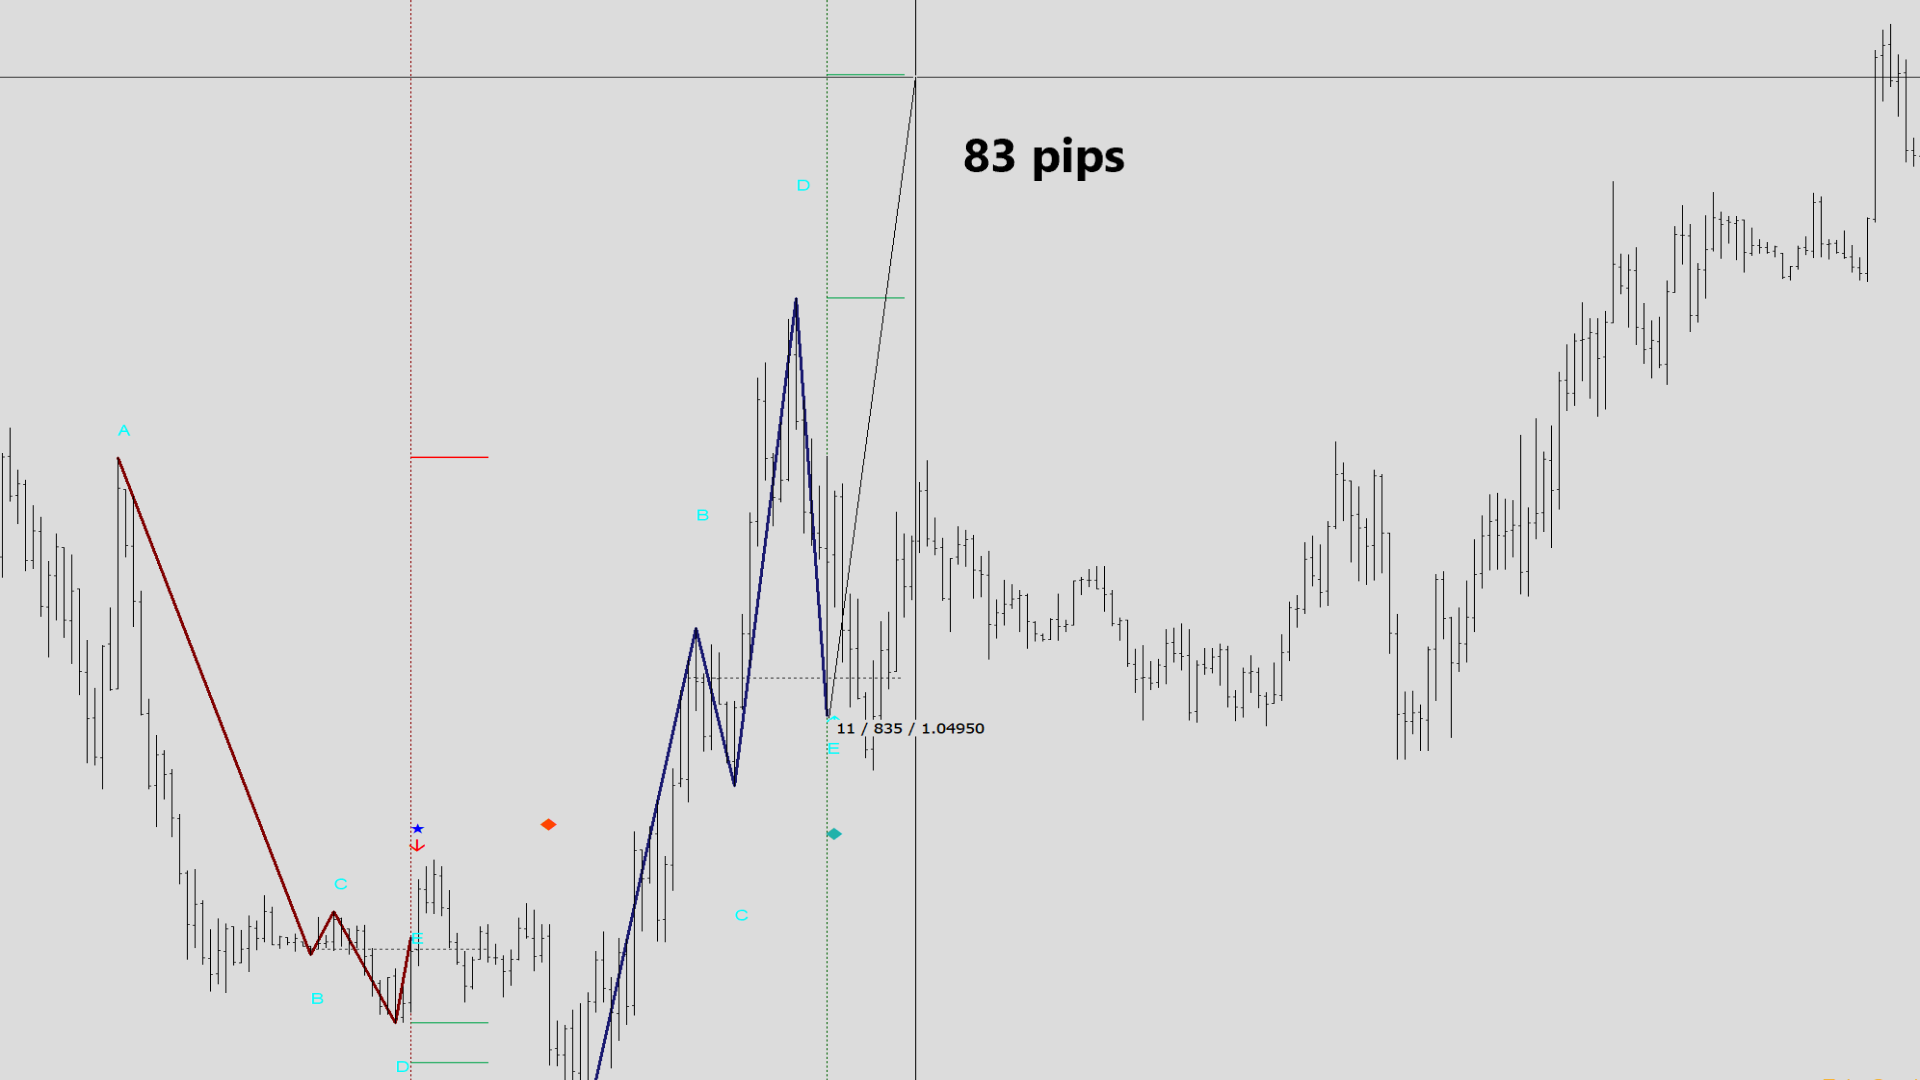
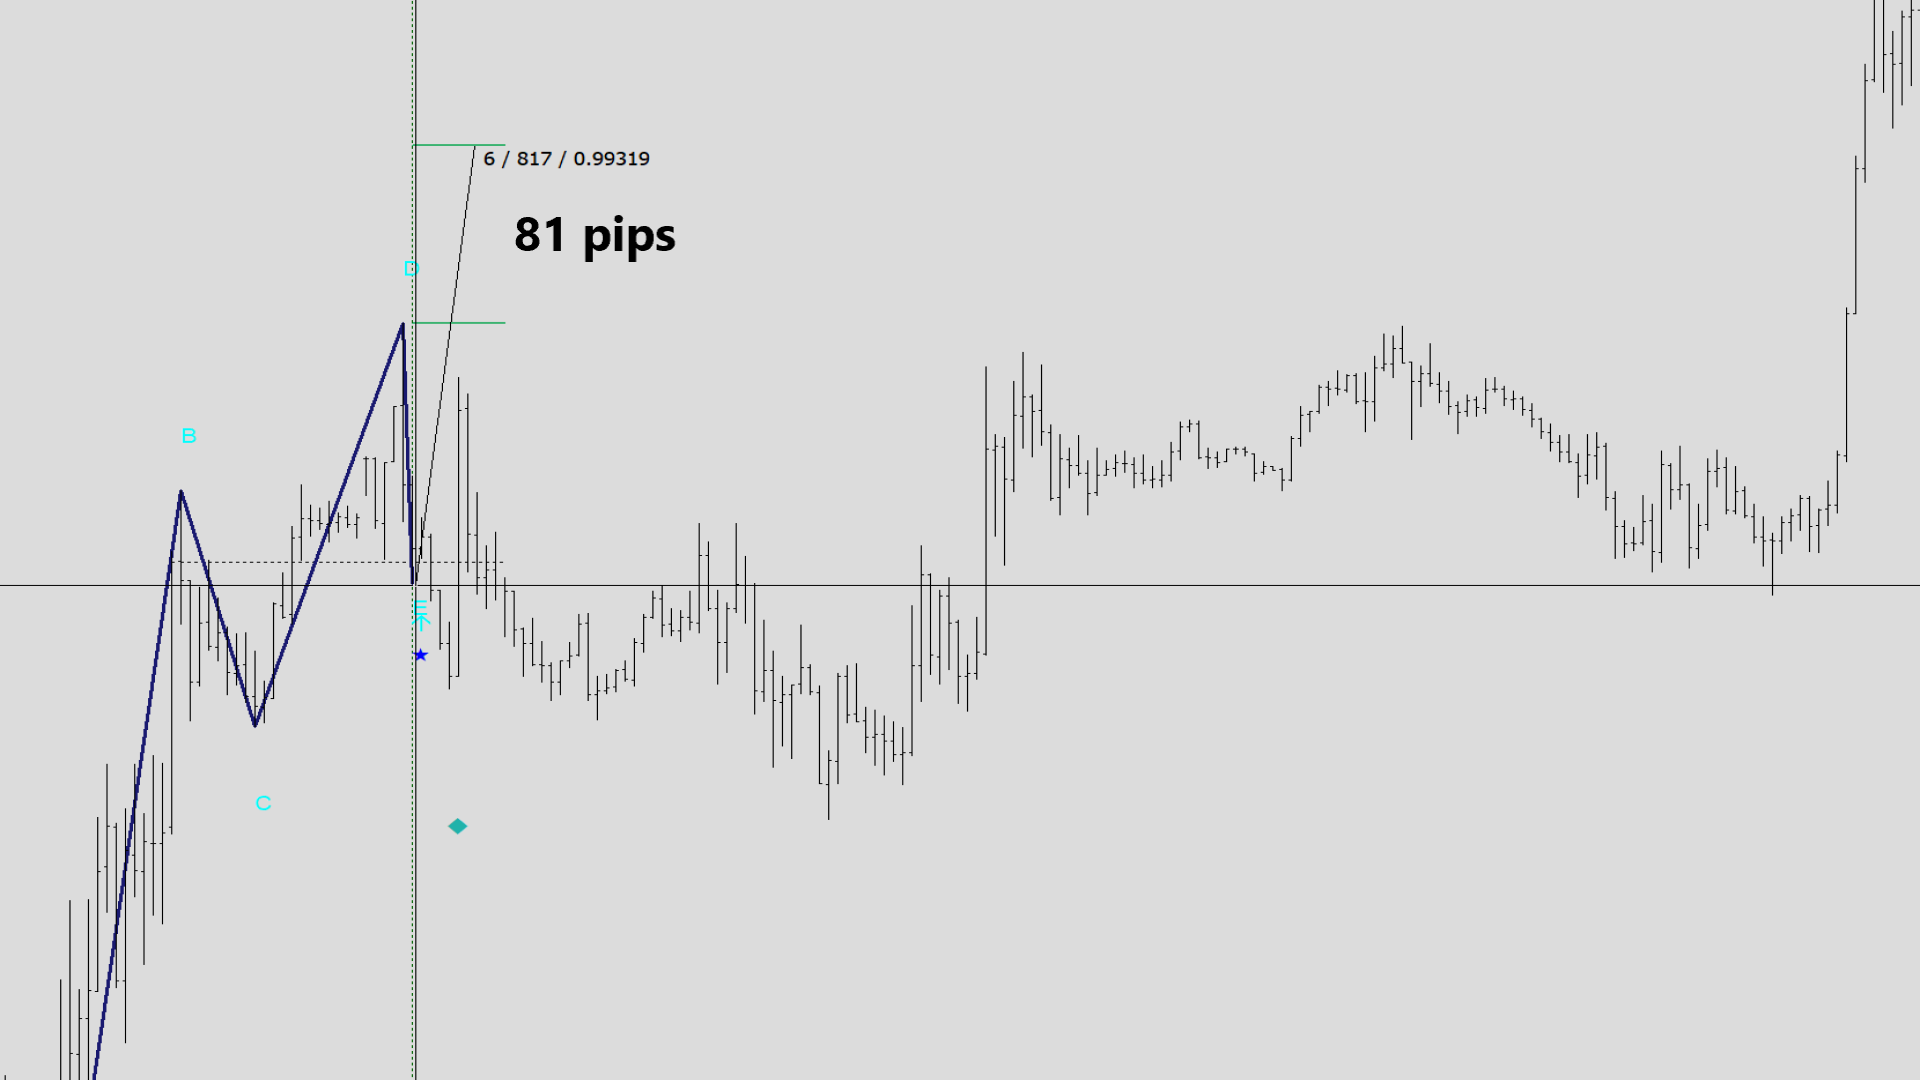
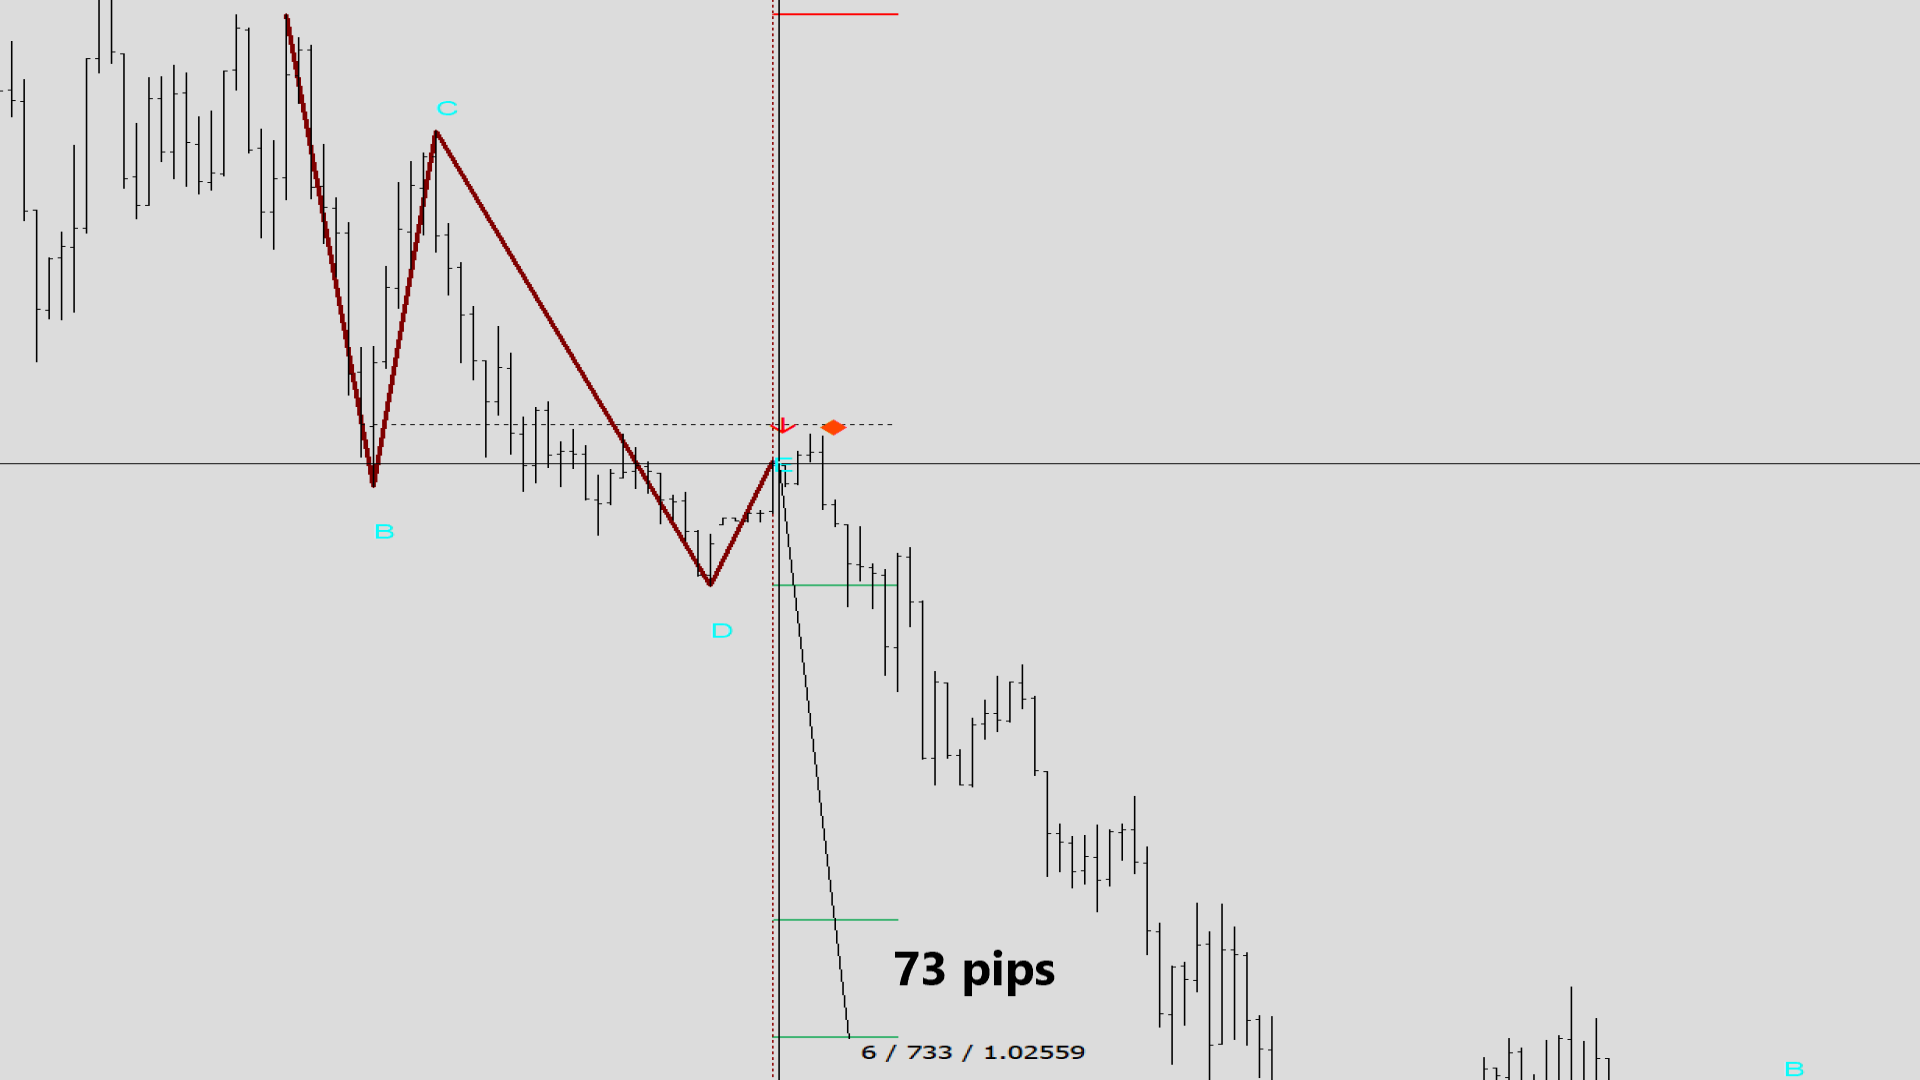
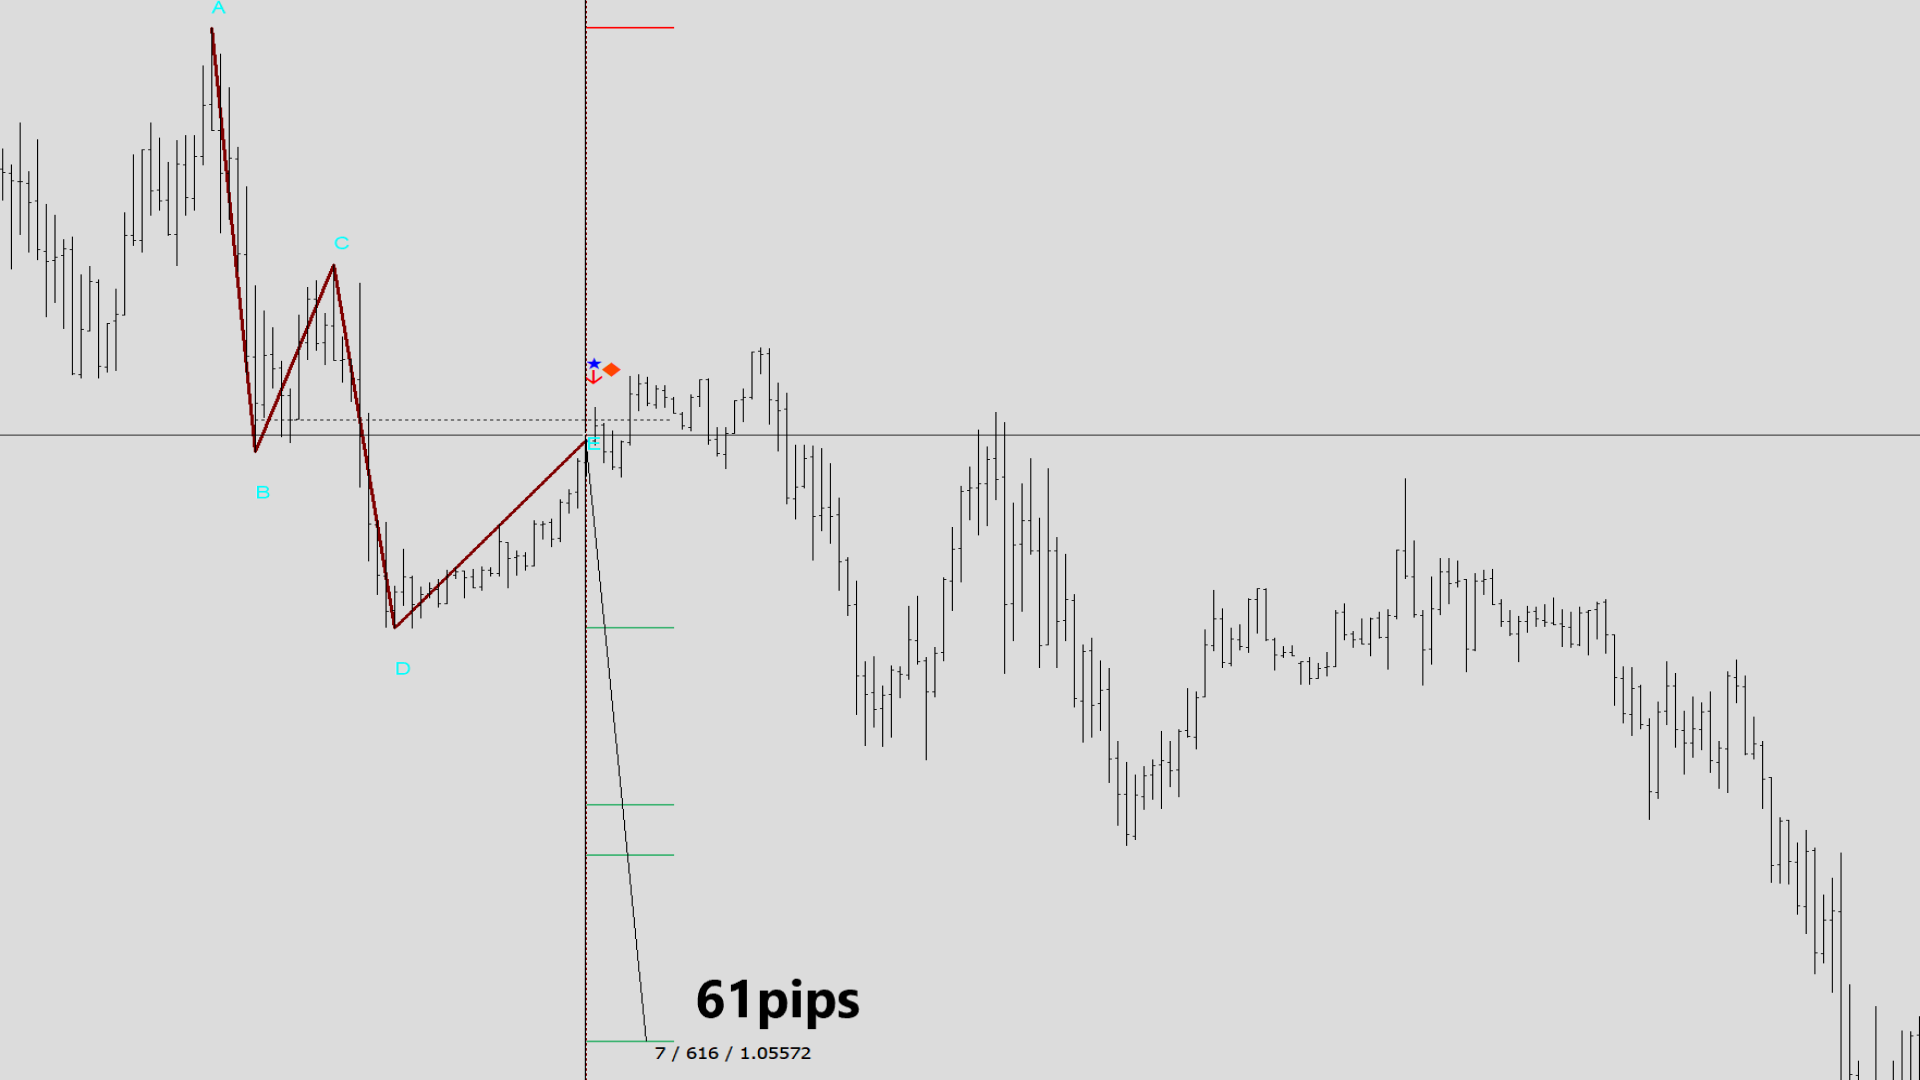
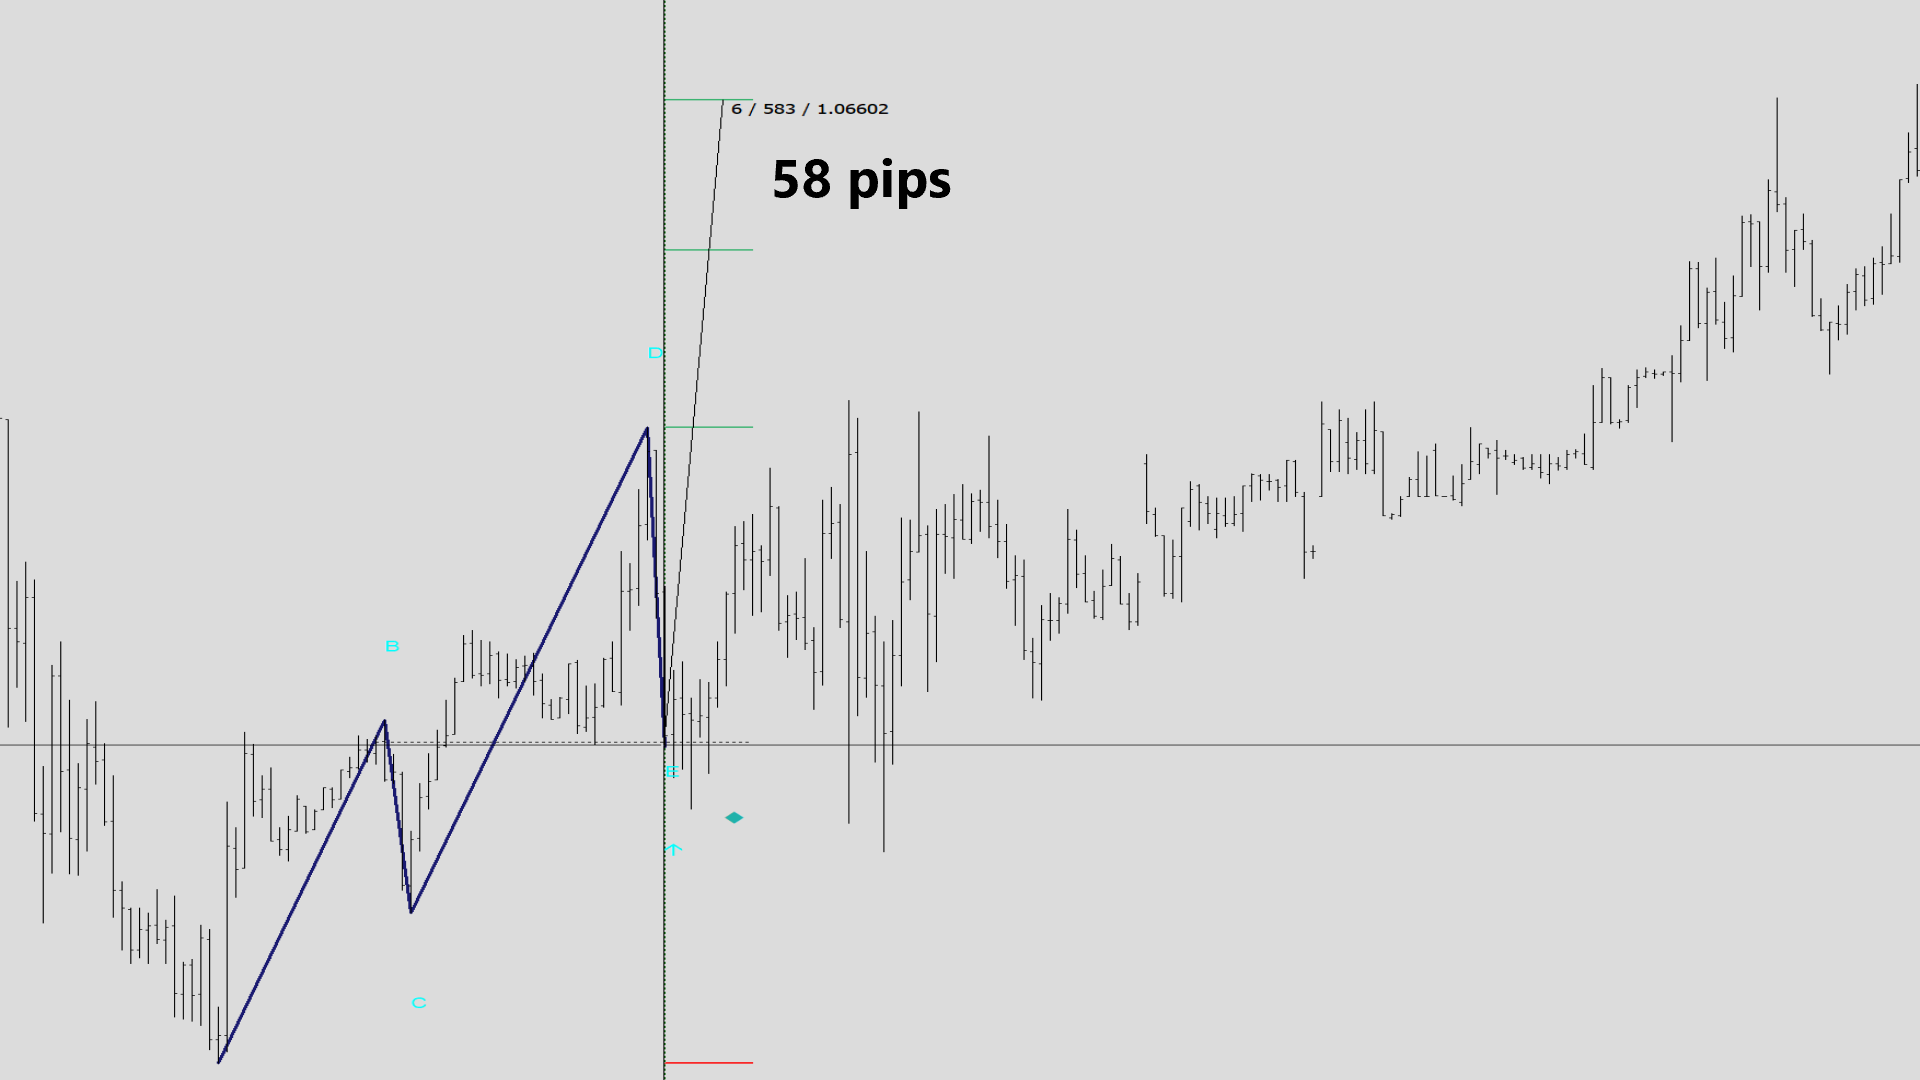
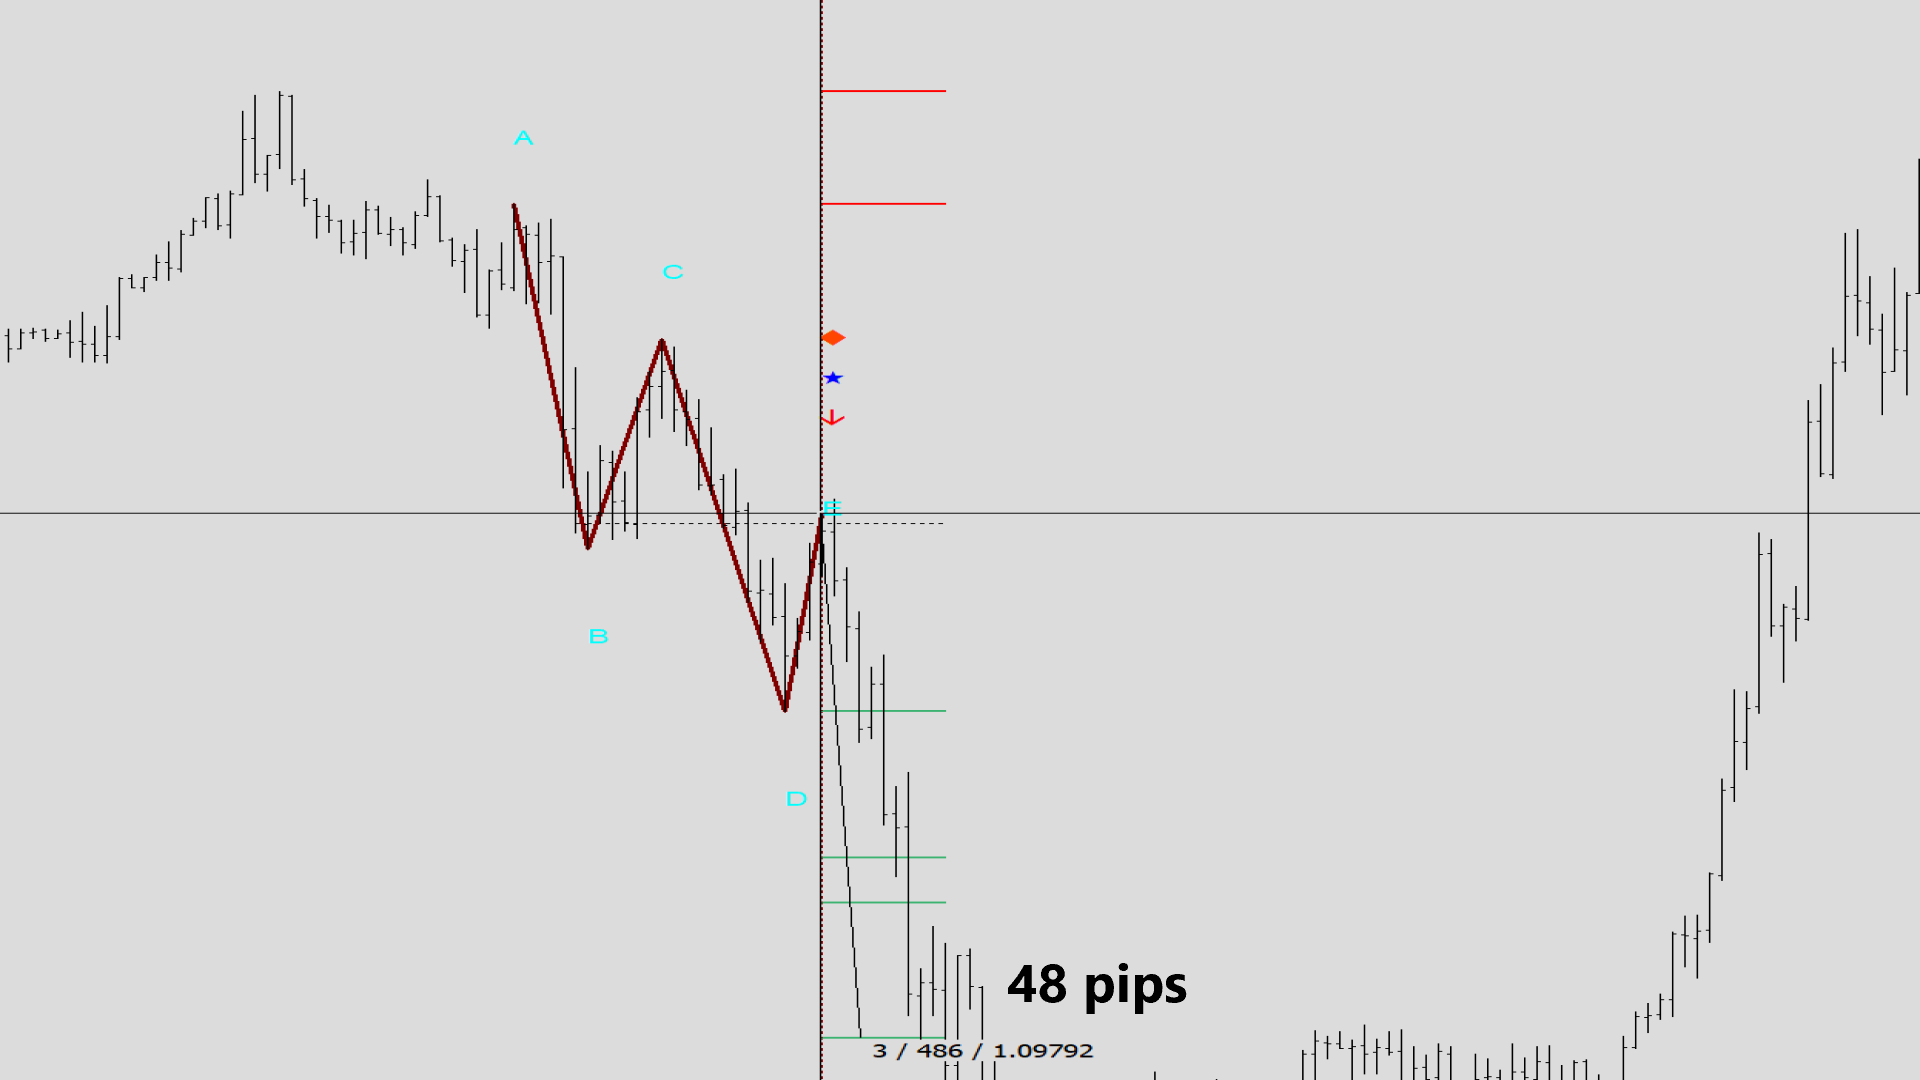
什么是理想的入场点?
进入交易的最佳点是由星形和钻石形态所代表的E点。这些模式将在设置中启用“显示趋势验证”和“显示增量蜡烛图”时显示出来。
我该如何使用ABCD指标进行交易?
- 在交易终端中安装该指标。
- 在设置中调整颜色。
- 通过接收来自指标的信号开始交易,这些信号会告诉您进入交易的理想时机。
- 根据指标信号进入交易,并按照指标建议设置止损和获利水平。
- 设置中有一项叫做“显示趋势验证”,可以检查更高时间框架的趋势。如果信号与趋势相符,则在信号蜡烛上会出现一个小星星。
- 如果信号有星形标记,则可以选择第二个止损(或更远的止损)。
- 通过“增加交易量”选项,您可以增加进场量。此外,此选项本身是一种辅助确认,并被认为是适当的入场点。
- 指标发出的信号旁边有星形表情符号,可以极大地增强信号的发出。
- 增加最大周期将增加信号数量。
- 由于此分析工具相对较重,如果MetaTrader冻结,您可以将设置中的蜡烛数量设置为小于可用蜡烛的整数(例如1000或2000等)。
- 此指标设计为多时间框架工具,您可以从设置中激活多时间框架警报,以监视当前货币对的市场从当前时间到更高时间框架。
- ABCD指标适用于MT4和MT5平台,您可以在任一平台上接收信号。
无论何时有问题,我们的支持团队都可以提供帮助
https://www.mql5.com/en/users/farjamim/