Abiroid High Low Count Scanner
- 指标
- 版本: 1.1
- 更新: 9 二月 2025
- 激活: 20

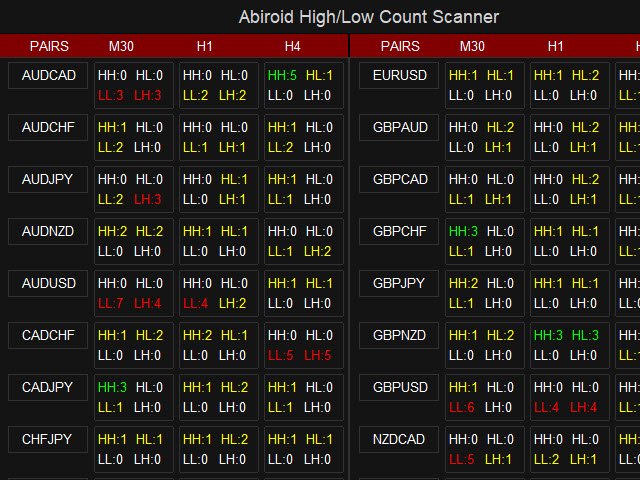
About Scanner:
It will show you the Higher/Lower Highs and Lows of zigzag price.
Use it to keep track of best ongoing trends and price ranges.
Detailed blog post:
https://www.mql5.com/en/blogs/post/750232
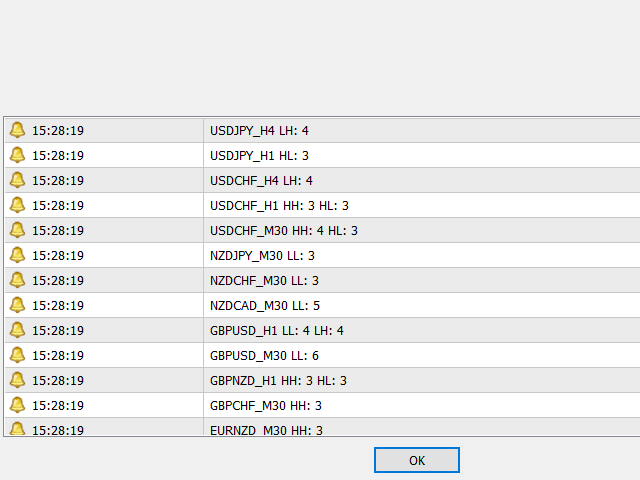
Symbols:
HH: Higher Highs
HL: Higher Lows
When price makes higher and higher Highs or higher Lows:
It will count Zigzag in reverse and find total number of last "Higher Highs" and "Higher Lows" or "Lower Lows" and "Lower Highs".
LL: Lower Lows
LH: Lower Highs
How to Use:
Suppose price is making Higher Highs and Higher Lows, means it's in an uptrend.
And suppose if it is making Lower Lows and Lower Highs, means it is in a downtrend.
If price is showing Lower Highs but no longer Lower Lows, means the trend is possibly ending.
Same for Higher highs.
You can also compare the upper and lower timeframes to see how long the trend has been going on for.
This indicator is a supporting indicator. It is not suitable for standalone trading.
Here are some example strategies that you could use.
Strategy 1:Once you know the ongoing trends, you can use other indicators like Pivots or Fibo, and Volume indicator to find best entry and exit points.
Strategy 2:If ongoing trend is good, use Trendlines to find best entry and exit points.
But you can always set your own Template in the scanner to open a chart with your strategy's template.
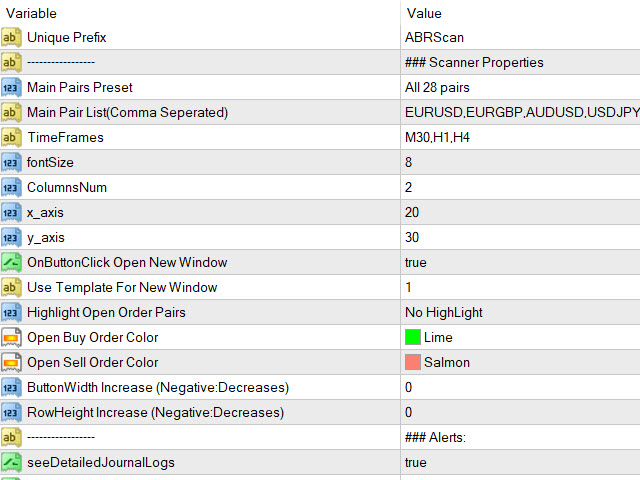
Settings:
Common Dashboard settings:
https://www.mql5.com/en/blogs/post/747456
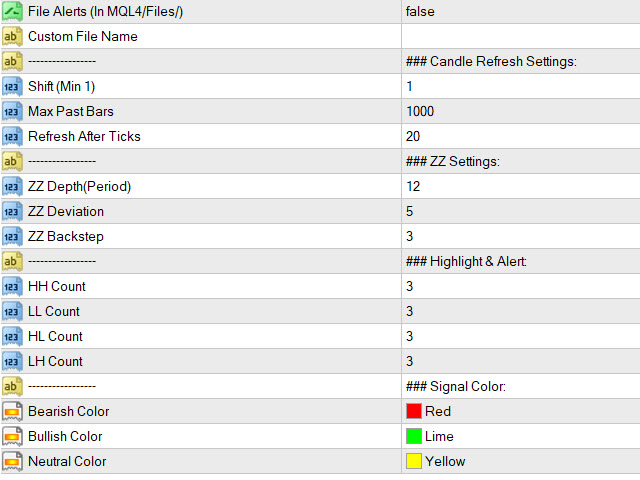
Scanner Settings:
- Shift: Keep this to 1 if you don't want to check current bar ongoing zigzag. Because Zigzag keeps shifting while it is still forming.
So keeping shift to 0, might change scanner values.
- Max Past Bars: Maximum bars to check zigzag values for
- Refresh After Ticks: Refresh dashboard every number of ticks. Keeping this too low might not refresh dash properly.
If you are using 28-pairs for 5 timeframes.. Dash will need 3-4 seconds to refresh. So, keep this value enough so that dash can finish properly.
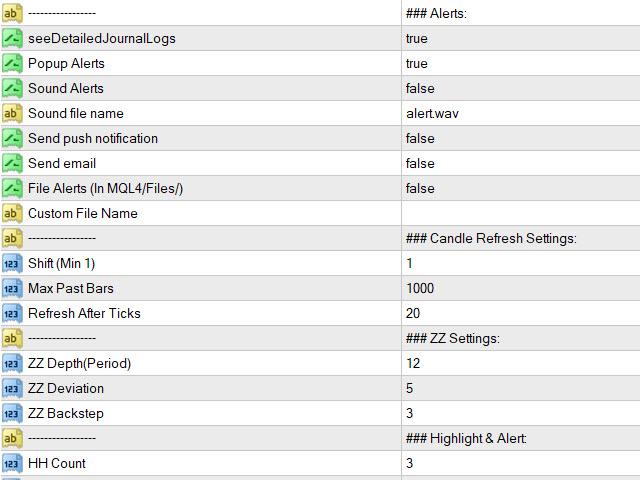
- ZZ Settings: Set the ZZ Depth (Period), Deviation and Backstep here. By default it uses default Zigzag settings: 12,5,3
If you want 3LZZ Semafor Sem3 settings, then set these to 34,13,8
Highlight and Alert:
All HH,HL,LL,LH counts will highlight red/green if number is more that the count here.
Red (Bearish Color) is for Lows (showing downtrend) and Green (Bullish Color) is for Highs (showing up trend)
It will also alert every time price crosses this count. If you want to turn off alerts, then keep Popup Alerts to false.