版本 5.7
2025.06.28
1. If you turn off the filter buttons for both symbols, important news for all currencies will be displayed.
2. Fixed the display of the "s" button to return to the original graph symbol
版本 5.6
2025.06.26
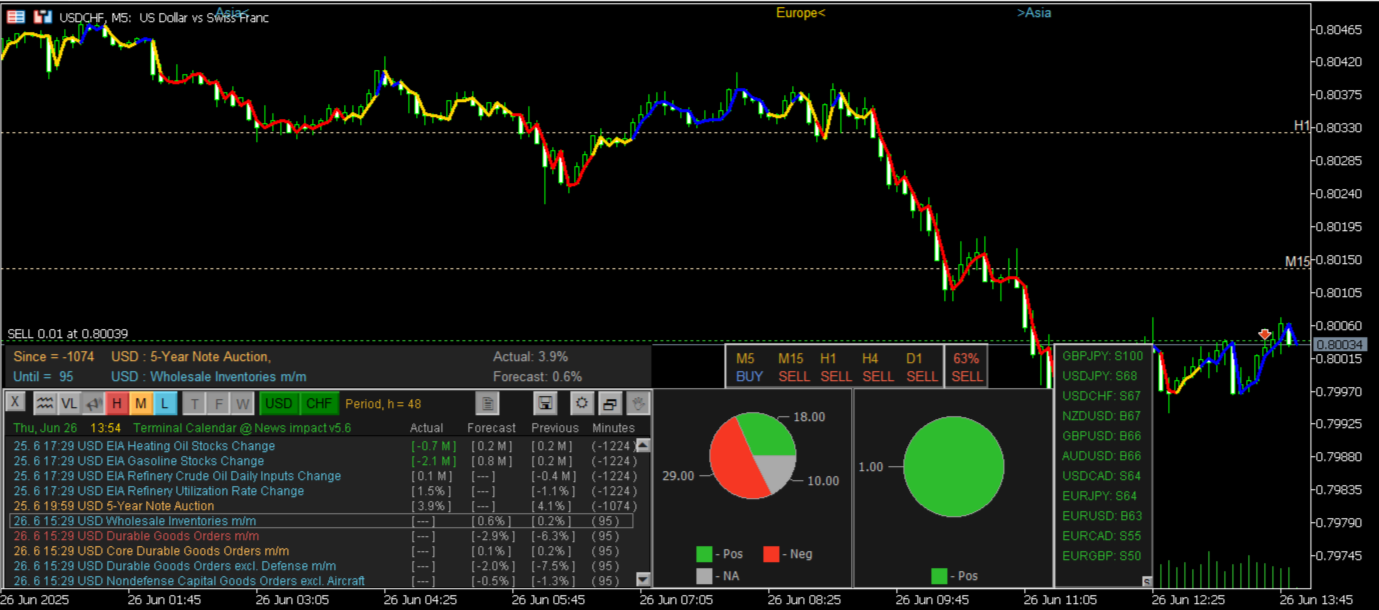
1. The identification of trading sessions is displayed at the upper limit of the chart
2. Added time parameters for trading sessions
3. Added a trend line indicator to the chart (Showtrendline=true; parameter) 0=null, 1=Buy, 2=Sell
4. The algorithm for starting the indicator on the chart has been adjusted
5. Adjusted the operation of the Scale and markup parameter
6. Added the "s" button to return to the start chart symbol
版本 5.5
2024.06.03
1. The management of labels for levels of trend direction change has been adjusted
2. The operation of the X button has been corrected
3. Fixed the audio notification of the news publication.
4. The Custom sound file parameter has been added. The file must be located in the terminal directory\Sounds. Only WAV audio files are played.
版本 5.4
2024.05.10
1. The Display Local time parameter = true; (by default) switching the displayed time from terminal to local
2. Added the Trend calc mode=Average value of the span Min/Max; (by default) parameter
版本 5.3
2024.04.08
1. The terminal time display has been adjusted
2. Added the Display Local time = false; parameter switching the displayed time to local
版本 5.2
2024.03.15
Access to the Investing.com news file has been adjusted
版本 5.1
2024.03.10
1. The work with the Investing.com site has been corrected
2. Fixed the display of the news impact index values on the chart
版本 5.0
2024.03.08
1. Added the ability to select a news source: terminal calendar or website Investing.com (News source parameter)
To access the site, you will need the Get News5 utility: https://www.mql5.com/en/market/product/110468
and terminal setup: Allow WebRequest for News from investing.com : Tools->Options->Expert Advisors Add=https://sslecal2.investing.com
2. The trend indicator has been improved and optimized
版本 4.7
2024.02.26
1. The column of the news impact index for the previous period in the right symbols panel is excluded
2. Corrected the display of the pie chart when switching it
版本 4.6
2024.02.14
The algorithm for changing the timeframe or symbol has been adjusted
版本 4.5
2024.01.01
1. The Allow change symbol mode has been adjusted
2. Added a button to control the chart display
版本 4.4
2023.12.25
Fixed the setting for saving the indicator modes
版本 4.3
2023.12.22
Fixed the output of trend levels
版本 4.2
2023.12.19
1. Added the parameter allowing/prohibiting overloads the graph symbol : Allow change symbol = false;
2. Button for recording .CSV news file has been added
3. Added File Start Time and File End Time parameters
版本 4.1
2023.12.18
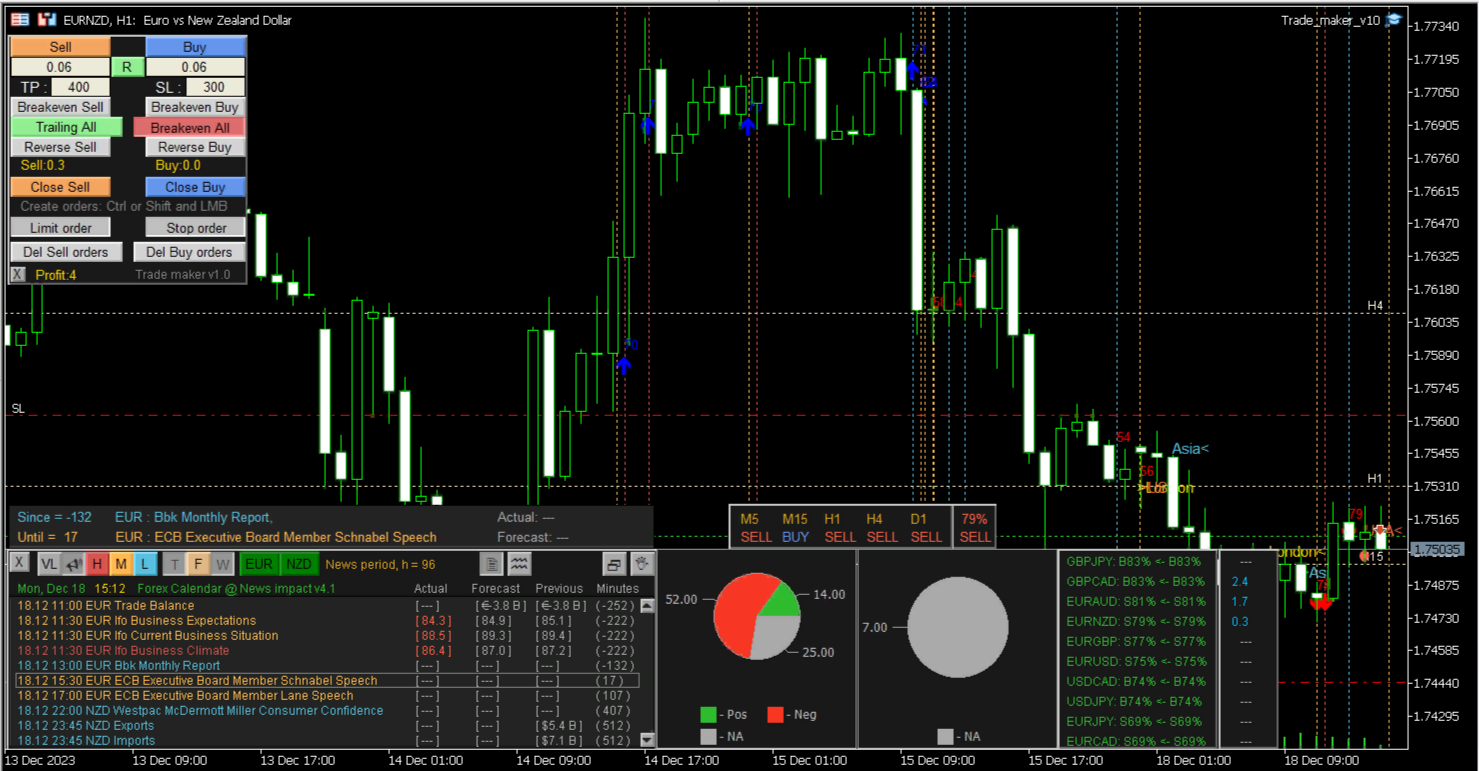
1. Clicking on the right panel overloads the chart symbol to the selected one and updates all indicator data
2. Added output to the chart of trend direction change levels for each of the five indicators
3. Added a panel with information about the profit of open positions by the symbols of the specified Magicnumber
版本 4.0
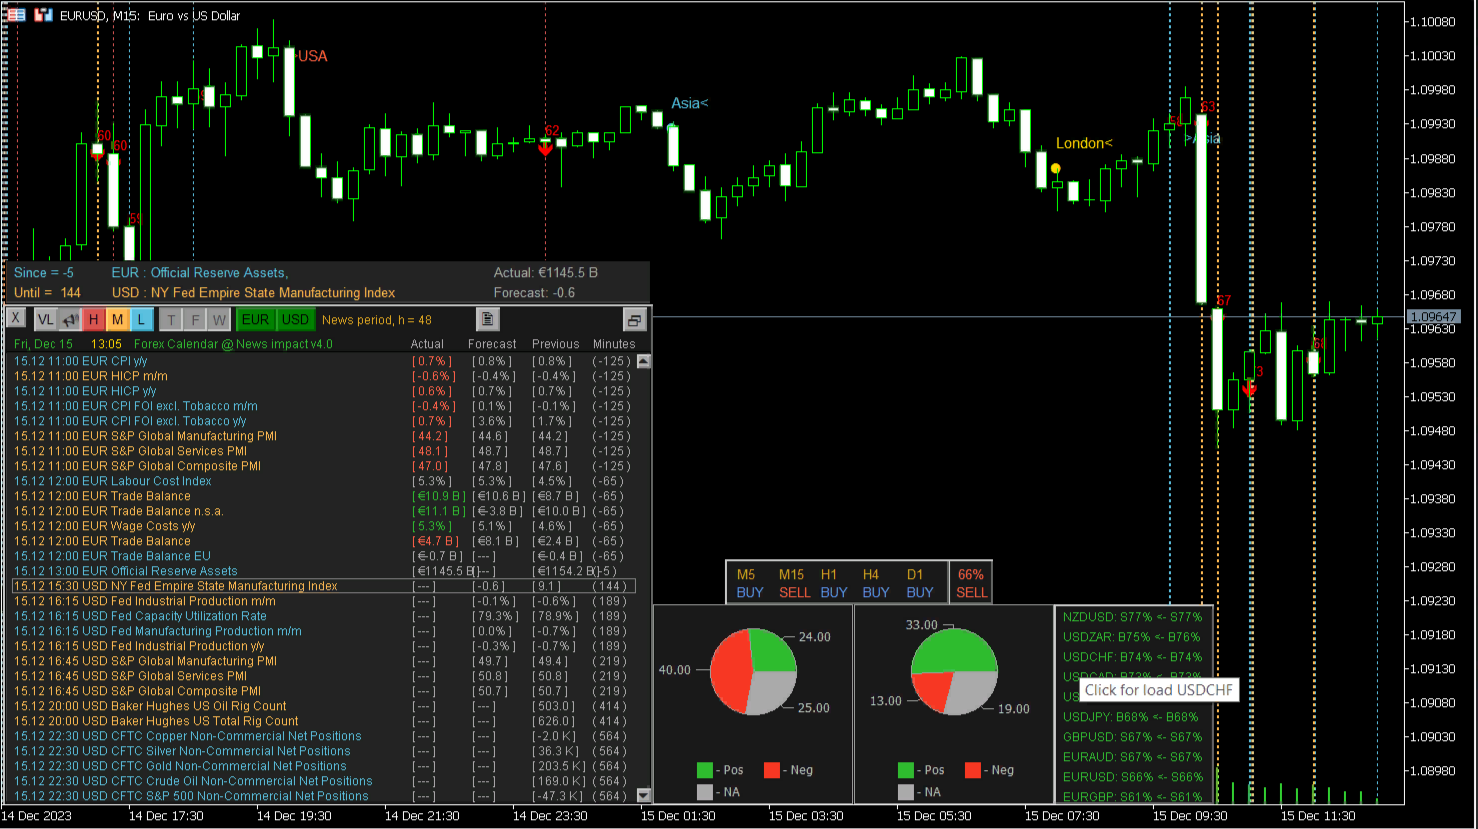
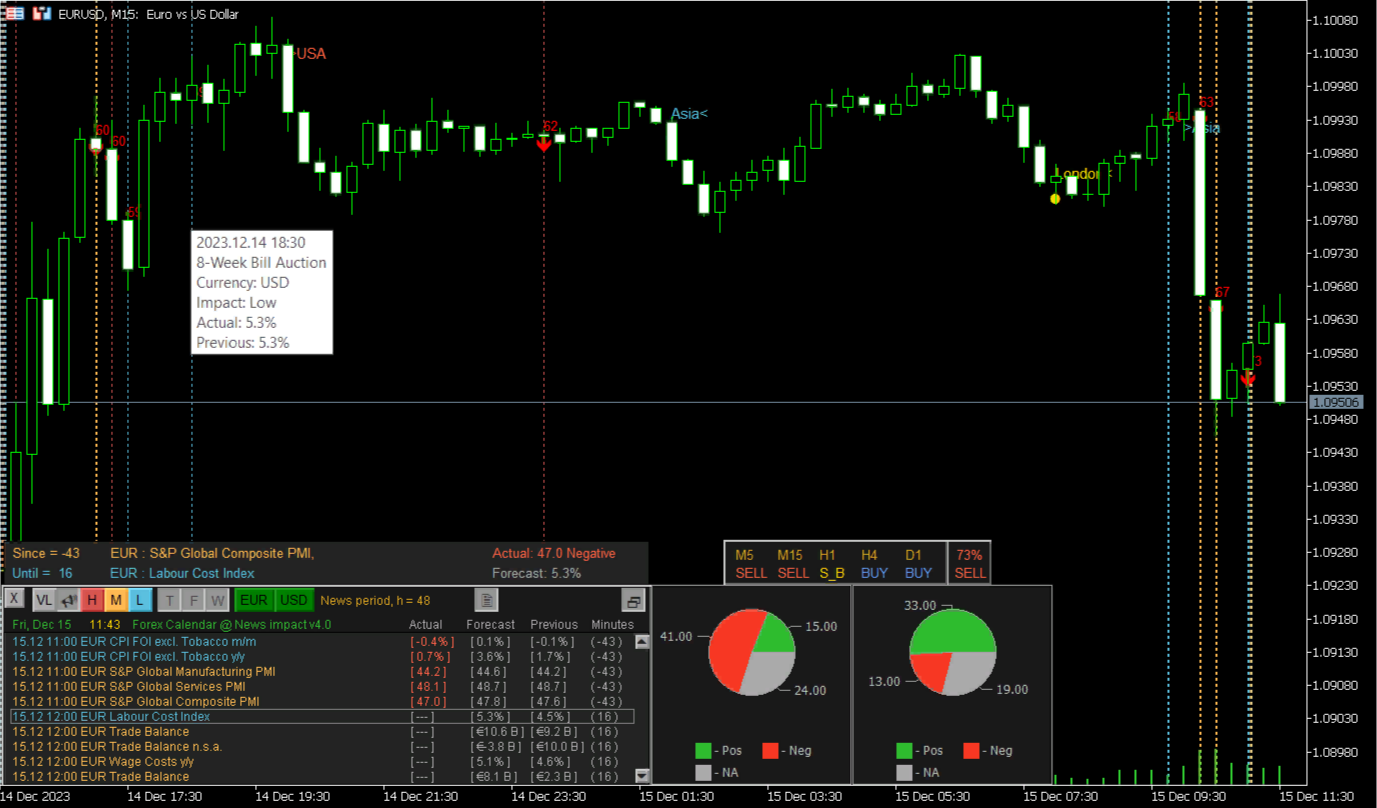
2023.12.15
When switching symbols using the right panel, the data of trend indicators is updated
版本 3.9
2023.12.12
1. Redesigned interface
2. Five customizable trend indicators have been added
3. Fixed scrolling of news in the table
4. Fixed the multiplicity of displaying vertical lines of future news
版本 3.8
2023.12.09
1. The terminal remembers the indicator settings when changing the timeframe
2. The indicator has been switched to the terminal timer
版本 3.7
2023.12.03
Added the Scale and markup parameter = 100% (default)
版本 3.6
2023.12.02
Fixed the display of vertical lines
版本 3.5
2023.12.02
A filter has been made for symbols with a dot in the name
版本 3.4
2023.11.14
1. The Start time offset to the past parameter is set in hours
2. Optimized the output of vertical news lines
版本 3.3
2023.10.29
1. Corrected the output of the current news values
2. Added VL button (Hide/Show vertical news lines on the chart)
3. The operation of the X button has been corrected (Show/Hide the indicator)
4. The parameters of the trend indicator panel have been changed
版本 3.2
2023.10.16
Added the Hide the Trend panel = false parameter;
版本 3.1
2023.10.12
Added trend indicator for two timeframes and its parameters
版本 3.0
2023.10.08
Corrected the output of information to the current news panel
版本 2.9
2023.10.04
1. Added a panel for displaying information about the current past and next news
2. Added output to the schedule of the start and close of trading sessions (London, New York, Tokyo)
3. Added a parameter that allows you to display news on the chart determined by the parameter value (convenient for indexes)
4. Added parameters:
Currency pair news = ""; //The entered value is used to display news, if not specified, then the symbol of the current chart
Show current panel = true;//panel for displaying information about the current past and next news
Show trading sessions = true; //Displays labels for the beginning and end of trading sessions (London, New York, Tokyo)
版本 2.8
2023.09.28
1. Added parameters:
Show signal arrows = true;
The size of the arrows on the chart = 2;
Show the signal value = true;
Signal Font size = 9;
2. Changed default parameter values
3. Renamed the parameter Limit the impact of news, % to The value of the news impact filter, %
版本 2.7
2023.09.09
1. In the terminal, set Options->Charts->Precise time scale
2. Vertical lines of news coming out at the same time will be displayed on the chart with some offset
3. The vertical line of the future next news is displayed on the chart to the right of the current time
4. Added Setting Ray parameter of vertical lines = false;
版本 2.6
2023.08.13
1. Vertical news lines on the chart remain after clicking the hide "X" button, if the Show vertical lines parameter = true;
2. The actual value of the news with the characteristic of impact has been added to the hint of the vertical line
版本 2.5
2023.07.20
Fixed the display of news values in the table.
版本 2.4
2023.04.03
Added parameters: Always show USD news=false; и Include USD Low news=false;
版本 2.3
2023.02.23
Fixed the error of "disappearing" the Hide button when expanding the news list
版本 2.2
2023.02.21
1. Hide news/Show news button added
2. The pie chart panel has been corrected
版本 2.1
2022.12.05
The interface has been corrected
版本 2.0
2022.09.04
Added a filter by currency pair symbols
版本 1.9
2022.04.25
Added the Show vertical lines parameter
版本 1.8
2022.04.16
Fixed the output of vertical lines marking news events on the graph
版本 1.7
2022.03.27
Added the ability to scroll the news table
版本 1.6
2022.03.25
Added the ability to switch a currency pair by clicking on the row of the ratings panel of the impact of preset pairs
版本 1.5
2022.03.24
Values for the current and previous periods have been added to the news impact results panel by the list of symbols
版本 1.4
2022.03.23
1. Added font settings
2. Added the parameter of the maximum number of rows in the viewport
版本 1.3
2022.03.22
Added a panel of resulting estimates of the impact of news on 10 currency pairs
版本 1.2
2022.03.21
Added the resulting assessment of the impact of news on the currency pair: BUY and SELL as a percentage
版本 1.1
2022.03.20
Fixed bugs


The product is well and carefully made. The developer's assistance is always timely and present. It proves to be very useful to have an overview regarding events that are upcoming. Very satisfied. We also optimized some settings together. I would add that Aleksander is always available and ready to make further improvements and changes.