The Fantastic ADX21

4

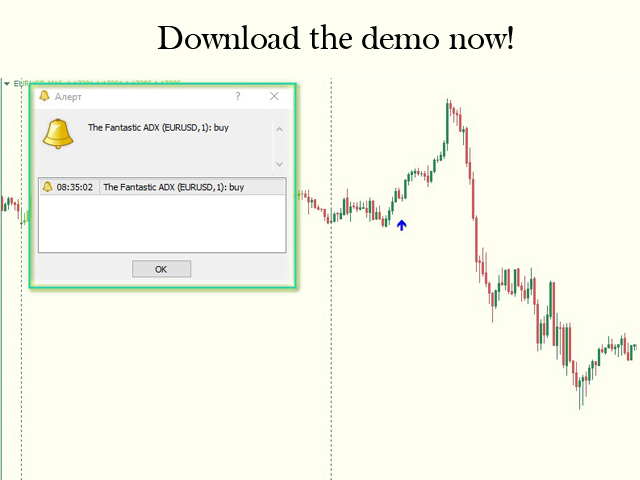
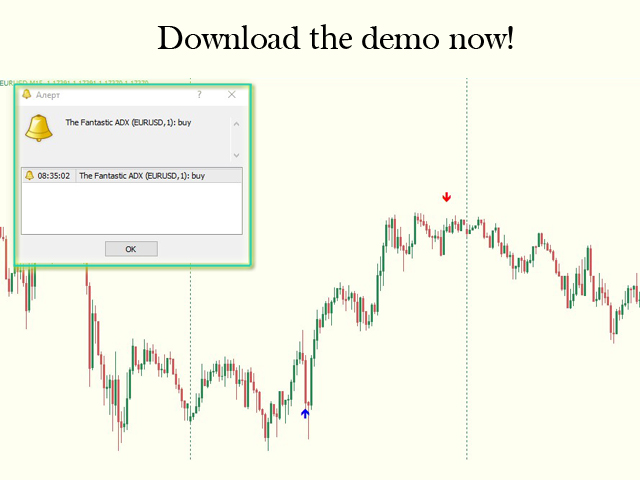
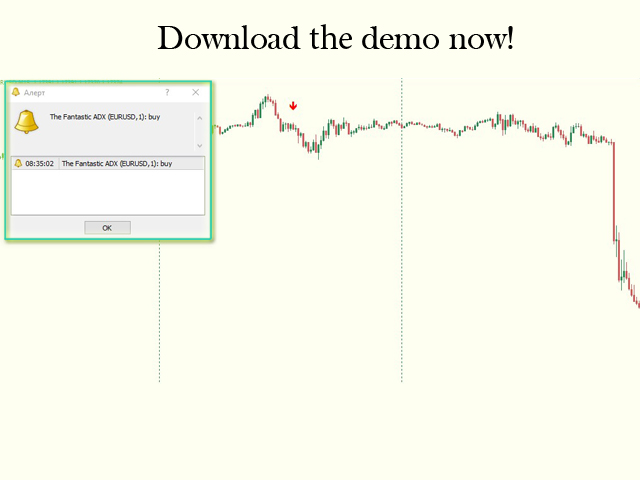
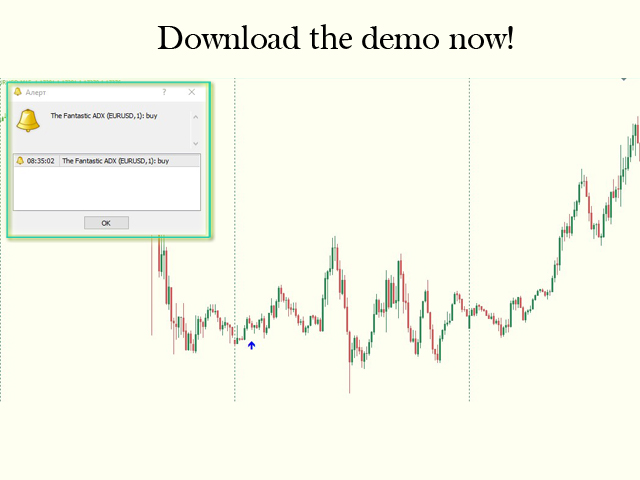
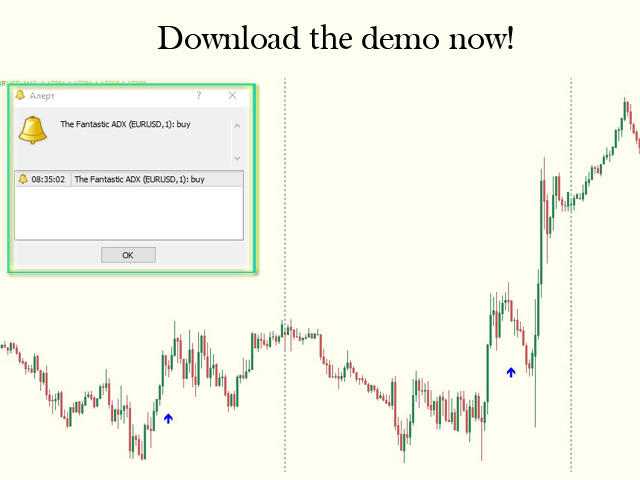
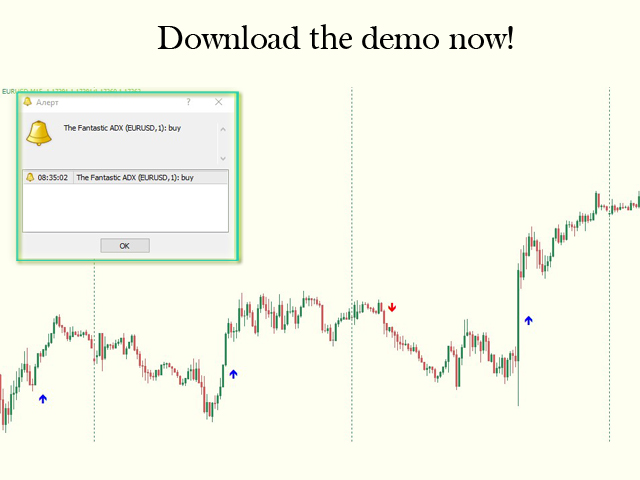
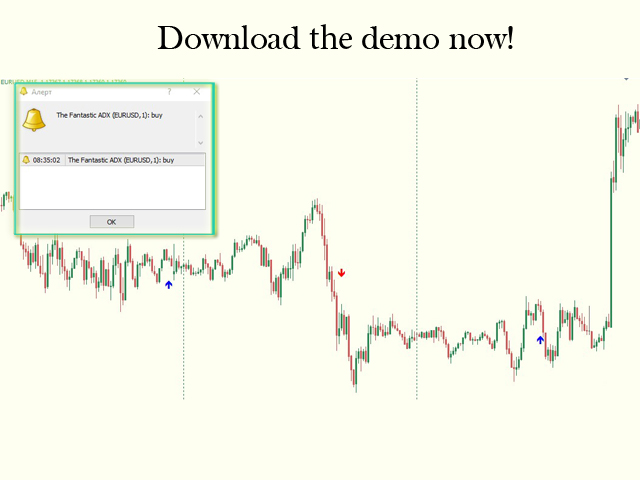
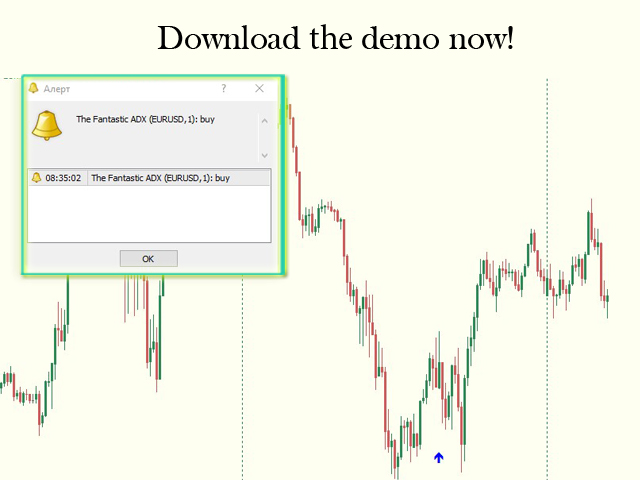
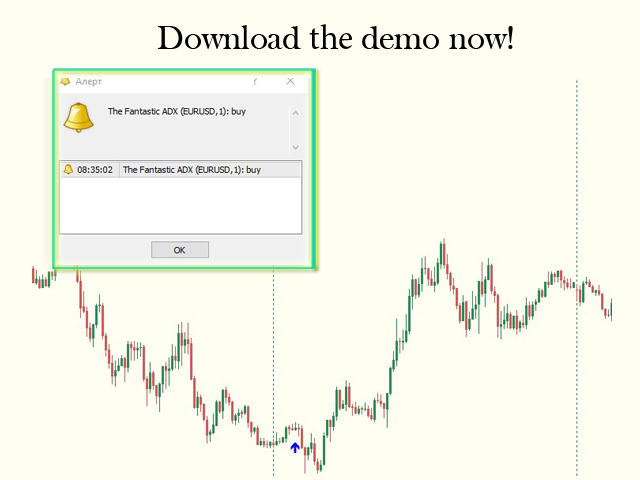
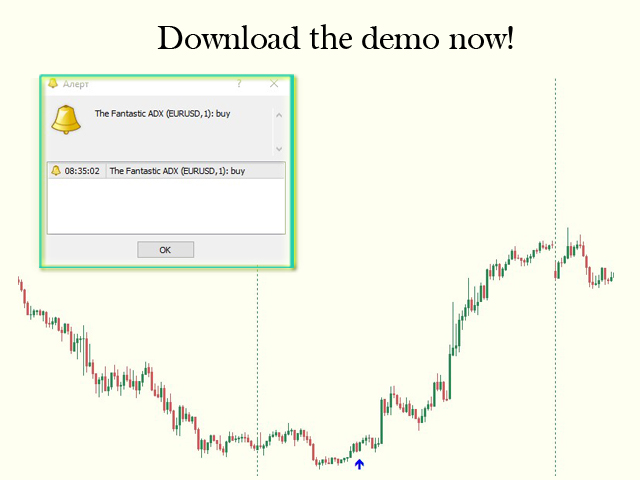
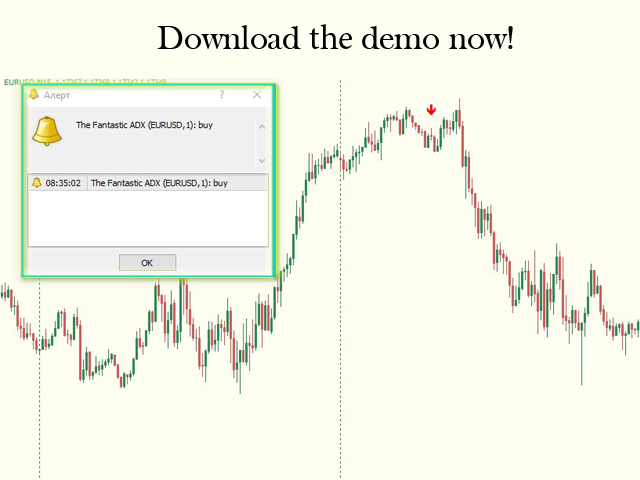
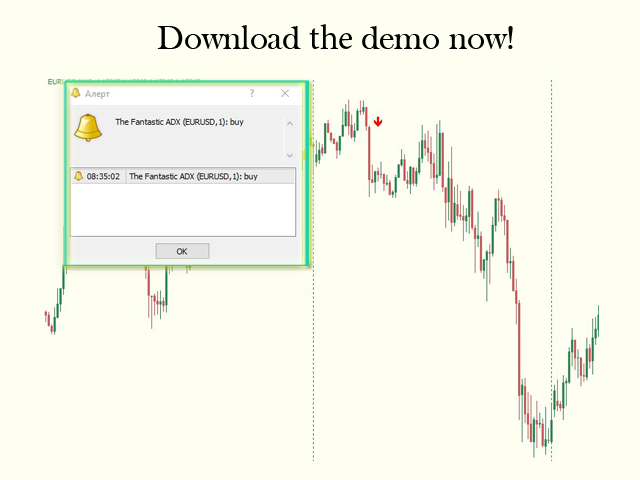
.See screenshots of the indicator.

Uses information about the current trend.

It is based on the classic ADX indicator.

Gives a signal to enter a trade using a non-standard strategy.


Settings:

Name Description
Period of ADX The period of the classic ADX indicator
Distance between +D & -D lines Distance between + D and -D lines. Determines the strength of the trend.
Freshness of the signal (bars) Checking the freshness of a buy or sell signal.
Selects the very first signal in the span.
The number of bars to check is indicated.
Arrow distance from entry point (ATR) The distance at which the arrow is drawn.
Indicates the multiplication factor of the ATR indicator value.
If you specify 0, the arrow will be drawn at the position opening point.
This setting does not affect the signal, only the visual part.
Alerts Signal presence alert.
Arrows are not repaint.


The indicator is easy to use. I wish you a good trade!

Subscribe to my telegram channel, where we discuss intraday trading, ideas, indicators, etc., a link in my profile contacts.


评分 1
lauro1956
5752
lauro1956 2022.02.22 11:30 
 

fast operations

推荐产品
Persian Ichimoku: The Next Generation of Fibonacci-Enhanced Trading Elevate your Ichimoku strategy with the most advanced and customizable Ichimoku indicator on the Market. The Persian Ichimoku is not just another Ichimoku cloner; it is a professional-grade trading powerhouse designed for traders who demand precision, flexibility, and deeper market insights. By merging classic Ichimoku Kinko Hyo logic with Fibonacci ratios and the innovative Quality Line , this tool redefines trend analysis. ###
Follow The Line
Oliver Gideon Amofa Appiah
3.94 (16)
FOLLOW THE LINE GET THE FULL VERSION HERE: https://www.mql5.com/en/market/product/36024 This indicator obeys the popular maxim that: "THE TREND IS YOUR FRIEND" It paints a GREEN line for BUY and also paints a RED line for SELL.  It gives alarms and alerts of all kinds. IT DOES NOT REPAINT and can be used for all currency pairs and timeframes. Yes, as easy and simple as that. Even a newbie can use it to make great and reliable trades. NB: For best results, get my other premium indicators for more
FREE
Wise Men Indicator demo
Bohdan Kasyanenko
3 (2)
The indicator displays signals according to the strategy of Bill Williams on the chart. Demo version of the indicator has the same features as the paid, except that it can work only on a demo account . Signal "First Wise Man" is formed when there is a divergent bar with angulation.  Bullish divergent bar - with lower minimum and closing price in the upper half. Bearish divergent bar - higher maximum and the closing price at the bottom half. Angulation is formed when all three lines of Alligator
FREE
和谐图案最适合预测市场转折点。和谐图案为您提供高胜率和一天内的高交易机会。 该指标识别了最受欢迎的和谐图案,这些图案预测市场反转点。 基于和谐交易书籍。 重要说明: 该指标不会重绘或滞后(它在D点检测到模式);它不会重新绘制(模式要么有效,要么取消)。 使用方法: 将指标拖放到您的MT5图表上。 将模式检测设置为TRUE(ABCD; Gartley)。 根据您的喜好调整偏差(较大的偏差=更多的模式;较小的偏差=更少的模式)。 根据您的喜好自定义颜色。 根据需要启用或禁用关于入场点、TP和SL的警报。 检测到模式时: 该算法在D点检测到模式。 如果启用了警报,它将通知您检测到的模式。 如果模式无效,则触发一个带有“模式已取消”消息的警报。 成功的模式在蜡烛关闭时触发“入场警报”。 如果价格达到TP1、TP2、TP3、TP4或SL,则会发出带有终端消息的警报。 价格现在为40美元,仅剩下几份副本,最终价格将为70美元。 发展计划: 该指标的当前版本(1.1)将检测Gartley和ABCD模式。 版本1.1将包括Butterfly、Bat和Crab模式。 未来版本将包括其他模式、潜在PRZ检
FREE
Auto Supply and Demand Oscillator is an indicator for MetaTrader 4 and MetaTrader 5 that detects supply and demand zones automatically and displays them as a single oscillator value at the bottom of the chart, instead of drawing rectangles directly on price. Concept Supply zones are price areas where strong selling created a sharp downward move away from a balance area. Demand zones are price areas where strong buying created a sharp upward move. Traditional implementations draw boxes on the
FREE
什麼是 Schaff Trend Cycle? Schaff Trend Cycle(STC)是一種振盪指標,用於及時捕捉市場趨勢的反轉。與傳統指標如移動平均線或MACD相比,STC 結合了循環週期與動能,可更清晰地辨識趨勢的開始與結束。 主要特點 明確的趨勢反轉信號:上升趨勢中週期線上升,下降趨勢中週期線下降。 在震盪行情中降低噪音:基於循環的平滑處理有助於過濾短期波動。 參數靈活可調:可通過調整週期與平滑參數來適配不同交易風格。 計算邏輯概覽 動能計算 根據設定週期內的價格變化,計算短期與長期動能。 循環平滑處理 對動能進行雙重平滑處理,提取循環成分。 標準化 將結果標準化到0至100之間,以振盪圖形式顯示。 信號產生 當指標線突破25或75時,產生買入/賣出信號。 輸入參數 CyclePeriods – 動能計算的週期。預設值:10 FastMA – 短期平滑移動平均。預設值:3 SlowMA – 長期平滑移動平均。預設值:3 OverboughtLevel – 超買區閾值。預設值:75 OversoldLevel – 超賣區閾值。預設值:25 如何安裝此指標 在 MQL
FREE
Free automatic fibonacci
Tonny Obare
4.67 (49)
Free automatic Fibonacci is an indicator that automatically plots a Fibonacci retracement based on the number of bars you select on the BarsToScan setting in the indicator. The Fibonacci is automatically updated in real time as new highest and lowest values appears amongst the selected bars. You can select which level values to be displayed in the indicator settings. You can also select the color of the levels thus enabling the trader to be able to attach the indicator several times with differe
FREE
Support resistanses show
Meysam Ghasemi
1 (1)
.....................................hi....................... ................for showing high s and low s and support and resistanses .....................we have a lot of ways............................... it can be helpful for finding trends , higher highs , higher lows , lower highs , lower lows .......................today i write on of thems.......................... ........................you can enter the number of last support and resistanses .........................and it will dra
FREE
Ppr PA
Yury Emeliyanov
4.67 (3)
"Ppr PA" is a unique technical indicator created to identify "PPR" patterns on the currency charts of the MT4 trading platform. These patterns can indicate possible reversals or continuation of the trend, providing traders with valuable signals to enter the market. Features: Automatic PPR Detection:   The indicator automatically identifies and marks PPR patterns with arrows on the chart. Visual Signals:   Green and red arrows indicate the optimal points for buying and selling, respectively. Ar
FREE
PZ Penta O MT4
PZ TRADING SLU
2.33 (3)
The Penta-O is a 6-point retracement harmonacci pattern which usually precedes big market movements. Penta-O patterns can expand and repaint quite a bit. To make things easier this indicator implements a twist: it waits for a donchian breakout in the right direction before signaling the trade. The end result is an otherwise repainting indicator with a very reliable trading signal. The donchian breakout period is entered as an input. [ Installation Guide | Update Guide | Troubleshooting | FAQ | A
FREE
AIS MT4 INDICATOR 5 ALL INCLLUSIVE SET !!!!!!!!!!!!!!!!!!!!!!!!!!!!!!!!!!!!!!!!!!!!!!!!!!!!!!!!!!! ! ! ATTENTION ! LIMITATION OF FREE OFFER PERIOD IS IMPLICIT ! !   ! CONFIRMATION 2024-08-20 20:00                           ! ! !!!!!!!!!!!!!!!!!!!!!!!!!!!!!!!!!!!!!!!!!!!!!!!!!!!!!!!!!!! GUIDE CHAPTER 1 IMPORTANT INFORMATION <1> THIS INDICATOR IS ONE OF THE SERIES OF NEW AIS INDICATORS AIS MT4 INDICATOR 1 =ADVANCED CLASSIC= AIS MT4 INDICATOR 2 =MULTIFRAMES= AIS MT4 INDICATOR 3 =LINES= AIS M
FREE
Индикатор, который ищет качественные точки входа в рынок и отображает их в виде стрелок. Действует по сложному алгоритму. Сначала ищет на графике специальные уровни, которые обязательно должны быть пробиты импульсом. Если цена возвращается к этому уровню в виде свечи с длинной тенью и маленьким телом и касается уровня только тенью - возникает точка входа.  Не перерисовывается!  Лучше всего выглядит и отрабатывает на Н1.    Может использоваться как: Индикатор уровней, где цена будет останавливат
FREE
Lisek Levels and Channels Indicator
Darius Hans Lischka
4.8 (20)
准备好成为外汇交易的夏洛克·福尔摩斯了吗?️‍️ 介绍终极交易工具: Lisek Levels and Channels 指标!!! 忘掉像马戏团表演一样玩多个指标的杂耍吧。我们把你需要的一切都打包成一场精彩的表演: 价格水平?搞定! 价格通道?你说对了! 价格VWAP?没错! 平衡交易量?都在这里! 还有最棒的是什么?警报和推送通知,它们会比双倍浓缩咖啡更快地唤醒你!️ 你的图表即将成为交易机会的藏宝图: 看看当前价格在哪里,还有所有酷炫的水平线、通道和VWAP。 评估平衡交易量 - 它在跳熊市之舞还是牛市探戈?看看谁占上风:买家还是卖家。 上下指向的箭头像外汇狂欢派对?那显示的是买家或卖家不断增长的交易量。 像井字游戏一样交叉你图表的线条?那些是你的水平线和通道,朋友。 但是等等,还有更多! 认识 Glimpz ,你进入大玩家游戏的VIP通行证。为什么要与鲸鱼对抗,当你可以和它们一起游泳?来自 glimpz.net 的 Glimpz 让你窥探市场大亨的策略。这就像拥有一个交易水晶球,不过不用穿占卜师的服装。 交易风格?我们的花样比高级冰淇淋店还多: 在
FREE
Smart RSI MT4
Mostafa Saad Saeed Shawara
产品标题 Smart RSI (MT4) – SmartView 系列的一部分 简短描述 具有独特用户体验的 RSI 指标,在 MetaTrader 平台上提供。提供以前不可用的高级功能,例如双击打开设置、隐藏和显示指标而无需删除它们,以及以全图表大小显示指标窗口。设计用于与 SmartView 指标系列的其余部分无缝协作。 概述 SmartView 系列通过创新功能为 MetaTrader 平台上的指标提供独特且与众不同的用户体验,使指标管理更快、更轻松。每个指标都配备了图表上的智能控制面板,显示基本信息并提供对所有重要功能的快速访问。 以前不可用的独特功能 SmartView 系列提供使指标工作更简单、更快速的高级功能: 双击打开设置: 无需在指标列表中搜索,双击面板上的指标名称即可直接打开设置窗口。 隐藏和显示指标: 一键隐藏和显示指标,无需从指标列表中删除和重新添加它们。 以全图表大小显示指标窗口: 在子窗口中,您可以最大化指标窗口以全图表大小显示,并临时隐藏其他窗口。 折叠和展开子窗口: 折叠子窗口以减少其高度并节省屏幕空间,然后在需要时将其展开回全尺寸。 重新排列子窗口:
FREE
Extremum Reverse Bar
Yurij Izyumov
2.8 (5)
This indicator has been created for finding the probable reversal points of the symbol price. A small candlestick reversal pattern is used it its operation in conjunction with a filter of extremums. The indicator is not redrawn! If the extremum filter is disabled, the indicator shows all points that have a pattern. If the extremum filter is enabled, the condition works – if the history Previous bars 1 candles back contains higher candles and they are farther than the Previous bars 2 candle, such
FREE
TreendLines
Sajjad Karimi
5 (1)
''Trendlines'' is an Indicator, that every Trader need and shows Trendline and  Support and resistance levels in all  Timeframe's. Also In 1-hour, 4-hour and daily time frames and Current timeframes, support, and resistance levels are specified and trend lines are drawn so that the trader can see all levels on a chart.   In   Properties   it is possible to turn off unnecessary Lines.  In ' Tendency indicator '' , as full package of Predictions that every Trader need, there  is also the Predict
FREE
Support and resistance levels
Alexandr Bryzgalov
4.29 (17)
The indicator displays the probable ( Support and resistance ) levels. The indicator draws horizontal and trend levels of support and resistance. The indicator settings: Trends - the mode for displaying trend lines or horizontal lines of support and resistance Yes - display trend lines only No - display horizontal lines only UseResource - use the resources built into the indicator. Yes - use the ZigZag indicator from the resources of the product. No - use a custom ZigZag indicator. HistoryBar -
FREE
This indicator shows the latest untouched support and resistance as horizontal lines. The indicator can show support/resistance from higher timeframes. With this indicator you can e.g. easily see the support/resistance of the timeframes H4, D1 and W1 on a H1 chart, which can be a big advantage while time your entry on H1. This is the FREE version of the indicator: Support Resistance Multi Time Frame The free version works only on EURUSD and GBPUSD! Parameters referenceTF: the timeframe from whi
FREE
PZ Inside Bars
PZ TRADING SLU
4.2 (5)
Enhance your price action strategy: inside bar breakouts at your fingertips This indicator detects inside bars of several ranges, making it very easy for price action traders to spot and act on inside bar breakouts. [ Installation Guide | Update Guide | Troubleshooting | FAQ | All Products  |  Get Help ] Easy to use and understand Customizable color selections The indicator implements visual/mail/push/sound alerts The indicator does not repaint or backpaint An inside bar is a bar or series of
FREE
WPR Breakout MT4
Mohamed Hassan Mohamed Hassan Alsherbiny
When prices breakout resistance levels are combined with   Larry Williams' Percentage Range "WPR"   oscillator breaks out its historical resistance levels then probability emerges to record farther prices.   It's strongly encouraged to confirm price breakout with oscillator breakout since they have comparable effects to price breaking support and resistance levels; surely, short trades will have the same perception. Concept is based on find swing levels which based on number of bars by each side
FREE
Aroon Classic
Etsushi Ishizuka
Aroon Classic 指标概述 Aroon Classic 指标是一种技术工具,可定量识别图表上趋势的出现和持续性。它使用两条线——“Aroon Up”和“Aroon Down”——在 0–100 范围内显示趋势强度和转折点。Aroon Up 值越高,表示上升趋势越强;Aroon Down 值越高,表示下降趋势越强。 主要特点 直观区分趋势的形成和反转 可自定义计算周期(默认:14) 灵活设置线条颜色、宽度和样式 指标参数 参数 说明 默认值 Period 用于 Aroon 计算的周期条数 14 Aroon Up Color Aroon Up 线的颜色 DodgerBlue Aroon Down Color Aroon Down 线的颜色 Tomato Line Width 线条宽度(像素) 2 计算方法 Aroon Up 根据指定周期内自最高点以来的条数计算,公式如下: Aroon Up = ((Period – BarsSinceHighestHigh) / Period) × 100 同理,Aroon Down 根据自最低点以来的条数计算: Aroon Down = ((P
FREE
HMA Trend
Pavel Zamoshnikov
4.55 (71)
A trend indicator based on the Hull Moving Average (HMA) with two periods. The Hull Moving Average is an improved variant of the moving average, which shows the moment of trend reversal quite accurately. It is often used as a signal filter. Combination of two types of Hull Moving Averages makes a better use of these advantages: HMA with a slow period identifies the trend, while HMA with a fast period determines the short-term movements and signals in the trend direction. Features The movement d
FREE
FlatBreakout
Aleksei Vorontsov
FlatBreakout (Free Version) Flat Range Detector and Breakout Panel for MT4 — GBPUSD Only FlatBreakout is the free version of the professional FlatBreakoutPro indicator, specially designed for flat (range) detection and breakout signals on the GBPUSD pair only. Perfect for traders who want to experience the unique fractal logic of FlatBreakout and test breakout signals on a live market without limitations. Who Is This Product For? For traders who prefer to trade breakout of flat ranges (breakout,
FREE
Mr Beast Sniper
Luis Mariano Vazquez Marcos
5 (1)
Asesor Experto "Sniper FX": Precisión Milimétrica para Tus Operaciones El asesor experto "Sniper FX" redefine la precisión en el trading automatizado al ofrecer un enfoque estratégico centrado en pocas, pero extraordinariamente precisas, entradas en el mercado. Inspirado por la agudeza de un francotirador, este asesor experto utiliza algoritmos avanzados para identificar oportunidades óptimas de compra y venta, maximizando el potencial de beneficios mientras minimiza la exposición al mercado.
FREE
Double HMA lines MTF
Pavel Zamoshnikov
5 (1)
This is a multi-timeframe version of the popular Hull Moving Average (HMA). The Double HMA MTF Light indicator combines two timeframes on a single chart. The HMA of the higher timeframe defines the trend, and the HMA of the current timeframe defines short-term price movements. The indicator is freely distributed and hasn't audio signals or messages. Its main function is the visualization of price movements. If you need advanced functionality of the HMA multi-timeframe indicator (information ab
FREE
PZ Pivot Points
PZ TRADING SLU
4.6 (10)
This indicator displays pivot points in the chart, including historical vales, and supports many calculation modes for Pivot Points and S/R levels. [ Installation Guide | Update Guide | Troubleshooting | FAQ | All Products  |  Get Help ] It plots historical levels for backtesting purposes It allows you to select the reference timeframe It implements different Pivot Point calculation modes It implements different SR calculation modes It implements customizable colors and sizes Calculation Mode
FREE
Velvet RVI
Kevin Peter Abate
Velvet RVI is intended for use with the Velvet advanced ordering layer.  It is based on the algorithm for the Relative Vigor Index, provided by Investopedia here . All of the data it displays is accurate and verified against the internal API function iRVI, when it is detected by the ordering layer.  In order to place orders with the Velvet RVI indicator, the ordering layer must be installed and running.  Ordering from the Velvet RVI indicator requires that "Velvet Ordering Layer" ( found here ),
FREE
Candle Countdown — MT4 精确K线倒计时 Candle Countdown 是一个简单且精确的工具,可在图表上显示 当前K线剩余时间 。 当交易入场依赖K线收盘时,即使几秒钟也非常关键。 该指标帮助您看到准确时间,从而在无需猜测或仓促决策的情况下进行交易。 用于精确控制K线收盘时间的工具。 指标显示内容: 当前K线剩余时间 服务器当前时间 点差(Spread) 止损最小距离(Stop Level) 该计时器独立于行情跳动(tick),通过平台内部定时器更新,即使在市场波动较低时也能保持稳定显示。 在低波动环境下依然可以获得平滑且稳定的倒计时效果。 所有信息显示在带背景的区域中,在任何图表配色下都清晰可见,并且不会影响图表分析。 随着K线接近收盘,计时器颜色会发生变化,帮助您快速判断当前状态。 提供 MT5 版本: Candle Countdown MT5 实际应用 使用该计时器可以提高入场时机和交易控制: 等待信号K线收盘 在新K线开始时同步入场 避免过早决策 指标可自然融入图表界面,不影响分析 : 不影响图表对象 切换周期时保持稳定 不会增加终端负担 计划更
FREE
Basic Harmonic Pattern
Mehran Sepah Mansoor
4.58 (59)
该指标可识别预测市场反转点的最常用谐波形态。这些谐波形态是外汇市场上不断重复出现的价格形态,暗示着未来可能的价格走势/ 免费 MT5 版本 此外,该指标还内置了市场进入信号以及各种止盈和止损。需要注意的是,虽然谐波形态指标本身可以提供买入/卖出信号,但建议您使用其他技术指标来确认这些信号。例如,在进行买入/卖出之前,您可以考虑使用 RSI 或 MACD 等震荡指标来确认趋势方向和动能强度。 该指标的仪表盘扫描器:( Basic Harmonic Patterns Dashboard ) 包括的谐波形态 加特里 蝶形 蝙蝠型 螃蟹 鲨鱼 赛弗 ABCD 主要输入 Max allowed deviation (%): 该参数是指谐波图形形成时的允许偏差。该参数决定了谐波图样的结构可以变化多少,而指标不会将其视为有效图样。因此,如果设置的百分比越高,则模式识别的灵活性就越大,而如果设置的值越低,则限制性就越大。例如:如果设定值为 30%,那么指标将把当前价格 ±30% 范围内符合形态比例的形态视为有效形态。 Depth: 该参数决定了谐波形态的每个波浪中必须出现的最少条数,也就
FREE
Power Trend Free
Yurij Kozhevnikov
5 (2)
Power Trend Free - the indicator shows the trend strength in the selected period. Input Parameters The indicator has three input parameters: Period - a positive number greater than one, it shows the number of candlesticks used for calculations. If you enter one or zero, there will be no error, but the indicator will not be drawn. Applied Price - the standard "Apply to:" set meaning data used for the indicator calculation: Close - Close prices; Open - Open prices; High - High prices; Low - Low p
FREE
该产品的买家也购买
Gann Made Easy
Oleg Rodin
4.83 (162)
Gann Made Easy 是一个专业且易于使用的外汇交易系统,它基于使用先生理论的最佳交易原则。 W.D.江恩。该指标提供准确的买入和卖出信号,包括止损和获利水平。您甚至可以使用推送通知在旅途中进行交易。 购买后请联系我,即可免费获得交易指导和超棒的额外指标! 您可能已经多次听说过江恩交易方法。通常 Gann 的理论不仅对于新手交易者而且对于那些已经有一定交易经验的人来说都是非常复杂的东西。这是因为江恩的交易方法在理论上并不那么容易应用。我花了几年时间来完善这些知识,并将最好的原则应用到我的外汇指标中。 该指标非常易于应用。您所需要的只是将其附加到您的图表并遵循简单的交易建议。该指标不断进行市场分析工作并寻找交易机会。当它检测到一个好的入口点时,它会为您提供一个箭头信号。该指标还显示止损和获利水平。 换句话说,当您像先生一样进行交易时,该指标会为您提供最佳江恩建议。江恩亲自告诉你此时此刻该做什么。但最好的部分是您不需要了解任何有关江恩交易原则的知识,因为该指标会为您完成整个市场分析工作。
M1 Sniper
Oleg Rodin
5 (22)
M1 SNIPER 是一款易于使用的交易指标系统。它是一个专为 M1 时间框架设计的箭头指标。该指标可以作为独立的系统在 M1 时间框架下进行剥头皮交易,也可以作为您现有交易系统的一部分使用。虽然该交易系统专为 M1 时间框架交易而设计,但它也可以用于其他时间框架。我最初设计此方法是为了交易 XAUUSD 和 BTCUSD。但我发现这种方法在其他市场交易中也同样有用。 指标信号既可以顺势交易,也可以逆势交易。我教授一种特殊的交易技巧,帮助您利用指标信号进行双向交易。该方法基于使用特殊的动态支撑位和阻力位区域。 购买后,您可以立即下载 M1 SNIPER 箭头指标。此外,我还为所有 M1 SNIPER 工具用户免费提供下方屏幕截图所示的 Apollo Dynamic SR 指标!这两个指标的组合可以帮助您更轻松、更准确地利用 M1 时间框架进行交易。 购买后请联系我,免费获取交易提示和奖励指标! 祝您交易成功!
Scalper Inside PRO
Alexey Minkov
4.74 (69)
Scalper Inside PRO – Since 2020. An exclusive indicator that utilizes an innovative algorithm to swiftly and accurately determine the market trend. The indicator automatically calculates opening, closing, and profit levels, providing detailed trading statistics. With these features, you can choose the most appropriate trading instrument for the current market conditions. Additionally, you can easily integrate your own arrow indicators into Scalper Inside Pro to quickly evaluate their statistics
PRO Renko System
Oleg Rodin
5 (30)
PRO Renko Arrow Based System for trading renko charts.  准确的信号交易任何外汇工具. 另外,我将免费提供系统的附加模块! PRO Renko系统是RENKO图表上高度准确的交易系统。该系统是通用的。 该交易系统可应用于各种交易工具。 该系统有效地中和了所谓的市场噪音,打开了获得准确反转信号的通道。 该指标易于使用,只有一个参数负责产生信号。 您可以很容易地使算法适应您感兴趣的交易工具和renko酒吧的大小。 我很乐意通过提供任何咨询支持来帮助所有客户有效地使用该指标。 祝您交易成功!购买后,立即写信给我! 我将与您分享我的建议和我的renko发电机。 另外,我将免费提供系统的附加模块!
Auto Optimized Parabolic RSI: 高级 3D 动量引擎 大多数零售指标之所以失效,是因为它们依赖于静态输入,一旦市场波动率发生变化,这些输入就会崩溃。Auto Optimized Parabolic RSI 通过不断重新计算自身的数学优势,解决了“指标衰退”的问题,将机构级别的量化自适应能力直接引入您的 MT5 终端。 核心优势:定制的内存 3D 优化   标准的自动优化器通常会导致 MT5 平台卡顿,因为它们通过标准的指标调用使终端超载。该工具完全绕过了这些性能瓶颈。内部引擎采用定制的原生基于 RAM 的计算器构建,每次加载图表或更改时间周期时,它都会执行极速的 3D 网格搜索。它同时扫描 RSI 周期(频率)、SAR 步长(加速度)和 SAR 最大值(速度限制),在绝对的毫秒级时间内测试数以万计的参数组合,且完全不会拖慢您的平台。它不是仅仅寻找一个“不错”的设置,而是映射整个参数空间,以寻找资产当前动量结构的绝对全局最大值。 严格的财务评分与逼真的交易模拟   与基于抽象“指标点数”进行优化评分的业余工具不同,该引擎的 3.10 版本严格与资金数学挂钩。每
Quantum Breakout Indicator PRO
Bogdan Ion Puscasu
4.96 (26)
介绍     Quantum Breakout PRO   ,突破性的 MQL5 指标,正在改变您交易突破区域的方式!   Quantum Breakout PRO 由拥有超过 13 年交易经验的经验丰富的交易者团队开发,旨在通过其创新和动态的突破区域策略将您的交易之旅推向新的高度。 量子突破指标将为您提供带有 5 个利润目标区域的突破区域的信号箭头,以及基于突破框的止损建议。 它既适合新手交易者,也适合专业交易者。 量子 EA 通道:       点击这里 MT5版本:   点击这里 重要的!购买后请私信我领取安装手册。 建议: 时间范围:M15 货币对:GBPJPY、EURJPY、USDJPY、NZDUSD、XAUUSD 账户类型:ECN、Raw 或 Razor,点差极低 经纪商时间:GMT +3 经纪商:IC Markets、Pepperstone with Raw 和 Razor 的点差最低 规格: 不重漆! 最多 5 个建议利润目标区域 建议止损水平 可定制的盒子。您可以设置自己的 Box Time Start 和 Box Time End。 接触 如果您
Market Makers
Mohamed Hassan
5 (4)
After purchase, contact me privately to receive 1 month of free testing with EA Forex Proton! This advanced MT4 trading robot automatically executes signals from any MT4 indicator, including Market Makers. The latest version also includes AI integration, allowing each trade signal to be analyzed using Artificial Intelligence. Live Signal with EA Forex Proton: Click here Market Makers is a powerful price action trading system designed to identify high-probability Buy and Sell opportunities based
购买此指标即可免费获得我的专业交易管理器。 首先,值得强调的是,这个交易系统是一个非重绘、非重画和非滞后的指标,这使得它非常适合手动和机器人交易。 在线课程,手册和下载预设。 “智能趋势交易系统 MT5”是专为新手和经验丰富的交易者量身定制的综合交易解决方案。它结合了超过 10 个优质指标,具有 7 多个强大的交易策略,使其成为适用于各种市场条件的多功能选择。 趋势跟随策略:提供精确的入场和止损管理,以有效地跟随趋势。 反转策略:识别潜在的趋势反转,使交易者能够利用区域市场的机会。 剃头策略:专为快速准确的日内交易和短期交易而设计。 稳定性:所有指标都不会重绘、不会重画和不会滞后,确保可靠的信号。 定制:支持自定义策略,以满足个人交易偏好。超过 7 种策略和组合可帮助您找到最佳策略。 信号清晰度:提供箭头信号,以指示清晰的入场和退出点。 实时警报:通过交易进出警报使交易者保持了解。 深入分析:提供更高时间框架的趋势分析和实时交易监控。 自适应颜色编码:利用蜡烛颜色编码来显示成交量、趋势和反转蜡烛信号。通过蜡烛颜色分析市场方向。 “智能趋势交易系统 MT5”赋予交易者必要的工具,以便在
PZ Harmonacci Patterns
PZ TRADING SLU
3.17 (6)
可以说,这是您可以为MetaTrader平台找到的最完整的谐波价格形成自动识别指标。它检测19种不同的模式,像您一样认真对待斐波那契投影,显示潜在的反转区域(PRZ),并找到合适的止损和获利水平。 [ 安装指南 | 更新指南 | 故障排除 | 常见问题 | 所有产品 ] 它检测19种不同的谐波价格形态 它绘制了主要,衍生和互补的斐波那契投影(PRZ) 它评估过去的价格走势并显示每个过去的形态 该指标分析其自身的质量和性能 它显示合适的止损和获利水平 它使用突破来表明合适的交易 它在图表上绘制所有样式比率 它实现了电子邮件/声音/视觉警报 受斯科特·M·卡尼(Scott M. Carney)的书的启发,该指标旨在满足最纯粹和最熟练的交易者的需求。但是,它采取了一种使交易更容易的方式:在向交易发出信号之前,它会等待Donchian朝正确方向突破,从而使交易信号非常可靠。 斐波那契投影与向量无关 它实现了电子邮件/声音/推送警报 它绘制了ABCD投影 重要提示: 为了符合 Scott M. Carney先生 的商标申诉,某些图案名称已重命名为不言自明的替代方式, Scott M.
Please send me Direct message on MQL5 CHAT after purchasing the Indicator for Training and Installation Support There are some additional files that is important to use with the Indicator . So be sure to contact me after purchasing the Indicator So that I can add you for training and support . If you find any difficulty with installation then send me Direct message here So that I can connect with you via Anydesk or Teamview for the product installation. " Smart Order Block Indicator " to find m
GoldRush Trend Arrow Signal
Kirk Lee Holloway
5 (2)
GoldRush 趨勢箭頭信號 GoldRush 趨勢箭頭信號 指標為 XAU/USD 中的高速、短期短線交易者提供精確、實時的趨勢分析。 專為1分鐘時間框架設計,此工具顯示方向箭頭以明確顯示入場點,使短線交易者能在波動市場中自信操作。 該指標包含主要和次要警示箭頭。主要信號為白色和黑色方向箭頭,用於指示趨勢方向的轉變;次要信號為藍色和紅色箭頭,用於確認主要箭頭指示的方向並提示潛在交易入場點。 注意:當趨勢方向發生變化後僅出現一個主要警報箭頭時,請注意可能會出現多個次要藍/紅箭頭。次要信號將在滿足信號標準的任何蠟燭圖後出現,因此在長期趨勢移動中,螢幕上將顯示大量次要箭頭(如附帶的截圖所示)。您可在設置中開啟或關閉任一箭頭類型。 以下是我使用此指標進行交易的方式: - 對於買入入場,我會耐心等待白箭頭在蠟燭收盤時出現,並在下一根可用蠟燭收盤時出現藍箭頭時進行買入交易。 - 對於賣出入場,我會耐心等待黑箭頭在蠟燭收盤時出現,並在下一根可用蠟燭收盤時出現紅箭頭時進行賣出交易。 - 獲利了結/止損設置由使用者自行負責,但我個人使用最低R:R為1:2,並發現這在倫敦/紐約開盤等
Day Trader Master
Oleg Rodin
5 (15)
Day Trader Master 是一个完整的日间交易者交易系统。该系统由两个指标组成。一个指标是买入和卖出的箭头信号。这是你得到的箭头指示器。我将免费为您提供第二个指标。第二个指标是专门设计用于与这些箭头结合使用的趋势指标。 指标不重复也不迟到! 使用这个系统非常简单。您只需按照当前趋势方向的箭头信号,显示为双色线。蓝色是买入趋势。红色是一种销售趋势。蓝色箭头是买入信号。红色箭头是卖出信号。您需要箭头的颜色和信号的方向来匹配趋势线的颜色。 箭头指标主要是为 M5 和 M15 时间间隔的日内交易而创建的。但从技术上讲,该系统可以用于其他时间间隔。 指示器配备带有推送消息功能的弹出警报。 购买后一定要写信给我!我将为您提供与系统交易的个人建议,以及我的趋势指标。此外,还有丰厚的奖励等着您!
Dynamic Scalper System
Vitalyi Belyh
5 (1)
“ Dynamic Scalper System ”指标专为在趋势波内进行剥头皮交易而设计。 已在主要货币对和黄金上进行测试,并可与其他交易工具兼容。 提供顺势短线建仓信号,并提供额外的价格变动支持。 指标原理: 大箭头决定趋势方向。 在趋势波内,我们采用一种生成小箭头形式的剥头皮交易信号的算法。 红色箭头代表看涨方向,蓝色箭头代表看跌方向。 敏感的价格变动线会沿着趋势方向绘制,并与小箭头信号协同作用。 信号运作方式如下:当线在适当时刻出现时,将形成入场信号;在出现线时,持仓;线完成后,平仓。 建议的操作时间范围为M1 - H4。 箭头在当前K线上方形成,如果下一根K线已开仓,则不会重新绘制上一根K线上方的箭头。 输入参数 Trend Wave Period - 趋势方向(大箭头)的周期,改变趋势波的时间间隔。值 1 表示趋势方向的最长持续时间,参数值越大,持续时间越短。 Scalper Arrows Period - 信号箭头(小箭头)的计算周期,改变入场信号的生成频率。值 3 表示最频繁的生成频率,参数值越大,箭头频率越低,准确度越高。 这些参数可以根据不同的时间范
PZ Trend Trading
PZ TRADING SLU
4.8 (5)
许多盈利交易者不仅知道如何识别市场趋势,而且也能把握趋势建立后的交易机会。 Pz 趋势交易 指标设计用来在趋势行情中尽可能的赚取利润。 已建立的趋势提供了一揽子交易机会,但大多数趋势交易指标完全忽视了它们,让交易者在趋势行情时完全不知道该如何做!一般趋势指标只通知有关的趋势变化,但根本不足以得到卓越的回报. Pz 趋势交易 指标比一般趋势指标显示多达 20 倍的交易 , 因为它注重所谓的市场时机。它不仅显示当前的市场趋势,也有回调,内柱线的突破和调整。它令您在趋势回调之后介入,安全的柱线内突破金字塔加仓,以及发现潜在的反转,和已知的调整。 趋势改变 一个趋势改变在市场方向变化时发生。趋势变化在图表上用带数字的彩色圆圈显示。蓝色 (1) 信号为上涨开始, 而红色 (1) 信号为下跌开始。趋势变化并非评估当前价格动作的结果, 它意味着交易设置是不定时地。如果您正确使用本指标, 在趋势变化时, 您将将已经入场 (参看下面的调整)。 回调 但凡趋势在运动中,行情上下抖动,盈利者收割利润,且其它参与者入场。趋势回调代表好的买入机会,通常是由主力获利离场导致。如果行情在回调后回归上行, 指标将
GOLD Impulse with Alert
Bernhard Schweigert
4.67 (12)
这个指标是我们2个产品 Advanced Currency IMPULSE with ALERT  +   Currency Strength Exotics 的一个超级组合。 它适用于所有时间框架,并以图形方式显示8种主要货币和一种符号的强势或弱势冲动! 该指标专门用于显示任何符号的货币强度加速,如黄金、异国货币对、商品、指数或期货。这是它的第一个指标,任何符号都可以被添加到第9行,以显示黄金、白银、石油、DAX、US30、MXN、TRY、CNH等的真实货币强度加速(冲动或速度)。 建立在新的基础算法上,它使识别和确认潜在的交易更加容易。这是因为它以图形方式显示了一种货币的强势或弱势是否正在加速,并测量了这种加速的速度--把它想象成你汽车中的速度表。当你加速时,事情显然会发生得更快,这在外汇市场上也是一样的,即如果你配对的货币正在向相反的方向加速,你就会发现一个潜在的有利可图的交易。 动态市场斐波那契28水平被用作警报触发器,将适应市场活动。如果冲动击中黄色触发线,你将收到警报。然后你就知道作为一个交易员应该做什么。货币对和方向已经给出。只需点击警报按钮,就可以切换到该货
Advanced Supply Demand
Bernhard Schweigert
4.91 (300)
现在优惠 40%! 任何新手或专业交易者的最佳解决方案! 该指标是一款独特、高质量、且价格合理的交易工具,因为我们已经整合了许多专有功能和新公式。 依据此更新,您将能够显示双重时间帧区域。 您不仅可以显示一个较高的时间帧,还可以同时显示图表时间帧,加上更高的时间帧:显示嵌套时区。 供需双方所有交易者都会喜欢它。 :) 重要信息披露 高级供需的最大潜力,请访问 https://www.mql5.com/zh/blogs/post/720245   想象您的交易如何得以改善,是因为您能够精准定位入场或目标位吗? 构建于新的底层算法,它可以更轻松地识别出买卖双方之间的潜在失衡。 这是因为它以图形方式展示供需最强劲区域,及其过去的表现(显示旧区域)。 这些功能旨在帮助您更轻松地发现最佳入场区域和价位。 现在您可以针对您的交易品种和时间帧来优化和编辑区域强度! 高级供需指标适用于所有产品和时间帧。 它是一个新的公式,非常新的功能是两个区域强度函数可由用户输入进行调整! 这在交易中是一大优势。 当您学习如何使用专有功能,例如带有价格游离最小 X 因子的区域强度时,您能够判断该区域强劲与否。 供需
CRT Candle Range Theory HTF MT4.   Ultimate CRT Indicator: Advanced ICT Concepts and Malaysian SnR Trading System Discounted   Price   $50  !!     Secure your lifetime access   now   before it switches to   subscription-only ! Master the Market Maker's Footprints with the Most Advanced Candle Range Theory Indicator Unlock the true power of   Smart Money Concepts (SMC)   and trade precisely like the institutions with the   Ultimate CRT Indicator . Built exclusively for serious traders, this indic
PZ Turning Points MT4
PZ TRADING SLU
1 (1)
该指标检查不同时期分形的价格结构,以确定市场中可能的反转点,从而为已经具有基本或技术估值模型的仓位交易者提供时机。与它的弟弟 Reversal Fractals不同 ,该指标不会因为所选时期而错过反转,并且会以之字形方式找到反转分形,而忽略那些没有足够动量来引发持续价格波动的反转。 [ 安装指南 | 更新指南 | 故障排除 | 常见问题 | 所有产品 ] 转折点可以开始长期趋势 指示器不重涂 它实现了各种警报 可自定义的颜色和尺寸 该指示符是无功或滞后信号,因为分形是奇数个条形的地层,是中间地带中最高或最低的条形,并且指示符在分形中的所有条形都闭合时绘制。但是,具有预先设定的方向偏差的交易者会发现该指标非常有用,可以提早进入切入点。 该指标既不是下探信号指标,也不是完整的交易系统。请不要这样评价或审查它。 输入参数 最小分形数:分形上的最小条形数。必须为奇数,例如3、5、7、9、11、13,... 最大分形:分形上的最大条形数量。必须为奇数,例如3、5、7、9、11、13 ... 最大历史柱数:指标加载时评估的过去柱数。 颜色:自定义箭头和线条的颜色和大小。 警报:启用或禁用各
PZ Support Resistance
PZ TRADING SLU
3.33 (3)
厌倦了绘制支撑线和阻力线? 支撑阻力 是一个多时间指标,可以自动检测并绘制图表中的支撑线和阻力线,并具有非常有趣的变化:随着时间的推移测试价格水平及其重要性的提高,线变得越来越粗。 [ 安装指南 | 更新指南 | 故障排除 | 常见问题 | 所有产品 ] 一夜之间增强您的技术分析 无需浏览图表即可检测重要的价格水平 一目了然地识别所有价格水平的相对优势 每次交易最多可节省半小时的绘图线 指标显示所有价格水平的期限 指示器不重涂 过去和现在的价格水平因接近程度而崩溃,并根据当前的市场行为进行了调整。在动作发生的地方绘制了线条,而不一定在峰值处绘制了线条。 价格水平随着时间的推移而被拒绝,变得越来越暗 定期清除不重要的价格水平以避免噪音 可自定义的时间范围选择和崩溃因子 它实现了电子邮件/声音/推送警报的突破 输入参数 指标设置:指标将从当前时间段读取价格,但您可以选择另一个。例如,您可以在H4图表中显示D1支撑线和阻力线。您还可以使用 价格水平密度 参数选择在图表上显示多少价格水平。 颜色设置:根据重要性输入所需的支撑线和阻力线颜色。 标签设置:(可选)可以在指示器中显示用于
Apex Break PRO MT4
Kestutis Balciunas
Apex Break PRO 是一款用于 MetaTrader 4 的不重绘枢轴趋势线突破指标。它能识别枢轴高点和枢轴低点,在连续枢轴之间绘制动态斜向趋势线,并在价格于确认K线收盘时突破这些趋势线时生成买入和卖出信号。每个信号通过多达四个独立的共振过滤层进行筛选——EMA趋势、RSI边界、成交量突增检测和ADX趋势强度——并以星级系统进行评分,让交易者立即了解有多少条件同时满足。基于ATR的止损和三个止盈级别为每个信号提供结构化的风险管理,而实时仪表盘则显示方向、过滤器状态以及带有触达标记的交易级别追踪。 MT5版本请访问:  Apex Break PRO MT5 更多产品请访问:   所有产 品 如需查看实时示例和新工具,请访问我的主页并发送好友请求,以免错过任何更新! 工作原理 枢轴趋势线引擎 该指标使用可配置的回溯窗口(默认:左侧20根K线,右侧20根K线)扫描图表中的枢轴高点和枢轴低点。当发现两个或更多连续的枢轴高点时,将在它们之间绘制一条斜向阻力趋势线,并向前延伸最多500根K线。相同的过程从连续枢轴低点创建支撑趋势线。最多可同时显示五条阻力线和五条支撑线,随着新枢轴的形成,
They say history repeats itself. What if you could prove it in real-time? The Propfolio Ghost Pattern is an advanced algorithmic pattern-matching engine. It empowers you to select any current price action structure on your chart and instantly scan thousands of historical candles to find the exact moment in the past where the market did the exact same thing. Once it finds the highest probability match, it projects the historical outcome into the future as "Ghost Candles"—giving you a highly calcu
Atomic Analyst
Issam Kassas
5 (5)
首先值得强调的是,该交易指标是非重绘、非延迟的指标,这使其成为手动和机器人交易的理想选择。 用户手册:设置、输入和策略。 Atomic Analyst是一种PA价格行动指标,利用价格的力量和动量来寻找市场上更好的机会。配备了高级过滤器,可帮助去除噪音和假信号,并提高交易潜力。使用多层复杂的指标,Atomic Analyst扫描图表,并将复杂的数学计算转化为任何初学者都能理解并用来做出一致交易决策的简单信号和颜色。 “Atomic Analyst”是专为新手和经验丰富的交易者量身定制的综合交易解决方案。它将高级指标和一流功能融合为一体的交易策略,使其成为所有类型交易者的多功能选择。 日内交易和剥头皮策略:专为快速准确的日内交易和短期交易而设计。 日内和摆动交易策略:可用作追求价格大幅波动的日内和摆动交易者的可靠工具。 多货币和市场:凭借其可靠的精度,在不同的工具和市场上运作。 多个时间框架:可在多个时间框架上使用,性能良好。 稳定性:所有指标均不重绘、不重绘和不滞后,确保可靠的信号。 信号清晰度:提供箭头信号,用于清晰的入场和出场点。 实时警报:通过交易入场、SL和TP警报通知交易者
目前有26%的折扣!! 这个指标是我们两个主要指标( Advanced Currency Strength 28   &  Advanced Currency IMPULSE with ALERT )的一个超级组合。它显示了28个外汇对的TICK-UNITS货币强度值和警报信号。可以使用11种不同的Tick-Units。它们是1、2、3、4、5、6、10、12、15、20和30秒。子窗口中的Tick-Unit栏将被显示并向左移动,当在一秒钟的定时器中至少有一个Tick。 只用一个图表,你就可以剥28个外汇货币对的头皮!想象一下,你的剥头皮将如何提高。想象一下,你的剥头皮将如何改善,因为你能够准确地确定剥头皮机会的触发点? 这是市场上第一个在比1分钟更短的时间内工作的货币强度指标! 它是为那些希望快速进出并从市场中切出小点数的快速剥头皮者准备的。 用户手册:点击这里 https://www.mql5.com/en/blogs/post/727178 特点。 为28个货币对提供嘀嗒单位的卖出/买入警报,有一个按钮可以快速打开目标图表。 在3种敏感模式中选择一种(慢-中-快
KURAMA GOLD SIGNAL PRO(MT4版)— 7层过滤器、自动TP/SL、品质评分搭载 XAUUSD完整交易系统 不重绘。不重画。不延迟。每个信号永久固定。所见即所得。 福利:购买买断版许可证可免费获得 AI Zone Radar(价值$59)+ 完整PDF手册。购买后请给我发消息。 AI Zone Radar: https://www.mql5.com/en/market/product/175834 交易员的信赖:已被活跃的黄金交易员社区使用。因精度和易用性获得赞誉。 你的问题 — 以及解决方案 你知道黄金每天波动$30-50。你知道这里有钱可赚。但是: - 入场过早,价格反向$10后才朝你的方向走 - 每次MA触碰都入场,结果一半都失败 - 没有TP/SL系统,所以持仓太久或离场太早 - 在死寂时段交易,然后想为什么什么都不顺 KURAMA GOLD SIGNAL PRO解决了这一切。不是用一个过滤器,而是七个。 工作原理 — 3步 1. 图表上出现箭头信号 2. 在面板上查看TP价格、SL价格、品质评分、风险回报比 3. 下单并等待 无
购买后请联系我,获取基于此指标的奖励EA。 Self Optimizing Double MA Strategy 是一款专业级别的交易工具,旨在消除参数猜测。它由内置的自动优化引擎驱动,通过在后台模拟数千种参数组合,不断适应不断变化的市场条件,从而保持统计上的优势。 该指标不依赖于静态、过时的设置,而是动态更新其内部逻辑,为当前的时间周期和交易品种寻找最赚钱的配置。 核心功能 内置自动优化:系统会根据您选择的更新频率,定期重新计算快速 MA、慢速 MA 和 RSI 的周期,确保您的设置始终与当前的市场节奏保持一致。 MA 发散过滤器:一项核心的趋势强度指标,仅在移动平均线积极发散时才确认信号的有效性。这可以防止在均线收敛或平缓的盘整市场中产生虚假的入场信号。 时序评分引擎:内部模拟器在图表上绘制任何实时信号之前,会根据您的具体目标(例如最大化利润因子或最小化回撤)对历史信号进行评估。 动态 ATR 区域:根据实时市场波动率,自动计算并在图表上直观地投射出止盈和止损区域。 实时绩效仪表板:直接在您的图表上跟踪并显示实时的系统指标,包括历史胜率、平均回撤以及产生的总点数。 完美支持 EA
Gold Scalper Super
Aleksandr Makarov
5 (2)
Gold Scalper Super is an easy-to-use trading system. The indicator can be used as a standalone scalping system on the M1 time frame, as well as part of your existing trading system. Bonus: when purchasing an indicator, Trend Arrow Super is provided free of charge, write to us after purchase. The indicator 100% does not repaint!!! If a signal appears, it does not disappear! Unlike indicators with redrawing, which lead to the loss of a deposit, because they can show a signal and then remove it.
Advanced Currency Strength28 Indicator
Bernhard Schweigert
4.91 (657)
目前40%的折扣 任何新手或专家交易者的最佳解决方案! 这个指标是一个独特的、高质量的、可负担得起的交易工具,因为我们纳入了一些专有的功能和一个新的公式。只需一个图表,你就可以读出28个外汇对的货币强度!想象一下,你的交易将如何得到改善,因为你的交易是在你的手中进行的。想象一下,你的交易将如何改善,因为你能够准确地确定新趋势或剥头皮机会的触发点? 用户手册:点击这里  https://www.mql5.com/en/blogs/post/697384 这是第一本,原版的! 不要买一个毫无价值的崇拜者的克隆品。 特别的 子窗口中的箭头显示强劲的货币势头GAP将指导你的交易! 当基础货币或报价货币处于超卖/超买区域(外盘斐波那契水平)时,在个人图表的主窗口中出现警告信号。 当货币力量从外围区间回落时,回撤/反转警报。 十字星模式的特别警报 可选择多个时间框架,以快速查看趋势! 货币强度线在所有的时间框架中都非常平稳,当使用较高的时间框架来识别总体趋势,然后使用较短的时间框架来确定精确的入口时,效果非常好。你可以根据自己的意愿选择任何时间框架。每个时间框架都由其自身进行了优化。
Cyclic Impulse
Vitalyi Belyh
构建图表并识别周期性价格变动的技术指标。 可以在任何图表上工作。 几种类型的通知。 图表本身还有额外的箭头。 无需重新绘制历史记录,只需关闭蜡烛即可。 建议使用 M5 及以上的 TF。 易于使用和配置参数。 当使用 2 个具有不同参数的指标时,您可以单独使用它们,而无需其他指标。 有 2 个输入参数 周期性和信号持续时间 这两个参数处理图表结构的处理。 Cyclicity 调节反转周期的变化频率,平滑周期。 Signal duration 为最小数字,检测价格变动中的脉冲,最大长期趋势变动。    ---------------------------------------------------------------------------------------
KuKl
IGOR KIRIANEN
The indicator is built on a non-standard Zig Zag, it draws accumulations after which if the price leaves this zone and a test of this zone occurs, then a sound signal is given and an arrow appears - after the test candle closes.The indicator does not redraw its signals, it is very easy to use, there are only three settings 1- this is the zig zag parameter 2- this is the minimum price exit from the zone 3- this is the maximum price exit from the zone. The lower the parameter for Zig Zag, the more
ZigZag Lines MTF
Taras Slobodyanik
4.38 (13)
多时间框架锯齿形调整浪指标。 它显示支撑/阻力水平线及其突破,并绘制当前的市场目标。 它还可以显示分形指标的线条和其他时期(最多季度)的蜡烛。指标——连接关键低点和高点以显示趋势线。 该指标重新绘制最后一个(当前)点,并且在某些情况下可以更改最后 2-3 个点。 所有线条均绘制为对象(不是指标缓冲区,但有可能接收 EA 的数据) 在 Expert Advisor 中使用时,您可以使用 iCustom 读取 ZigZag 点. 设置 Mode — 根据计算支撑位和阻力位: —  Zig Zag — ZigZag 指标; —  ZigZag Close — 之字折线收盘指标; —  Fractals — 分形指标; —  High-Low of the period — 通过高低水平构建指标。 时间范围在Period参数中指定; —  Candles only — 仅绘制蜡烛; Depth — 如果最后一根蜡烛的偏差小于(或大于)前一根,则 Zigzag 将不会绘制第二个最大值(或最小值)的烛台的最小数量; Deviation — 锯齿形形成局部顶部/底部的两个相邻烛台的最高点/最
作者的更多信息
Extremum by trend
Anton Iudakov
5 (2)
Looking for entry points along the local trend without repaint! Arrows indicate entry points. Based on classic indicators. The indicator is easy to use. Settings Наименование Описание Frequency factor Signal frequency. The less, the more often. This affects the quality. Recommendations Recommended for use on major currency pairs. Timeframe from m5, m15, m30 Subscribe to my telegram channel, where we discuss intraday trading, ideas, indicators, etc., a link in my profile contacts.
FREE
The Day Scalping System
Anton Iudakov
3 (5)
Scalping indicator. It takes into account volatility, price movement in the local interval and the direction of the current trend. Recommended timeframe - M5. Advantages: Low volatility when a signal appears ensures minimal movement against an open position. The indicator does not redraw its signals. There are alert signals. It is a great tool for day trading. Settings: Name Description Period Indicator period Range of each bar in the period (pp.) The maximum size of each candle in the indicato
FREE
Stochastic Arrow
Anton Iudakov
4.5 (4)
The indicator has combined 5 popular strategies. Draws an arrow after confirming a signal for the selected strategy. There are signal alerts. Doesn't redraw its values. I recommend watching my advisor -   Night Zen EA 5 strategies. The main line crosses the signal line. The main line crosses the signal line in the oversold (for buy) / overbought (for sell) zones. The main line enters the oversold (for sell) / overbought (for buy) zones . The main line comes out of the oversold (for buy ) / over
FREE
The indicator is designed for fast scalping. The principle of operation of the indicator is based on the direction of the Moving Average. The period and sensitivity of the Moving Average can be adjusted for yourself in the indicator settings. I recommend watching my advisor -   Night Zen EA Subscribe to my telegram channel, link in my profile contacts. Advantages of the indicator: The free version is full, there are no additional purchases The arrows are not redrawn, the signal comes after co
FREE
The indicator gives buy or sell signals based on the Parabolic SAR indicator, and it also contains strategies with Moving Average. There are alerts and alerts to the mobile terminal and to the mail. Arrows are drawn on the chart after the signal is confirmed. They don't redraw. I recommend watching my advisor -   Night Zen EA To keep up to date with my latest products and ideas, join my telegram channel and subscribe to my profile. The link in my profile contacts - My profile   The indicator in
FREE
The CCI arrows
Anton Iudakov
5 (1)
The indicator is based on the classic CCI indicator. I recommend watching my advisor -   Night Zen EA Doesn't redraw its signals. There are alerts for the incoming signal. It contains 2 strategies: Entry of the CCI line into the overbought zone (for buy trades ) / into the oversold zone (for sell trades ) Exit of the CCI line from the overbought area (for sell trades) / from the oversold area (for buy trades) Settings: Name Setting Description Period Period of the classic CCI indicator Price Ch
FREE
Flat Detector
Anton Iudakov
4 (2)
Advantages: Based on classic indicators - ATR, Moving Average Determines the trend / flat in the market by coloring the histogram with the appropriate color Arrows indicate confirmed signals It is an excellent filter for channel strategies (by extremes) Settings: Наименование Описание настройки Period of Flat Detector Number of bars / candles for analysis Period of EMA Period of EMA (Moving Average) Period of ATR Period of ATR (current timeframe) Coefficient of deviation Coefficient of deviati
FREE
Comfortable MACD
Anton Iudakov
4.75 (4)
Trading with the help of the MACD indicator has become even more convenient. Flexible settings will help you choose what you really need in your trading. Use the strategy that you need - the indicator uses 3 strategies. Download the demo right now! I recommend watching my advisor - Night Zen EA Subscribe to my telegram channel, link in my profile contacts -   my profile See also my other products on mql5.com -   my products Advantages of the indicator: In this indicator, the interpretation of th
FREE
The Crossing
Anton Iudakov
5 (2)
+ 2 bonus strategies! Alerts! I recommend watching my advisor -   Night Zen EA The indicator combines the most popular moving average strategies: Simple moving average crossover. Moving average crossover relative to the position of the slower moving average. 2 bonus strategies : The crossing of the fast moving average with the calculation of the opening prices of the slow moving average with the calculation of the closing prices taking into account the slower moving average. (The settings for th
FREE
MFI arrow
Anton Iudakov
5 (1)
The indicator is completely based on the classic MFI indicator. I recommend watching my advisor -   Night Zen EA It contains two basic trading strategies: The output of the MFI line from overbought/oversold zones. The entry of the MFI line into the overbought/oversold zones. Arrows are drawn after confirming the signal by strategies and are not redrawn. Alerts are also registered: Alerts Push notifications to the mobile terminal email Settings: MFI period - the period of the MFI indicator Lev
FREE
Monitors the current trend, gives signals for an uptrend, downtrend and weakening of the current trend. Colors the situation on the market with the appropriate color. Tool - any. Timeframe - any. Advantages The indicator does not repaint its signals. There are alert signals. Easy to use. Flexible settings. Suitable for trading any financial instruments. Settings Name Description Fast parameter The value of the fast parameter in the indicator (Should be less than the slow one). Slow parameter The
FREE
The indicator is designed for intraday trading. Equipped with all notification functions for convenience in manual trading. It is recommended to use timeframes m5, m15, m30. You can also view and select settings for any financial instrument. Settings: Indicator period - Indicator period Alert - The function of enabling alerts. Push notifications - Enabling Push notifications to the mobile terminal e-mail - Sending a signal to e-mail In addition to this product, I recommend looking at my othe
FREE
The Fresh RSI
Anton Iudakov
3 strategies with RSI! Alerts! Signal freshness check! The indicator is based on the classic RSI. I recommend watching my advisor -   Night Zen EA It includes 3 strategies: Entry of the RSI indicator into the overbought zone (for buy trades) / oversold (for sell trades) Exit of the RSI indicator from the overbought zone   (for sell trades) / oversold (for buy trades) Touching the overbought limit (for sell trades) / oversold (for buy trades) The indicator provides alerts. To enable them in the s
FREE
Defines extremes. This indicator consists of two parts. The first draws lines on the chart indicating low volatility in relative daily market activity. The second is responsible for determining the extremum and gives signals to buy or sell. This system is suitable for all instruments. It is recommended to use a timeframe from m15 to h4. Before using, you need to choose the settings for yourself. Configure lines deviation. Specify volatility coefficient. Advantages The indicator does not repaint
FREE
The indicator shows the current situation on 16 indicators and 10 strategies. Its values are formed based on the evaluation of the specified criteria for each strategy separately. As a result, we can observe on the chart the strength of all the indicators included in it, as well as additional logic. Advantages: Signals do not redraw their values. The arrow is drawn after confirmation. All types of alerts. Shows weak zones based on the evaluation results. The passing value of the score is dete
FREE
This is the author's trading system. Designed for intraday trading. Signals are not rewritten. Suitable for any instrument and timeframe. You can enable alerts. Easy to use. See screenshots. Simple settings! Everything has already been done for you! The basis is the analysis of the current trend. The indicator is looking for a way out of accumulation. If you have been looking for a good trading system for a long time, then it is in front of you! Subscribe to my telegram channel, where we discus
FREE
The indicator is based on the Stochastic indicator. I also recommend to see my EA   Night Zen Strategy: It contains a strategy for crossing the K and D lines in the overbought (for sales) and oversold (for purchases) zones. The indicator gives a signal at the second intersection. The signals are not rewritten, they appear after confirming the intersection of the K and D lines. Settings: Stochastic Indicator Settings Indicator period Notification and Alert Settings
FREE
RVI Arrows
Anton Iudakov
The indicator displays signals on the chart of the classic RVI indicator with an alert. The indicator signals after confirmation of the strategy at the opening of a new bar. I recommend watching my advisor -   Night Zen EA In the settings, you can select the following strategies: The main line crosses the signal line The main line crosses the zero level In the settings, you can change the period of the classic RVI indicator. I also recommend to look at my other developments in the market: ht
FREE
The Cascade EA
Anton Iudakov
Multicurrency EA . Uses Stop-Loss and Take-Profit. Trades from local levels. There are restrictions on trading - by the level of drawdown, slippage and spread. Risk management. With each unsuccessful trade, the robot increases the lot in order to cover the loss from the previous Stop-Loss and profit from the past potential Take-Profit. After the first unsuccessful trade, the robot opens another one in the same direction. If the number of unsuccessful trades in a row is more than 2, the robot lo
Night Zen
Anton Iudakov
A multi-currency scalping robot at night. In the second version, only EURCHF is traded. Signal version 1.0 (Multiplier = 1) Night Zen - the night scalper uses low-volatility areas on the chart to search for a potential price reversal. The Expert Advisor enters the market with only one transaction if all conditions are met. To protect trades, the EA sets a fixed Stop Loss. The adviser can close a deal both on Take Profit and on the strategy embedded in it. The Expert Advisor trades on the m15 tim
Multicurrency indicator in table format. Signals appear with confirmation, no repaints. Works on the current (open) timeframe. Notifications come for an open instrument. In the indicator settings, you can choose 1 of 4 Moving Average strategies. Strategies (represented in screenshots): Classic fast and slow moving average crossover Reverse signal of classic crossing (used for flat/sideways movement) Classic crossover relative to a slower moving average (Trend MA in settings) Price touching the f
Multicurrency indicator in table format. Signals appear with confirmation, no repaints. In the settings, you can select the number of candles/bars on which the signal will still be displayed so that the trader takes it into account and does not miss it. The indicator works on the current (open) timeframe. Notifications come for an open instrument. In the indicator settings, you can choose 1 of 4 Stochastic strategies Strategies (represented in screenshots): The main line crosses the signal line
Multicurrency indicator in table format. Signals appear with confirmation, do not redraw. The indicator works on the current (open) timeframe. Notifications come for an open instrument. The strategy includes: price touching the moving average in the direction of the trend, as well as an extraordinary recalculation of the classic ADX indicator to determine the trend as an additional filtering of entries. Entries are displayed on the chart as arrows and, as mentioned above, the arrows are not redr
Multicurrency indicator in table format. Signals appear with confirmation, no repaints. Works on the current (open) timeframe. Notifications come for an open instrument. In the indicator settings, you can choose 1 of 4 Moving Average strategies. Strategies (represented in screenshots): Classic fast and slow moving average crossover Reverse signal of classic crossing (used for flat/sideways movement) Classic crossover relative to a slower moving average (Trend MA in settings) Price touching the f
筛选:
lauro1956
5752
lauro1956 2022.02.22 11:30 
 

fast operations

回复评论