Zero based Spread Oscillator
- 指标
- 版本: 1.0
- 激活: 5

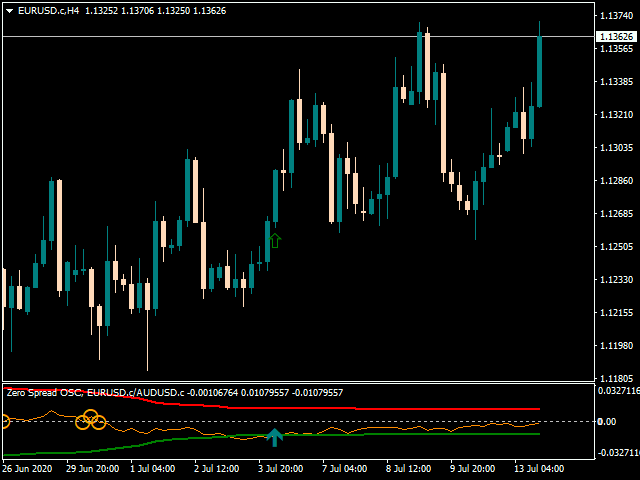
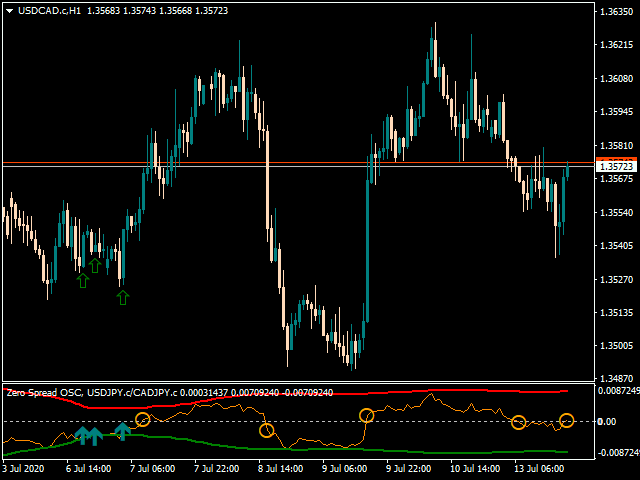
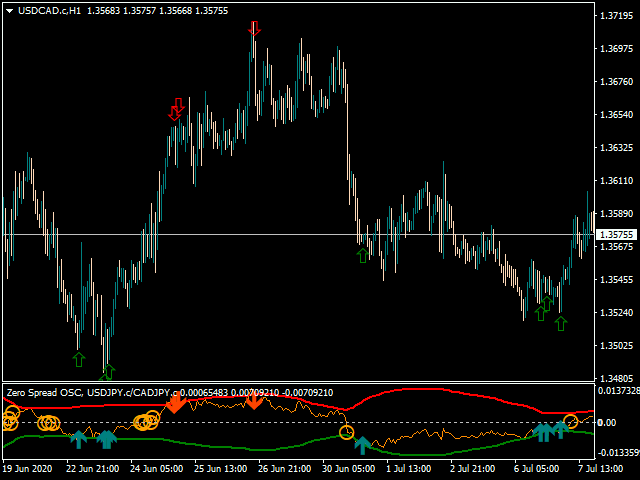
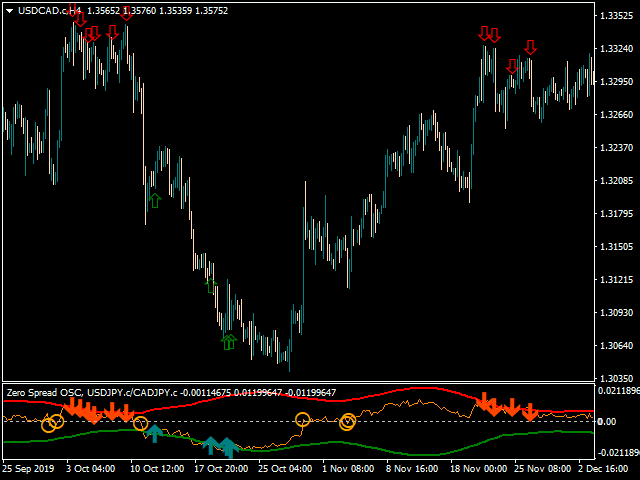
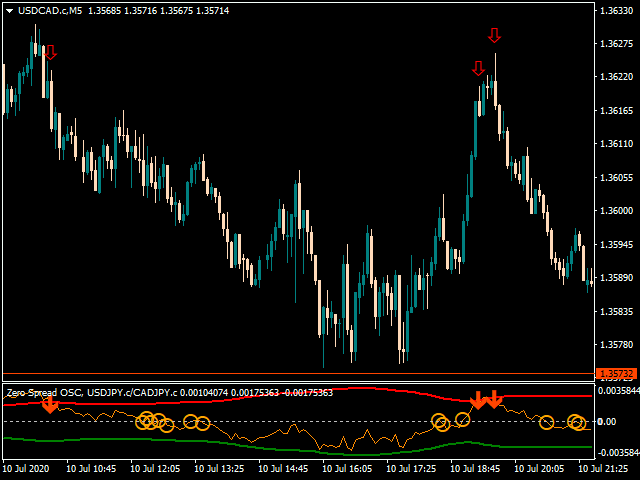
每位价差交易者一直期待的终极工具。 这个强大的MetaTrader指标允许您输入您选择的任何一对工具,为您的交易策略提供前所未有的灵活性。两个工具都不必是指标所在的符号,这让您对分析拥有完全的控制权。
是什么让零基价差振荡器独一无二?
-
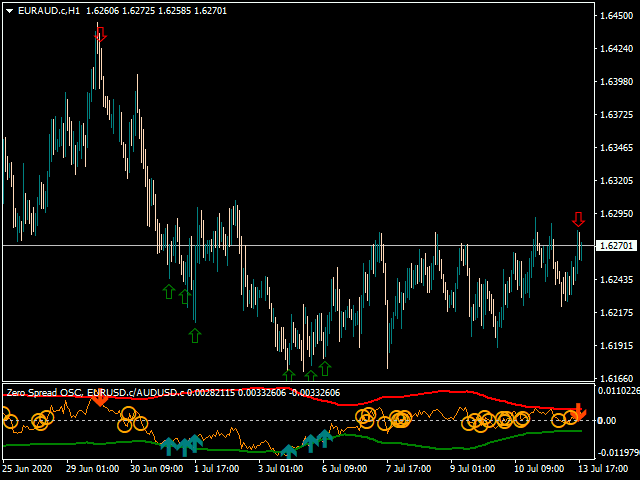
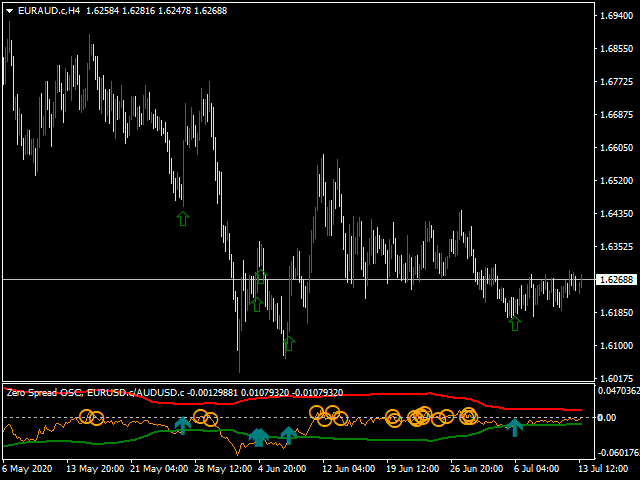
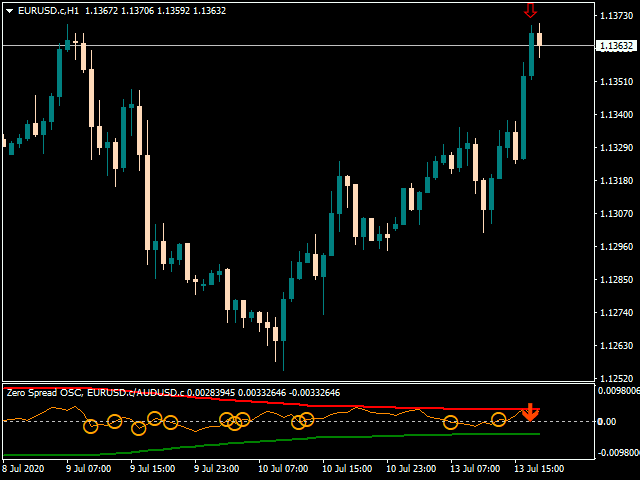
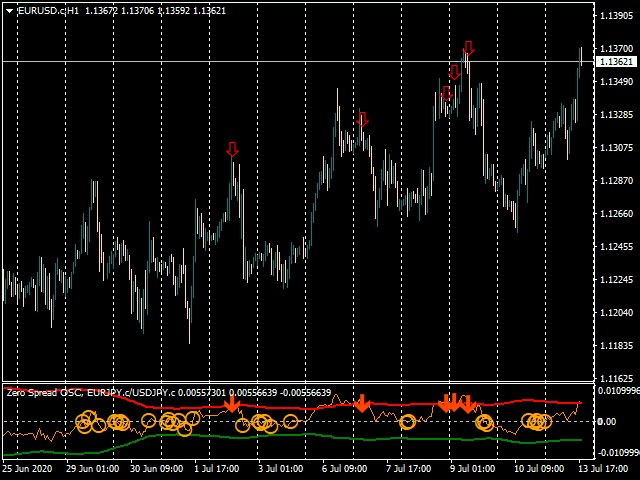
真实的零点振荡:与网上许多其他指标不同,我们的振荡器确实围绕零点波动。这使您能够以最经典的方式用于价差交易,更有效地识别背离或跟随新兴趋势。
-
EA可访问的指标:指标缓冲区完全可访问,使您能够轻松地将其与您的智能交易系统(EA)集成,自动化您的交易策略。
-
可选择的计算算法:直接从选项中自定义计算算法,以适应您的交易偏好。
-
高级自定义:根据您的特定需求和市场条件调整周期和带宽偏差。
-
图表上的视觉信号:利用图表上的信号箭头来优化您的策略并确认交易信号。
为什么选择零基价差振荡器?
无论您是经验丰富的交易者还是新手,这个指标都为您提供了更有效地分析市场和做出明智交易决策所需的工具。其多功能性和可定制性使其成为您交易武器库中不可或缺的补充。
不要错过提升您交易绩效的机会。今天就试试零基价差振荡器,发现它能为您的操作带来怎样的不同。