Citra Bot

4

Inspired from,

Time is the most important factor in determining market movements and by studying past price records you will be able to prove to yourself history does repeat and by knowing the past you can tell the future. There is a definite relation between price and time. -William Delbert Gann


CITRA BOT is a Price Action/Price Pattern detection Indicator which uses historical data to validate a current pattern or profile to predict the probability of hitting future resistance or support levels.


Advantage of using CITRA BOT:

*Self Learning Algorithm.

*Faster and Superior than any other Machine Learning Models like Neural   Networks,Regressions,SVM,Decision tree,Random Forest etc.

*Faster response rate on switching TimeFrame.

*Precision based Profile detection Controls Noise allocation based on user requirements

*Custom Precision Percentage.

*Custom Email,Push Notification Alerts.


Caution: It's not HolyGrail System,It's a tool to give you insight of current market structure.The decision to trade is made only with combination of economical understanding of underlying instrument with economic indicators and economic news.
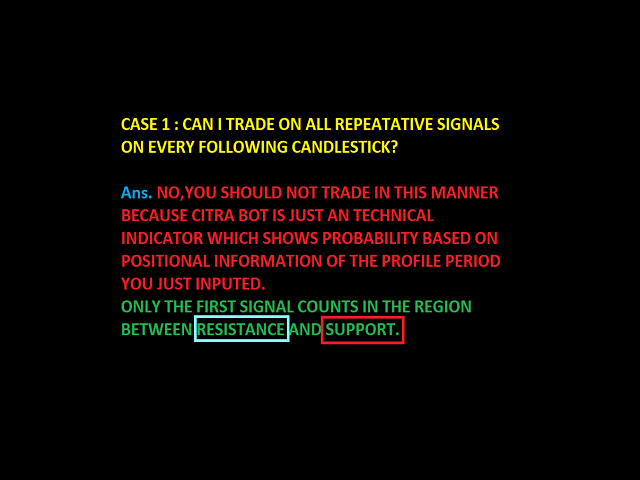
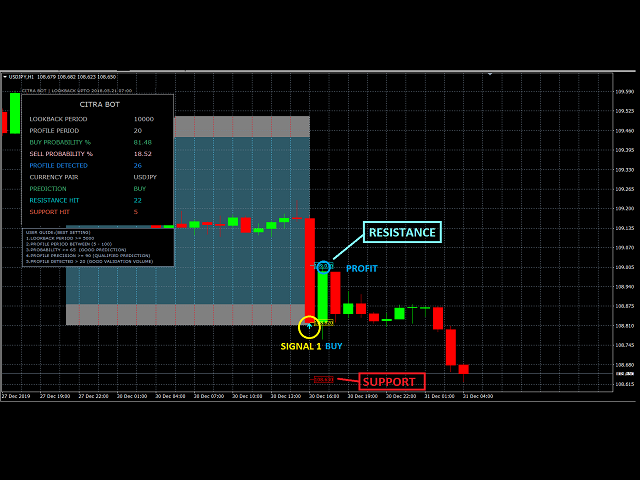
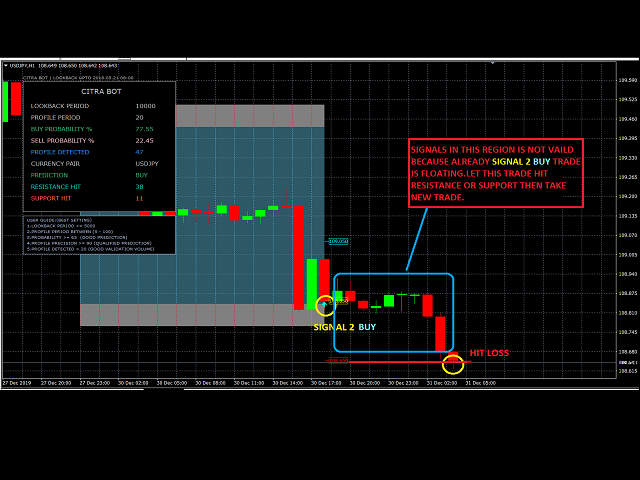


Recommended TimeFrame:

M30 and Above.


Major features considered in Profile detection are 

*Strength of the profile with respect to adjacent close price.

*Profile dimension.

*Future Resistance and Support.

*Tops and Bottoms with respect to time.

*Slope of profile.

*Deviation of profile.


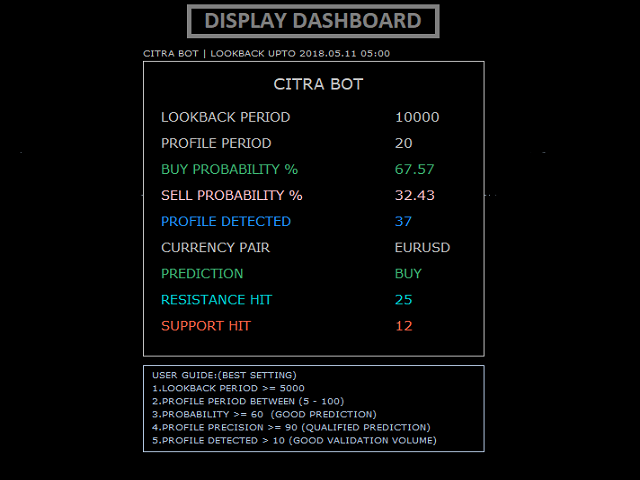
Details on Important Input Parameters:

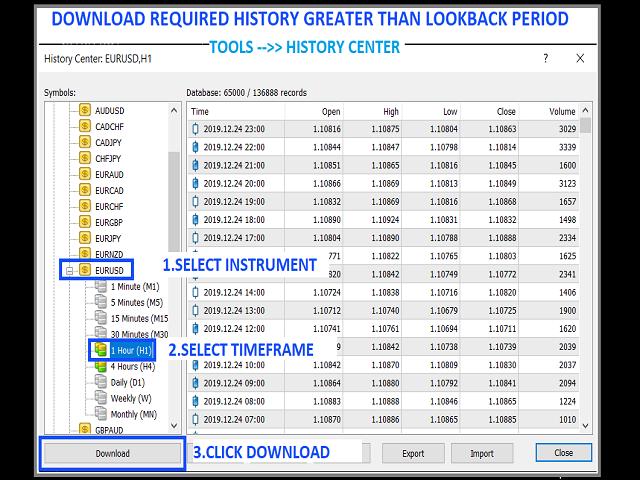
*LookBack_Period = No. of Bars to look in historical memory for exact Profile.

 Note:Download Required Historical Data as per LookBack Period.

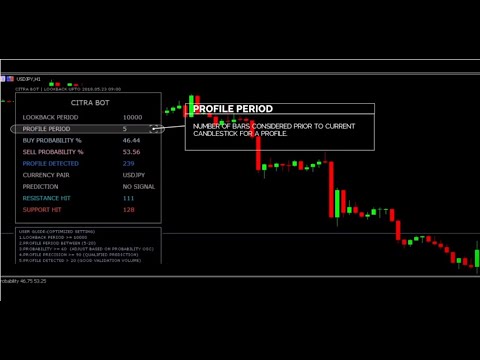
*Profile_Period = No. of recent Bars to consider for a Profile.

*Resistance_pips= pips to set future Resistance level from current Close Price.

*Support_pips= pips to set future Support level from current Close Price.

*Profile_Precision= % of exact match of recent profile with respect to detected profiles.

*Alert_BUY_Above=It’s the Buy Probability alert percentage.

*Alert_SELL_Above=It’s the Sell Probability alert percentage.

*Alert_Profile_Detected=Alert on exceeding No. Of profile detected.

*x_axis,y_axis = Positioning of Display Dashboard on Chart.


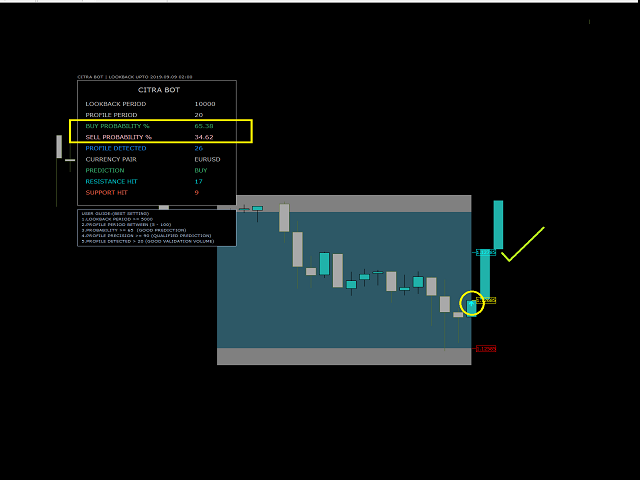
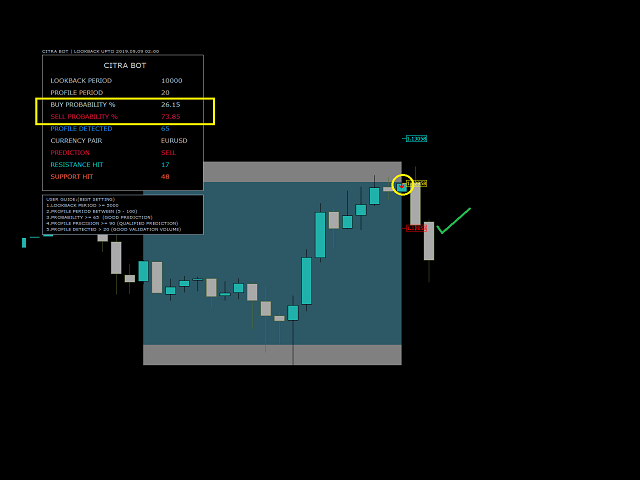
Probability Calculation:

Buy Probability = ( Resistance Hit / (Resistance Hit+Support Hit) ) *100.

Sell Probability = ( Support Hit / (Resistance Hit +Support Hit) ) *100.


Trade Setup:

Buy = Up Arrow Popup         -Set TP at Resistance Level , SL at Support Level.

Sell = Downl Arrow Popup    -Set TP at Support Level , SL at Resistance Level.


Thank you.


评分 4
Yusuf Hamzah
903
Yusuf Hamzah 2023.11.19 07:28 
 

It is a historical pattern recognition matcher. Like RSI Decoder, it would be great if size of the font and box can be changed to fit user preference. As it is, it takes too much space on the chart.

推荐产品
Yawabeh SD Pro –  Professional Supply and Demand Indicator Trade Smarter with Volume-Confirmed Supply/Demand Zones Our institutional-grade algorithm identifies high-probability reversal zones before price reacts, giving you the edge in Forex, Crypto, and Stocks. Key Features Multi-Timeframe Confirmation – View trend strength across multiple timeframes simultaneously – Align your trades with higher timeframe momentum Smart Alert System – Real-time notifications for: – Strong demand/supply zone
KT Asian Breakout Indicator
KEENBASE SOFTWARE SOLUTIONS
KT Asian Breakout 指标分析亚洲交易时段的关键部分,以生成双向买卖信号,并基于价格突破的方向进行交易。当价格突破该交易时段的最高点时,会出现买入信号;当价格突破最低点时,会出现卖出信号。 注意事项 如果交易时段的范围过大,建议避免新交易,因为大部分价格走势已在该时段内完成。 如果突破K线过大,价格通常会在继续沿信号方向运行之前发生短暂回调。 功能特点 买入/卖出信号包含止损和盈利目标。 KT Asian Breakout 指标持续监测其表现,并使用第一、第二或第三盈利目标作为成功标准。 显示三个关键性能指标,包括盈亏信号、成功率和每个信号的平均点数。 如果突破K线过大,图表上会显示警告信息。 推荐设置 时间周期: 15分钟。 交易货币对: 所有 JPY 货币对。 输入参数 绘制交易时段框 :  true/false 绘制止损和盈利目标 :  true/false 性能分析 : true/false 显示文本分析(左上角) :  true/false 成功率标准 :  第一目标 | 第二目标 | 第三目标 颜色和样式设置 :  可自定义 警报设置 :  可自定义
具有多时间框架支持、可自定义视觉信号和可配置警报系统的Balance of Power(BOP)指标。 自由编程服务、更新和其他TrueTL产品可在我的 MQL5个人资料 中获取。 非常欢迎您的反馈和评价! 什么是BOP? Balance of Power(BOP)是一个振荡器,通过将价格变化与K线范围进行比较来衡量买方与卖方的强度。该指标计算为(收盘价 - 开盘价)/(最高价 - 最低价),然后用简单移动平均线(SMA)进行平滑处理。 BOP值在-1和+1之间变动。正值表示买方更强(收盘价高于开盘价),负值表示卖方更强(收盘价低于开盘价)。值的大小显示了走势的强度。BOP通过显示买卖压力之间的平衡来帮助识别市场强度和潜在的反转。 功能: 带箭头和垂直线的视觉信号标记 三个独立的信号缓冲器,具有可配置的触发条件 信号检测选项:方向变化、水平穿越、高点/低点 每个信号的可配置警报功能(电子邮件、推送、声音、弹窗) 具有插值方法的多时间框架(MTF)功能 直方图或线条绘图模式 多种颜色模式(简单、基于方向、基于水平) 通过自定义指标调用(iCustom)访问缓冲器,用于与Expert
FREE
IQ FX Gann Levels
INTRAQUOTES
5 (2)
IQ FX Gann Levels a precision trading indicator based on W.D. Gann’s square root methods . It plots real-time, non-repainting support and resistance levels to help traders confidently spot intraday and scalping opportunities with high accuracy. William Delbert Gann (W.D. Gann) was an exceptional market analyst, whose trading technique was based on a complex blend of mathematics, geometry, astrology, and ancient mathematics which proved to be extremely accurate. Setup & Guide:  Download  MT5 Ver
Supernova Trading Indicator – See the Market Like Never Before Supernova isn’t just an indicator — it’s your secret weapon. Powered by advanced algorithms and real-time analysis, Supernova cuts through the noise and reveals high-probability entry and exit points with stunning clarity. No more guesswork. No more hesitation. Whether you're trading forex, crypto, or stocks, Supernova adapts to any strategy and any timeframe — delivering clean, confident signals that help you trade faster, smarter,
The indicator compares pattern found on chart history with the current price movement. Since history repeats itself, then, by comparing the two patterns, indicator can predict the further movement of the price. The indicator allows you to overlay highlighted history pattern with current movement and you will visually see this movement and will be able to compare the past and the present. To compare two patterns, you need: It is necessary to find and highlight a pattern on the history chart of a
引入 布林带成交量突破检测器 ,这是一个强大的技术指标,旨在增强流行的 布林带突破策略 。该指标通过结合交易量数据将趋势跟踪提升到一个新的水平,有效地减少错误信号。该工具秉承“以量定价”的原则,使交易者能够识别伴随着成交量显着增加的价格突破,从而确保更准确的交易决策。该指标的可定制性使交易者能够利用大量数据微调他们自己的策略。 该指标的主要特点之一是其完全可定制的布林带,可根据个人喜好进行定制。此外,成交量数据的整合通过与移动平均线 (MA) 的颜色编码战斗直观地表示,从而可以轻松识别与 22 天平均线相关的成交量突破。交易者可以通过移动提醒、弹出消息和电子邮件提醒接收通知,通知他们成交量突破 22 天平均线以及价格突破上轨和下轨。可以根据偏好单独激活或停用每种通知方法。 为了进一步协助交易者,该指标在附加数据面板中显示相关数据,提供对市场动态的宝贵见解。此外,这种多功能工具适用于各种符号的应用,确保其在各种交易场景中的实用性。 该指标的参数提供了灵活性和对交易决策的控制。 Bollinger Signal Filter 允许用户选择移动平均线 (MA) 方法和 Applied Pri
Hammer Shooting Star v1.1 – Advanced Candlestick Pattern Scanner Author: LIANG1990 Are you searching for a reliable tool to identify market reversals with precision? Hammer Shooting Star v1.1  is a professional MT4 indicator designed to scan and detect high-quality Hammer and Shooting Star candlestick formations. Unlike basic pattern indicators, this tool applies multiple built-in filters (shape, size, trend alignment, and contextual conditions) to reduce false signals and highlight only the cle
具有多时间框架支持、可自定义视觉信号和可配置警报系统的平均真实波幅(ATR)指标。 免费编程服务、更新及其他 TrueTL 产品请访问 MQL5 个人主页 。 非常感谢您的反馈和评价! 什么是 ATR? 平均真实波幅(ATR)由 J. Welles Wilder 开发,是一种用于衡量市场波动性的技术指标。它计算指定周期内真实波幅(True Range)的平均值。真实波幅是以下三个值中的最大值:当前最高价与当前最低价之间的距离、前一收盘价与当前最高价之间的距离,或前一收盘价与当前最低价之间的距离。 ATR 不显示价格方向 — 它仅衡量波动性。ATR 上升表示波动性增加,ATR 下降则表示波动性减少。交易者使用 ATR 来评估市场状况、设置动态止损(例如基于 ATR 的追踪止损)、确定仓位大小以及识别潜在的突破行情。ATR 值偏高通常出现在快速波动或新闻驱动的市场中,而 ATR 值偏低则表明市场处于平静的整理阶段。 功能特点: 带箭头标记和垂直线的视觉信号标记 具有可配置触发条件的三个独立信号缓冲区 信号检测选项:方向变化、峰值/谷值 每个信号可配置警报功能(邮件、推送、声音、弹窗)
FREE
The Magic MA Moving Average Indicator is a market analysis tool that has more than 30 types of moving averages that the trader can use to gauge the market trend. Among the types of moving averages that the trader can visualize are the most common MAs (SMA, EMA and SMMA), adaptive moving averages such as FRAMA and KAMA and other MAs based on innovative calculation and analysis methods such as LSMA, ZLEMA and others. The indicator is designed to display all these moving averages on a single cha
NOTE: PRICE WILL RISE VERY SOON. DON'T SKIP THIS OFFER! Dear traders I am glad to introduce the " Market Swing Scanner Board" indicator to you. This indicator was made mainly to be used in combination with the Market Swing Index Indicator. You use the  "Market Swing Scanner Board"  indicator to scan for trading opportunities on the  Market Swing Index Indicator . This tool is designed for serious traders who have decided to make a difference through trading. Be the next person to witness this st
Swing Master Indicator
Elias Mtwenge
5 (1)
Dear Traders this is my another tool called " Swing Master Indicator ". As the name above the indicator is designed to help you in swing trading by capturing the low and highs of the price. You may us this tool with any trading strategy and style from scalping to position trading. It is made for level of traders including newbies and advanced traders even prop-firms, hedge funds and banks to help them make sold market analysis. I create tools for serious traders who want to make a difference in
HC ARROW
Cuong Pham
The indicator shows you buy/sell signals and does not repaint. It works well with almost all pairs, while the best ones are GBPUSD, XAUUSD and EURUSD. The product works better on H1 and H4. You can change the parameters in the inputs tab to get the best signals and the best trade results on each pair. You can enable/disable alerts when signal appears. The indicator is easy to use. Parameters barstrip & Sensitive: amount of bars to process the highest and lowest prices (relates to the internal l
Revolutionize Your Trading with This Powerful Indicator-Based System Are you struggling to find accurate entry and exit points in trading? Do you want a proven, indicator-driven system that helps you maximize profits and minimize risks ? Introducing our Advanced Trading System —a powerful, easy-to-use technical analysis tool designed for forex, stocks, and crypto traders . Key Features & Benefits: Precision Buy & Sell Signals – Our system generates crystal-clear buy (green) and sell (red
Quantum Falcon Signal Free is a smart visual trading indicator for MetaTrader 4 designed for Forex and Gold traders. The indicator combines: • Trend analysis • RSI momentum confirmation • MACD momentum filtering • ATR volatility filtering • Higher timeframe confirmation • Smart exit signal detection Main Features: • Smart Buy and Sell signals • Exit Buy / Exit Sell alerts • Real-time dashboard on chart • Professional candle arrows • Multi-timeframe trend confirmation • ATR market volatility filt
FREE
SX Supply Demand Zones accurately identifies and draws high-probability Supply and Demand zones using a sophisticated algorithm. Unlike traditional indicators that clutter your chart, this indicator is designed with a focus on performance and a clean user experience. New Unique Feature: Interactive Legend System What truly sets this indicator apart from everything else is the Interactive Control Legend. You have a professional dashboard directly on your chart that allows you to: Show/Hide: Ins
FREE
Elite SR
Radek Reznicek
Elite SR - Advanced Level Indicator for automatic detection of support and resistance levels with different degree of credibility should become a part of your trading arsenal. This indicator is accessible via iCustom function and provides level values as well as their degree of credibility. Elite SR is fully adjustable and can work on any time-frame with any trading instrument! Important information For all detailed information about this indicator you can visit 747Developments website. Featur
KT Momentum Arrows
KEENBASE SOFTWARE SOLUTIONS
KT Momentum Arrows 指标基于瞬时突破计算,它结合了价格波动方向中的带宽偏离和新兴波动率。这是一种对动量变化反应灵敏的技术指标,适合在趋势开始阶段发出交易信号。 当价格收于上轨之上时,生成买入信号;当价格收于下轨之下时,生成卖出信号。 该指标使用一个“幅度系数”作为输入参数,同时影响带宽偏离和波动率计算。建议根据不同品种和时间周期仔细选择和优化该系数值以获得最佳效果。 主要特点 信号不重绘! 非常适合动量交易者的进场工具。 性能分析功能:胜率、盈亏比、平均收益等数据可视化展示。 适用于日内交易者、波段交易者和剥头皮交易者。 输入参数 历史K线数量:  用于指标计算的K线数量。 幅度系数:  用于调节带宽偏离和波动率的单一系数。 性能分析:  显示或隐藏性能分析,包括利润趋势线。  提醒设置:  支持弹窗、邮件、推送和声音提醒。 其余参数无需额外解释,简单明了。
FRM Half Trend
Noiros Tech
3.5 (2)
YOU CAN NOW DOWNLOAD FREE VERSIONS OF OUR PAID INDICATORS . IT'S OUR WAY OF GIVING BACK TO THE COMMUNITY ! >>>    GO HERE TO DOWNLOAD   The system is a free open source pine script originally published on TradingView by everget   . It was converted to Mt4 by Forex Robot Makers. This system is a  popular trend indicator based on ATR ( Average True Range ) , Moving Averages and the Donchian channel . System BackGround ATR The average true range is an indicator of the price volatility of an asse
FREE
Fractal Channel Breakout MT4
KEENBASE SOFTWARE SOLUTIONS
KT Fractal Channel Breakout draws a continuous channel by connecting the successive Up and Down fractals. It provides alerts and also plots the Up and Down arrows representing the bullish and bearish breakout of the fractal channel. Features If you use Bill Williams fractals in your technical analysis, you must also include it in your trading arsenal. It can be very effective and useful for stop-loss trailing. A new market trend often emerges after a fractal channel breakout in a new direction.
Market Secret
Ramzi Abuwarda
在二元期权交易的世界中,精确的市场分析和战略决策至关重要,寻找一种能够开启盈利机会的卓越交易指标的追求永无止境。进入秘密指标的世界——这是一款非凡的MT4二元期权交易工具,以其卓越性能在同类产品中赢得了声誉。 秘密指标是由一群经验丰富的交易员和专业程序员经过多年精心研究、开发和测试而推出的。其独特的算法和先进的数学模型经过精确调校,为交易员在快节奏的二元期权世界中提供了无与伦比的优势。 秘密指标的独特之处在于其惊人的准确性,能够精准地发现有利可图的交易机会。它的信号是由强大的技术指标、价格行动分析和市场情绪评估相结合得出的。这种多方面的方法确保了秘密指标捕捉到短期波动和长期趋势,为交易员提供全面的市场视角。 秘密指标的一个显著特点是其灵活性。无论您是新手交易员还是经验丰富的专业人士,该指标都可以根据您独特的交易风格和偏好进行定制。其用户友好的界面可轻松安装并与流行的MetaTrader 4(MT4)平台集成,使广大交易员能够使用。 秘密指标赋予交易员及时准确的信号,确保他们能够做出明智的交易决策。通过接收实时警报,交易员可以精确进入和退出交易,最大限度地发挥利润潜力,同时有效
The indicator scans for stop grabber (special pattern of Joe Dinapoli which gives very high probability buy / sell signals and does not repaint ) signals in multiple timeframes for the all markets filtered and shows the results on Dashboard. Key Features Dashboard can be used for all markets It can scan for stop grabber pattern on MN1, W1, D1, H4, H1, M30, M15 ,M5, M1 timeframes Parameters UseMarketWatch: Set true to copy all symbols available in market watch MarketWatchCount : Set the number
This indicator draws Horizontal Support and Resistance automatically. It works with any symbol and any timeframe. Stronger Support Lines are displayed in thicker green horizontal lines. In the same way, Stronger Resistance lines are displayed with thicker red lines. Change the timeframe to display the Support and Resistance Lines of various timeframes.
Super Auto Fibonacci
Muhammed Emin Ugur
Discover the power of precision and efficiency in your trading with the " Super Auto Fibonacci " MT4 indicator. This cutting-edge tool is meticulously designed to enhance your technical analysis, providing you with invaluable insights to make informed trading decisions. Key Features: Automated Fibonacci Analysis: Say goodbye to the hassle of manual Fibonacci retracement and extension drawing. "Super Auto Fibonacci" instantly identifies and plots Fibonacci levels on your MT4 chart, saving you tim
FREE
Limitless MT4
Dmitriy Kashevich
Limitless MT4 is a universal indicator suitable for every beginner and experienced trader. works on all currency pairs, cryptocurrencies, raw stocks Limitless MT4 - already configured and does not require additional configuration And now the main thing Why Limitless MT4? 1 complete lack of redrawing 2 two years of testing by the best specialists in trading 3 the accuracy of correct signals exceeds 80% 4 performed well in trading during news releases Trading rules 1 buy signal - the ap
True Magic Oscillator
Muhammed Emin Ugur
The   True Magic Oscillator   indicator is designed for signal trading. This indicator generates trend signals. It uses many algorithms and indicators to generate this signal. It tries to generate signals from the points with the highest trend potential. This indicator is a complete trading product. This indicator does not need any additional indicators. The indicator is never repainted. The point at which the signal is given does not change.         Features and Recommendations Works wit
EARLY REMINDER: The Starting price is 65 price will rise soon up to 365$ and then 750$ after first 10 copies of sales. Grab this offer now! Introduction Hello, traders! Welcome to the demonstration of the Forex Beast Indicator , a comprehensive tool designed to assist aspiring traders in navigating the complexities of the forex market. This indicator incorporates seven essential components to provide a well-rounded trading experience: Moving Averages Colored Zones Support and Resistance Levels
The Arrow Scalper
Fawwaz Abdulmantaser Salim Albaker
1 (2)
Dear Friend..  I share with you this simple Expert Adviser .. it is full automatic  this Expert Adviser following the trend of the pair you install on or any stocks or indices , it is works like that: - when the trend on H4 chart show a start of up trend the expert will wait till the 15M & 1H charts show an up trend the EA will open a buy order directly , and do the same for down trend and open a sell order the buy or sell  order lot size and take profit and stop loss will measured manually  by
FREE
OFFER!   OFFER ! After 3 weeks the unlimited price will be 500$ and in the future you will regret why you didn't make a purchase at this lowest price. Dear Traders, the atomic power Entries Indicator is one of the indicators that if used wisely and correctly can help you to find an edge over the market.  The indicator will work for all forex pairs, all markets and all timeframes. Still it is your duty to find the most effective timeframe for you. When the sell or buy arrow appears you will get a
KT COG Advanced MT4
KEENBASE SOFTWARE SOLUTIONS
1 (1)
KT COG is an advanced implementation of the center of gravity indicator presented by John F. Ehlers in the May 2002 edition of Technical Analysis of Stocks & Commodities magazine. It's a leading indicator which can be used to identify the potential reversal points with the minimum lag. The COG oscillator catches the price swings quite effectively. MT5 version of the same indicator is available here KT COG Advanced MT5 Calculation of COG The COG indicator is consist of the two lines. The main l
该产品的买家也购买
Neuro Poseidon MT4
Daria Rezueva
4.95 (37)
Neuro Poseidon is a new indicator by Daria Rezueva. It combines precise trading signals with adaptive TP/SL levels - creating best possible trades as a result! Message me and get  Neuro Poseidon Assistant  as a gift to automize your trading process! What makes it stand out? 1. Proven profitability on all assets and timeframes 2. Only confirmed BUY and SELL signals present on the chart 3. Adaptive TP & SL levels generated by the software for each trade 4. Easy to understand - suitable for all
Dynamic Forex28 Navigator
Bernhard Schweigert
4.43 (7)
Dynamic Forex28 Navigator - 下一代外汇交易工具。 当前 49% 折扣。 Dynamic Forex28 Navigator 是我们长期流行的指标的演变,将三种功能合二为一: 高级货币强度 28 指标 (695 条评论)+ 高级货币 IMPULSE 带警报 (520 条评论)+ CS28 组合信号(奖励)。 有关指标的详细信息 https://www.mql5.com/en/blogs/post/758844 下一代强度指标提供什么? 您喜欢的原始指标的一切,现在通过新功能和更高的精度进行了增强。 主要特点: 专有货币强度公式。  所有时间范围内的平滑和准确的强度线。 非常适合识别趋势和精确进入。 动态市场斐波那契水平(市场斐波那契)。  此指标独有的独特功能。 斐波那契应用于货币强度,而不是价格图表。 适应实时市场活动以获得准确的反转区域。 实时市场动量。  第 9 行显示市场是活跃还是被动。 对于定时交易至关重要。 全面的警报和显示。  每种货币最强的买入和卖出动量。 ​​28 对的双重动量买入和卖出。 超买/超卖警告外部范围和止损。 反转
MetaBands M4
Vahidreza Heidar Gholami
3.5 (6)
MetaBands使用强大且独特的算法绘制通道并检测趋势,以便为交易者提供进出交易的潜在点。它是一个通道指标和强大的趋势指标。它包括不同类型的通道,可以通过使用输入参数简单地合并以创建新通道。MetaBands使用所有类型的警报通知用户市场事件。 功能 支持大多数通道算法 强大的趋势检测算法 能够合并不同类型的通道 多时间帧和多货币(信号矩阵) 所有类型的警报功能(声音、屏幕闪烁、推送通知、电子邮件、弹出窗口、箭头) 它永远不会重绘 趋势检测 MetaBands使用在通道内振荡的蓝色线来检测趋势。当该线遇到通道的上界时,表明开始下跌趋势,当它遇到下界时,表明开始上涨趋势。如果蓝线接近中线,则市场处于整理期。 该指标使用独特的方法来检测趋势。一开始可能看起来有些复杂,但如果您观看视频教程,您就会意识到它是多么强大且易于使用。 入场和出场信号 当趋势变化或价格穿过上下通道时,MetaBands会立即通过不同的方法提醒交易者,这些方法可以在指标设置中启用。 信号矩阵 要监视来自不同时间框架的多个符号并在一个地方查看信号,请单击右上角按钮或按键盘上的M键以打开信号矩阵。该矩阵可以快速概览
本产品已针对 2026 年市场进行更新,并针对最新 MT5 版本进行了优化。 价格更新通知: Smart Trend Trading System 目前价格为 $99 。 接下来的 30 次购买 后,价格将上涨至 $199 。 特别优惠: 购买 Smart Trend Trading System 后,请发送私信给我,即可免费领取 Smart Universal EA ,并将您的 Smart Trend 信号转换为自动交易。 Smart Trend Trading System 是一套完整的交易系统,具备不重绘、不回绘、不延迟的特点,专为希望获得更清晰信号、更准确趋势方向以及更有组织交易方式的交易者打造。 Online course , manual and download presets . 它将 10 多种交易工具 整合到一个系统中,包括趋势检测、反转区域、Smart Cloud、移动止损逻辑、支撑与阻力、K线着色、提醒以及多周期分析。 该系统旨在帮助您应对不同的市场环境: 趋势市场: 识别主要趋势,发现回调,跟随动能,并通过止损指导和移动止损选项寻找更清晰的入场机会。 震荡
Advanced Supply Demand
Bernhard Schweigert
4.91 (300)
现在优惠 30%! 任何新手或专业交易者的最佳解决方案! 该指标是一款独特、高质量、且价格合理的交易工具,因为我们已经整合了许多专有功能和新公式。 依据此更新,您将能够显示双重时间帧区域。 您不仅可以显示一个较高的时间帧,还可以同时显示图表时间帧,加上更高的时间帧:显示嵌套时区。 供需双方所有交易者都会喜欢它。 :) 重要信息披露 高级供需的最大潜力,请访问 https://www.mql5.com/zh/blogs/post/720245   想象您的交易如何得以改善,是因为您能够精准定位入场或目标位吗? 构建于新的底层算法,它可以更轻松地识别出买卖双方之间的潜在失衡。 这是因为它以图形方式展示供需最强劲区域,及其过去的表现(显示旧区域)。 这些功能旨在帮助您更轻松地发现最佳入场区域和价位。 现在您可以针对您的交易品种和时间帧来优化和编辑区域强度! 高级供需指标适用于所有产品和时间帧。 它是一个新的公式,非常新的功能是两个区域强度函数可由用户输入进行调整! 这在交易中是一大优势。 当您学习如何使用专有功能,例如带有价格游离最小 X 因子的区域强度时,您能够判断该区域强劲与否。 供需
Scalper Inside PRO
Alexey Minkov
4.68 (69)
Scalper Inside PRO Scalper Inside PRO 是一款日内趋势与剥头皮指标,采用独家的内置算法来评估市场方向和关键目标位。该指标会自动计算进场点、出场点以及多个止盈目标位,并显示详细的绩效统计数据,让您能够看到不同品种和策略在历史数据上的表现。这有助于您选择符合当前市场状况的交易品种。您还可以将自己的箭头指标连接到 Scalper Inside PRO,并快速查看它们的统计数据和历史信号。 Scalper Inside PRO 使用手册及参数说明: 点击阅读 该指标适用于任何品种和时间周期(日内交易推荐使用 M5),并包含多种内置策略。它既可作为独立的剥头皮工具使用,也可作为您交易系统的分析组件。 主要功能 基于独家的新一代趋势检测算法 Next-Generation Trend Detection Algorithm (NG TDA) 进行趋势识别。 自动计算进场点和出场点,并提供多级止盈目标(TP1、TP2、TP3)。 三种内置策略和一个优化器,用于将信号适配到当前品种和时间周期(仅在实时模式下可用)。 提供品种和策略在历史数据上的详细绩效统计。 提
Gann 方块指标是一种强大的市场分析工具,基于 W.D. Gann 在其“市场预测数学公式”一文中介绍的数学概念。该指标融合了与平方数(如 144、90 和 52)有关的 Gann 技术,以及平方 9。此外,它还融入了  关于如何将平方 9 与通道和星形图案结合使用的方法。 用户手册和使用方式: 在使用该指标之前,我们建议您阅读用户手册,并与我们联系以获得任何澄清。您可以在我们的网站上找到完整的用户手册。 该指标提供了 MT5 的完整版本供购买,也提供了 MT4 的免费版本供测试。提供了两个版本的链接供您方便使用。 主要特点和功能: Gann 方块指标为您的交易环境提供了全套工具,使您能够基于几何图案和 Gann 的概念做出明智的决策。以下是主要特点: 平方 9 分析: 该指标可以绘制与平方 9 有关的各种元素,包括水平线、星形图案、网格、Gann 扇形等。这在您的图表上提供了 Gann 的几何概念的视觉表示。 Gann 方块: 该指标绘制了 Gann 方块 52、90 和 144,使您能够可视化和分析它们与价格走势的关系。 自由 Gann 星形图案: 该指标使您能够直接在图表上绘制
Breakout Arrows Mt4
Michael Oko Oboh
5 (1)
Trend Breakout Arrows Indicator The Trend Breakout Arrows Indicator is a momentum-based signal tool designed to identify potential bullish and bearish breakout opportunities. It displays clear arrow signals directly on the price chart, helping traders quickly recognize possible trend changes and continuation setups. Up Arrow (Buy Signal) A magenta up arrow appears below a candle when bullish momentum begins to strengthen. This signal indicates that buying pressure may be overtaking selling press
Neo Wave PRO
Nikolay Raykov
5 (1)
Price & Time Market Structure Indicator A professional market structure tool that analyzes waves through both price and time — not price alone. Main Description NeoWave PRO is a professional market structure indicator for MetaTrader 4 designed for traders who want to move beyond traditional one-dimensional wave tools such as ZigZag, swing indicators, and basic high/low systems. Most wave indicators analyze only one thing: Price. But a real market wave is not only a price movement. A true wave de
BTMM State Engine Pro MT4
Garry James Goodchild
BTMM State Engine Pro is a MetaTrader 4 indicator for traders who use the Beat The Market Maker approach: Asian session context, kill zone timing, level progression, peak formation detection, and a multi-pair scanner from a single chart. It combines cycle state logic with a built-in scanner dashboard so you do not need the same tool on many charts at once. What it does Draws the Asian session range; session times can follow broker server offset or be set in inputs. Tracks level progression (L
GOLD Impulse with Alert
Bernhard Schweigert
4.67 (12)
这个指标是我们2个产品 Advanced Currency IMPULSE with ALERT  +   Currency Strength Exotics 的一个超级组合。 它适用于所有时间框架,并以图形方式显示8种主要货币和一种符号的强势或弱势冲动! 该指标专门用于显示任何符号的货币强度加速,如黄金、异国货币对、商品、指数或期货。这是它的第一个指标,任何符号都可以被添加到第9行,以显示黄金、白银、石油、DAX、US30、MXN、TRY、CNH等的真实货币强度加速(冲动或速度)。 建立在新的基础算法上,它使识别和确认潜在的交易更加容易。这是因为它以图形方式显示了一种货币的强势或弱势是否正在加速,并测量了这种加速的速度--把它想象成你汽车中的速度表。当你加速时,事情显然会发生得更快,这在外汇市场上也是一样的,即如果你配对的货币正在向相反的方向加速,你就会发现一个潜在的有利可图的交易。 动态市场斐波那契28水平被用作警报触发器,将适应市场活动。如果冲动击中黄色触发线,你将收到警报。然后你就知道作为一个交易员应该做什么。货币对和方向已经给出。只需点击警报按钮,就可以切换到该货
The indicator scans for Dinapoli thrust pattern in multiple timeframes for the all markets filtered and shows the results on Dashboard. Key Features Dashboard can be used for all markets It can scan for thrust pattern on MN1, W1, D1, H4, H1, M30, M15 ,M5, M1 timeframes Ability to choose number of bars required above/below displaced moving average to define thrust Parameters UseMarketWatch: Set true to copy all symbols available in market watch MarketWatchCount : Set the number of symbols that
本指标是实践实战交易完善的波浪自动分析的指标 !  案例... 注: 波浪分级用西方叫法不习惯,因受到缠论(缠中说禅)命名方式习惯的影响,我是将基础波浪命名为 笔 ,将二级波段命名为 段 ,同时具有趋势方向的段命名为 主趋段 (以后笔记中都是这种命名方式,先告知大家),但是算法上和缠论关系不大切勿混淆.反映的是本人分析盘面总结的 千变万化纷繁复杂的运行规律 . 对波段进行了标准化定义,不再是不同人不同的浪  ,    对人为干扰的画法进行了排除,在严格分析进场起到了关键的作用 . 使用这个指标,等于将交易界面提升美感,抛弃最原始的K线交易带你进入新的交易层次.如果不是为了交易,在宣传上也将使客户观感提升层次. 指标内容: 1. 基础波浪 (笔) : 首先我们找出了价格波动过程中的基础波动拐点,当然他的有序性低,为下一步的计算提供基础. 2. 二级波段( 段 ) :在基础波浪的基础上,通过算法分析得到层级更明显的二级波段,二级波段为波浪提供了分析基础 3. 波浪( 浪 ): 有着更清晰的趋势,更清晰直观的方向.分析一个波浪是否延续,需要看二级波段的形态,分析二级的构成,可以得出波浪
Harmonic Pattern Plus MT4
Young Ho Seo
4.44 (18)
Introduction Harmonic Patterns are best used to predict potential turning point. Traditionally, Harmonic Pattern was identified manually connecting peaks and troughs points in the chart. Manual harmonic pattern detection is painfully tedious and not suitable for everyone. You are often exposed under subjective pattern identification with manual pattern detection. To avoid these limitations, Harmonic Pattern Plus was designed to automate your harmonic pattern detection process. The functionality
Current event:  https://c.mql5.com/1/326/A2SR2025_NoMusic.gif A. 什么是 A2SR ?   * 这是一个领先的技术指标(没有重绘,没有滞后)。  -  指导 : -- 在  https://www.mql5.com/en/blogs/post/734748/page4#comment_16532516 -- 和  https://www.mql5.com/en/users/yohana/blog A2SR 在确定支撑(需求)和阻力(供应)水平方面有一种特殊的技术。 与我们在网上看到的普通方式不同,A2SR 在确定实际 SR 级别时有一个独创的概念。 原技术不是从网上拿来的,也没有在网上公开过。 A2SR 将根据您的交易风格自动选择 SR 级别。 即使您正在更改时间范围,但 SR 级别仍将保留在其位置上。 因为实际的 SR 不是从你使用的时间范围内获得的。 A2SR 拥有完整的交易工具 。 实际支持(需求)和阻力(供应)的真正概念。 新闻事件和央行讲话的市场情绪。 新闻事件和趋势的主要货币强度 (MCS) 的真正概念
KT Alpha Hunter Arrows MT4
KEENBASE SOFTWARE SOLUTIONS
大多数箭头指标只给你一个信号,然后把剩下的判断全部留给你自己。KT Alpha Hunter Arrows 给你的,是一套完整的交易计划。 每一个信号箭头出现时,图表上都会同时绘制完整计划:入场线、止损位、四个止盈目标,以及实时 Edge 结论,告诉你当前品种和时间周期是否值得交易。套装中还包含 Trade Manager EA,在你手动入场后负责后续执行,让你在市场波动和情绪干扰下依然保持纪律。非重绘。只在K线收盘后给出信号。适用于 Forex、黄金、指数,以及你交易的其他任何品种。 核心功能 非重绘买入和卖出箭头,只在K线收盘后出现。 每个信号都带有入场线、结构性止损和四个止盈目标。 Edge Dashboard 会分别评估当前图表上的买入和卖出机会。 结论系统:No Edge、Marginal、Tradeable、Good 或 Strong。 一键 Auto Optimize 按钮,可根据当前品种和时间周期自动调整设置。 完整套装包含 Trade Manager EA,并内置五种专为本指标设计的交易管理方案。 Prop Firm Risk Panel 可在图表上实时追踪日内回撤
Market Structure Patterns MT4
Samuel Manoel De Souza
5 (18)
Market Structure Patterns   is an indicator based on   smart money concepts   that displays   SMC/ICT   elements that can take your trading decisions to the next level. Take advantage of the   alerts ,   push notifications   and   email messages   to keep informed from when an element is formed on the chart, the price crosses a level and/or enters in a box/zone. Developers can access the values of the elements of the indicator using the   global variables  what allows the automation of trading d
Trend Lines PRO
Roman Podpora
5 (1)
TREND LINES PRO 帮助您了解市场真正的方向转变点。该指标显示真实的趋势反转点以及主要参与者重新入场的时机。 您可以看到 BOS线、 趋势变化和更高时间框架的关键水平——无需复杂的设置或不必要的干扰。信号不会重绘,并在K线收盘后仍然保留在图表上。 VERSION MT 5    -   与……搭配使用时,可发挥其最大潜力   RFI LEVELS PRO 指示器 该指标显示的内容: 实际变化 趋势(BOS 线) 一旦信号出现,它就始终有效!这与会重绘的指标有着重要的区别,后者可能会发出信号后又改变信号,从而导致资金损失。现在,您可以更精准、更准确地进入市场。此外,还有一个功能,会在箭头出现后为K线着色,直到达到目标价位(止盈)或出现反转信号为止。 重复条目   以及主要玩家的充值 为了提高寻找入场点时的视觉清晰度,我们创建了一个模块,该模块首先显示买入/卖出区域,并在该区域内寻找最佳入场点。此外,我们还加入了智能逻辑来管理止损位,该逻辑会随着时间的推移逐步降低止损位的大小,从而降低入场交易时的初始风险(移动止损位)。 信号强度水平(BOS) 该指标采用三个显著性等级来衡量
RFI levels PRO
Roman Podpora
5 (1)
该指标能够准确显示反转点和价格回落区域。     行业领军人物 。您能洞察新趋势的形成,并以最高的精准度做出决策,掌控每一笔交易。 与……结合时,展现其最大潜力     趋势线专业版   指标  VERSION MT5 该指标显示的内容: 新趋势开始时的反转结构和反转水平及其激活。 显示屏   获利了结   和   止损   风险回报比最低的水平     RR 1:2       。 具有智能减值逻辑的止损。 显示指定指标中两种趋势类型的反转形态。 指标: 根据     趋势线     (全球趋势变化) 潮流专业版     (趋势快速变化) 简单有效   扫描器   实时趋势(新增)。 多时间框架工具筛选。 展示   利润   在 LOGIC AI 信号之后。 以下列出今日走势积极的金融工具。(RB键) 能够为终端启用通知(警报)功能,并向移动设备推送通知。 逻辑人工智能     — 利用人工智能寻找最佳切入点。 只有在启用 MTF(多时间框架分析)模式时,该功能才可用。 兼容性。 当与趋势线指标结合使用时,该指标能发挥其最大潜力。 这     RFI LEVELS PRO    
IQ FX Strength  answers the single most important question in trading: "Who is truly driving the market right now?" Designed with a stunning Hybrid UI, this tool separates true trend moves from market noise, allowing you to catch "Explosive" moves before the crowd sees them. System Requirement: For higher accurate signal and optimal, smoother performance of this indicator without any lag, a good CPU (with   RAM of  atleast 8GB or above) and fast internet connection is highly recommended. IQ FX
Block Master Pro
Stanislav Konin
5 (3)
The Block Master Pro indicator is designed to visually identify areas on the chart where significant volumes from major market participants are likely concentrated. These areas, known as order blocks, represent price ranges where large players place their orders, potentially signaling a price reversal and movement in the opposite direction. Key Features: Order Block Identification: Block Master Pro effectively identifies order blocks by pinpointing price ranges where large orders are placed. Th
Enigmera
Ivan Stefanov
5 (8)
ENIGMERA: 市场的核心 重要提示:MQL5.com 演示版本在策略测试器中运行,可能无法完全反映 Enigmera 的功能。请查看描述、截图和视频了解详细信息。如有任何问题,请随时联系我! 该指标的代码已完全重写。版本 3.0 增加了新功能并修复了自指标发布以来积累的错误。 简介 这个指标和交易系统是金融市场的一种独特方法。ENIGMERA 使用分形周期来精确计算支撑和阻力水平。它展示了真实的积累阶段,并提供了方向和目标。无论是在趋势中还是在修正中,这个系统都能工作。 它是如何工作的 指标的大部分功能通过图表左侧的按钮控制,使得能够快速响应不同的市场情况。 按钮 ON/OFF – 显示或隐藏整个指标。 Channel – 激活支撑通道,显示可接受的偏差范围。 Dev1 (第一偏差) – 指示价格在支撑偏差内的波动,信号表示市场正在整合或积累力量。 Dev2 (第二偏差) – 显示价格在偏差之间的波动,表示趋势形成和方向。 Dev3 (第三偏差) – 表示趋势的显著加速和高波动性。 45deg (45度) – 显示市场的节奏和相对于 45 度线的运动稳定性。 Tgt1/2
Delta Fusion Pro
Francesco Secchi
5 (2)
Delta Fusion Pro – 高级订单流分析,专为日内交易设计 Delta Fusion Pro 是一款专业的 MetaTrader 4 指标,能够揭示市场中的主动订单流,实时显示机构压力的强度和方向。与传统的成交量指标不同,它分析买盘(Ask)与卖盘(Bid)之间的成交量差值(Delta),用于提前预测反转、确认趋势并识别专业兴趣区域。 主要特点 智能自动调节系统 根据以下条件自动调整所有参数: 交易品种类型(外汇、加密货币、指数、大宗商品、股票) 操作周期 市场波动率(ATR) 最近平均成交量 无需手动配置,适合新手交易者——指标自动完成校准! 核心功能 净Delta与累计Delta 计算主动买盘/卖盘成交量差值,支持自定义 EMA 平滑 实时显示方向性压力 可自定义直方图颜色(买入/卖出) 价格/成交量背离 自动检测常规与隐藏背离 强度分类:强/中/弱 高级过滤:成交量确认、趋势、时间距离 图形信号(彩色箭头) 市场失衡 识别显著的买盘/卖盘比例失衡(可配置比率) 最小成交量阈值验证 图表显示彩色点(多头/空头) Infusion Volume 检测异常成交量峰值(
NAM Order Blocks
NAM TECH GROUP, CORP.
3.67 (3)
MT4多時限訂單塊檢測指示器。 特徵 -在圖表控制面板上完全可自定義,提供完整的交互。 -隨時隨地隱藏和顯示控制面板。 -在多個時間範圍內檢測OB。 -選擇要顯示的OB數量。 -不同的OB用戶界面。 -OB上的不同過濾器。 -OB接近警報。 -ADR高低線。 -通知服務(屏幕警報|推送通知)。 概括 訂單塊是一種市場行為,它指示從金融機構和銀行收取訂單。著名的金融機構和中央銀行帶動了外匯市場。因此,交易者必須知道他們在市場上正在做什麼。當市場建立訂單塊時,它會像發生大多數投資決策的範圍一樣移動。 訂單建立完成後,市場將朝著上升和縮小的方向發展。訂單大宗交易策略的關鍵術語是它包括機構交易者正在做的事情。由於它們是主要的價格驅動因素,因此包括機構交易在內的任何策略都可以。 您將在任何時間範圍內實時看到訂單塊,使用我們的控制面板,您將能夠在所選的歷史記錄週期內檢測常規,拒收和未大寫的訂單塊。 現在您可以接收到訂單塊接近警報,我們在MT4上顯示屏幕通知,並將通知推送到您的手機!
Smart Price Action Concepts
Issam Kassas
4.77 (13)
本产品已针对 2026 年市场进行更新,并针对最新 MT5 版本进行了优化。 价格更新通知: Smart Price Action Concepts 目前价格为 $200 。 接下来的 30 次购买 后,价格将上涨至 $299 。 特别优惠: 购买后,请发送私信给我,即可领取 免费赠品 + 礼物 。 首先需要强调的是,这款交易工具是不重绘、不回绘、不延迟的指标,因此非常适合专业交易使用。 Online course , and manual Smart Price Action Concepts 指标是一款非常强大的工具,适合新手和有经验的交易者使用。它将 20 多个实用指标整合到一个系统中,结合了 Inner Circle Trader Analysis 和 Smart Money Concepts Trading Strategies 等高级交易理念。该指标专注于 Smart Money Concepts,帮助交易者理解大型机构如何交易,并辅助预测其市场行为。 它特别擅长流动性分析,使交易者更容易理解机构交易逻辑。它也非常适合预测市场趋势并仔细分析价格走势。通过让交易与机构策略保
Cycle Sniper
Elmira Memish
4.39 (36)
Please contact us after your purchase and we will send you the complimentary indicators to complete the system Cycle Sniper is not a holy grail but when you use it in a system which is explained in the videos, you will feel the difference. If you are not willing to focus on the charts designed with Cycle Sniper and other free tools we provide, we recommend not buying this indicator. We recommend watching the videos about the indiactor and system before purchasing. Videos, settings  and descri
Dynamic Scalper System
Vitalyi Belyh
5 (1)
“ Dynamic Scalper System ”指标专为在趋势波内进行剥头皮交易而设计。 已在主要货币对和黄金上进行测试,并可与其他交易工具兼容。 提供顺势短线建仓信号,并提供额外的价格变动支持。 指标原理: 大箭头决定趋势方向。 在趋势波内,我们采用一种生成小箭头形式的剥头皮交易信号的算法。 红色箭头代表看涨方向,蓝色箭头代表看跌方向。 敏感的价格变动线会沿着趋势方向绘制,并与小箭头信号协同作用。 信号运作方式如下:当线在适当时刻出现时,将形成入场信号;在出现线时,持仓;线完成后,平仓。 建议的操作时间范围为M1 - H4。 箭头在当前K线上方形成,如果下一根K线已开仓,则不会重新绘制上一根K线上方的箭头。 输入参数 Trend Wave Period - 趋势方向(大箭头)的周期,改变趋势波的时间间隔。值 1 表示趋势方向的最长持续时间,参数值越大,持续时间越短。 Scalper Arrows Period - 信号箭头(小箭头)的计算周期,改变入场信号的生成频率。值 3 表示最频繁的生成频率,参数值越大,箭头频率越低,准确度越高。 这些参数可以根据不同的时间范
Quants HL Break
Ferhat Mutlu
5 (2)
通過純價格行為進行高級計算,以找到 LH 和 HL 突破。 它會給你一個很好的市場反轉點。 LH 和 HL 信號也可用於 traingle 突破。 一旦突破發生,則表明強烈反轉。 移動平均線的漂亮過濾器。 我強烈建議將其與趨勢指標一起使用。 可用作支撐和阻力、供需指標的額外確認。 可以在以下外匯線程中找到更多詳細信息: 該指標未重新繪製。 Buffers :   SetIndexBuffer ( 0 ,UpBar);      SetIndexBuffer ( 1 ,UpBar2);           SetIndexBuffer ( 2 ,DnBar);      SetIndexBuffer ( 3 ,DnBar2);           SetIndexBuffer ( 4 ,UpBarTop);      SetIndexBuffer ( 5 ,UpBarLow);                    SetIndexBuffer ( 6 ,DnBarTop);      SetIndexBuffer ( 7 ,DnBarLow);           SetIn
TRADING STRATEGY GUIDE DELIVERY The full Trading Strategy Guide will be sent directly to you after purchase. Just message me on MQL5 and ask for it — you'll receive it instantly, along with priority support and setup help. Powered Market Scanner for Smart Trading Decisions Keypad Support & Resistance is a next-generation MT4 trading system built for serious traders who demand precision, reliability, and clarity. It combines advanced smart filters with real-time price structure logic to genera
The Propfolio Master Suite is the ultimate all-in-one analytical workstation for professional traders. Combining the power of the Beat The Market Maker (BTMM) methodology, Smart Money Concepts (SND/Liquidity), and Advanced Volume Profile, this suite replaces multiple different indicators with one optimized engine. Monitor up to 14 pairs simultaneously from a single chart, instantly identify market cycles, and seamlessly map institutional footprints with the click of a button. The Command Center
作者的更多信息
Arbitrage Thief Index
Philip Pankaj Suthagar
4.35 (23)
The Silent Edge of Smart Money "It's not about how much you do, but how much love you put into what you do that counts." – Mother Teresa They say the real money in trading is made in the shadows—where inefficiencies hide and only the most perceptive capitalize. That’s exactly where the Arbitrage Thief Index (ATI) thrives. For years, this tool has been my personal advantage , silently identifying low-risk, high-reward trades before the crowd even notices. It’s the kind of edge top fund managers
Rsi Regression Channel
Philip Pankaj Suthagar
5 (2)
In statistics, Regression Channel is a approach for modelling the relationship between a scalar response (or dependent variable) and one or more explanatory variables (or independent variables).We Applied relative strength index(rsi) values to develop regression models of various degrees in order to understand relationship between Rsi and price movement.                        Our goal is range prediction and error reduction of Price divergence , thus we use Rsi Regression
Moving Average Bands
Philip Pankaj Suthagar
MOVING AVERAGE BANDS / MA BANDS: This is an very simple Indicator but very powerful in identifying trend reversal.The calculation of moving Average bands consist of defining the range of bars and the multiplier we use. -To find range of n bars we used the values of moving average high and low values of n bars. -Then we used individual multiplier for individual bands. -The multiplier we defining can be based on your style say for example some needs moving average fibonacci bands or dynamic fibona
Rsi Ma Bands
Philip Pankaj Suthagar
"It's not about how much you do, but how much love you put into what you do that counts."    - Mother Teresa This Indicator is build on value of Relative Strength Index and Moving average of relative strength Index. We have calculated bands with respect to Moving average of Relative strength Index. Trading strategy:   https://www.mql5.com/en/blogs/post/725691 Why use Rsi Ma Bands? Great for novice traders as well as experienced traders. Low risk entries. Doesn't repaints. No additional Indicato
NeuroWave Scalper PRO
Philip Pankaj Suthagar
5 (2)
Motivated from: A market is the story of cycles and of the human behavior that is responsible for overreactions in both directions. - Seth Klarman NeuroWave Scalper PRO  is a advanced powerful cycle algorithm which depicts the cycles of market in a effective manner.This Indicator works in trending as well as ranging market conditions. This indicator is perfect for scalp trades as well as swing trades.   NeuroWave Scalper PRO  is not just an indicator, but a trading strategy itself. It doesn't
Rsi Decoder
Philip Pankaj Suthagar
4.5 (2)
Introducing RSI DECODER "Time is the most important factor in determining market movements and by studying past price records you will be able to prove to yourself history does repeat and by knowing the past you can tell the future. There is a definite relation between price and time." - William Delbert Gann Caution: RSI DECODER is not a Holy Grail System. It is a tool designed to give you insight into the current market structure. Trading decisions should be made in combination with an economi
Shark Deal Book
Philip Pankaj Suthagar
4 (3)
Term  "shark"  in the business world denotes a high volume investor who just made a good investment in a highly Potential business deal.So, sharks are the ones who make the market move. In our case, if an American shark bought a Japanese company, he/she has to convert American dollars into Japanese yen to make the deal. So, the demand for the Japanese yen will increase sharply. Thus USD/JPY will go short rapidly if the deal was from the shark. Another example, In the case of forex, if fed increa
Heiken Ashi Scanner
Philip Pankaj Suthagar
4.25 (4)
Heikin-Ashi charts , developed by  Munehisa Homma  in the 1700s.  Munehisa Honma was a rice merchant from Sakata, Japan who traded in the Dojima Rice market in Osaka during the Tokugawa Shogunate. He is considered to be the father of the candlestick chart.   Th e man who invented the use of candlestick charts for finding and profiting from chart patterns.He was a billionaire trader on those days if we compared his net-worth with todays dollar . Heikin Ashi Scanner is an Multi-Currency and Multi
Trade Extractor
Philip Pankaj Suthagar
5 (2)
The AI That Puts You Ahead of the Market You're Losing Trades – And It’s Not Your Fault. The market is ruthless. You analyze charts, test strategies, follow indicators—yet profits slip through your fingers. Why? Because traditional trading forces you to guess. What if you didn’t have to? Most strategies are based on hope, not proof. You wouldn’t gamble your money in a casino, so why trade without statistical certainty? TRADE EXTRACTOR Changes Everything. This is not just an indicator. It’s
Eurusd Decoder EA MT4
Philip Pankaj Suthagar
4 (1)
EURUSD DECODER EA   is a fully automated mid-term, medium-risk expert advisor. Adaptive price pattern analysis is used to identify potential trade entries and exit. The EA does not use any unfair money management practices like grid and martingale. Each position includes a stop loss and all open positions are monitored by an advanced loss control algorithm, which decides when to close profit and when to accept loss.   Before you buy all of my product please be aware of the risks involved: 1) Pl
Quant Stress Scanner
Philip Pankaj Suthagar
The Knowledge of which Geometry aims is the knowledge of the Eternal - Plato Quant Stress Scanner is a Scientifically developed Stress detection algorithm along the geometrical lines on the price data which are quantified into Stress repulsion, fractures and clusters in a easily understandable signal form. Each signal are displayed in well-arranged with currency pairs in row-wise and timeframes in column-wise manner. Explanation of signal and plotting stress levels with trendlines are shown in
Rsi Decoder MT5
Philip Pankaj Suthagar
Inspired from, Time is the most important factor in determining market movements and by studying past price records you will be able to prove to yourself history does repeat and by knowing the past you can tell the future. There is a definite relation between price and time. -William Delbert Gann   Caution:   It's not HolyGrail System, It's a tool to give you insight of current market structure. The decision to trade is made only with combination of economical understanding of underlying instru
Owl Craft Pro
Philip Pankaj Suthagar
Owl Craft Pro is a powerful scalping strategy that employs a smart entry and exit algorithm as well as sophisticated filtering algorithms to discover just the safest entry points during market calms. This approach is designed to provide long-term, consistent growth. It is a professional tool that incorporates all of the latest trading advancements. There's nothing fancy about this, no Holy Grail testing, no "risk-free martingale," just a rigid rule-based method to trading that allows you to maxi
筛选:
Yusuf Hamzah
903
Yusuf Hamzah 2023.11.19 07:28 
 

It is a historical pattern recognition matcher. Like RSI Decoder, it would be great if size of the font and box can be changed to fit user preference. As it is, it takes too much space on the chart.

Seyed Mani Ashraf Pour Shoshtar
1082
Seyed Mani Ashraf Pour Shoshtar 2023.08.10 06:27 
 

用户没有留下任何评级信息

Philip Pankaj Suthagar
6669
来自开发人员的回复 Philip Pankaj Suthagar 2023.09.20 16:55
Hi sir, I have given oscillator for finding the entries in history and nothing is repainting here. You have to keep note of tp and sl. Thanks Version 3.0: Signal verification in history feature added
Suresh Patil
143
Suresh Patil 2023.08.05 07:54 
 

用户没有留下任何评级信息

Philip Pankaj Suthagar
6669
来自开发人员的回复 Philip Pankaj Suthagar 2023.08.10 07:38
Thanks for your kind words Suresh
amayr
35
amayr 2023.05.30 21:05 
 

用户没有留下任何评级信息

Philip Pankaj Suthagar
6669
来自开发人员的回复 Philip Pankaj Suthagar 2023.05.30 21:41
Thank you Amayr. Happy Trading !
回复评论