• 概述
  • 评论
  • 评论
  • 新特性

YiiYnn lines to predicate the change of trending

—— 进入本指标前,请谨记:『不易,变易』。拔开数理统计的枝叶,变化是不变的定理才是本指标的由来和内涵思想。本指标只应指明变化到不变之间的契机。

本指标——阴阳线指标(YiiYnn)由一条粗蓝色实线和一条细烟绿色虚线构成,粗实线叫阳线(Ynn),作为主线,细虚线叫阴线(Yii),作为辅线。本指标不同DeMarks去搜索哪个周期的最高最低,也不同Stoch那样告诉你超买超卖超过后缩小再等超买超卖直至资金的尽头。本指标是分析价格减速动态均值线的(偏)相关性及自相关性,并采用标准差的方法进行滤波以求趋势示意更明朗。所以,本指标有以下特性:

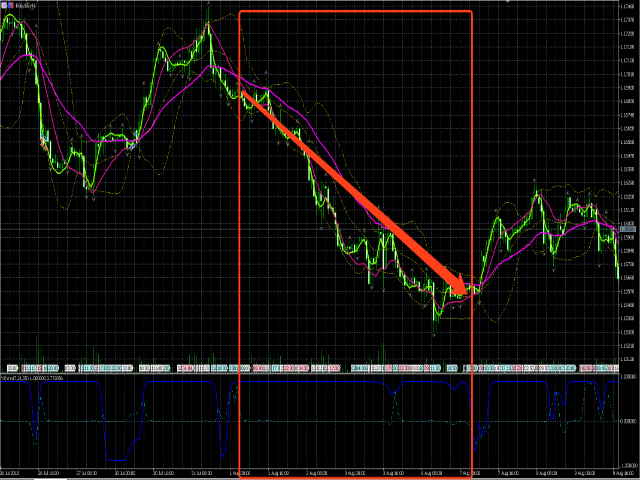
  1. 指标依据波浪理论,有二阶线性插值模拟组合多条均线(开收高低)构建波浪动力并分析它们各自相关性,所以将对趋势有很好的预测性——与MACD、ATR等相比。它并非只让我们看到趋势的尾巴,请参考最后一张示例图;
  2. 指标采用简单的方差进行差相过滤,在兼顾计算性能的同时让盘整阶段的指示更明朗;
  3. 阳线与阴线之间是偏相关差相,具有阴消阳长相互激励、抵消的特点,因此命名;
  4. 本指标中判定的趋势与常人所称『趋势』不同,本指标中的趋势包括:上涨、下跌和横盘。不要忽略横盘,它也是一种具有前进动力的趋势,掌握得好,可以在盘整中赢利。

使用方法:

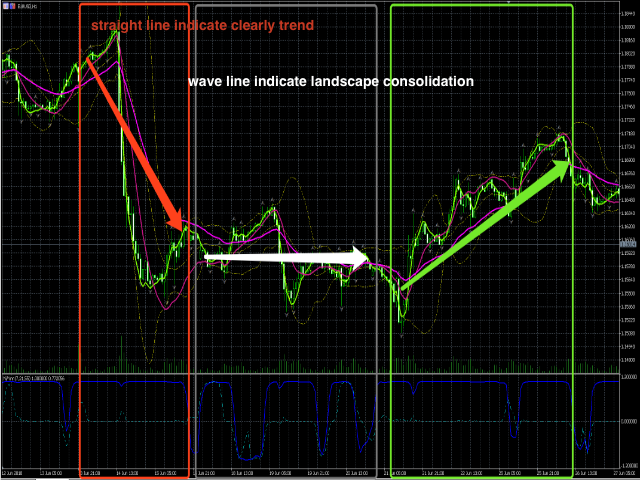
  1. 当双线都为平稳直线平衡前进时(阳线为1,阴线为0),表明当前价格具有相当平衡的趋势(上涨、下跌、橫盘),可以按观察到的方向开仓即可。如果有合理的通道线辅助,也可以放心开回归的订单;
  2. 当阳线突然下潜到0线而阴线懒于变化时,先不需要慌,这通常只是微小的动荡,并且相信你当前的单子并不亏损,如果入场不晚的话;
  3. 当阳线下潜到0线并继续快速下钻,并且阴线也作出了变化,这时你真的需要考虑出场了,万万不可恋战,即使以后证明这只是个抑扬顿挫虚惊一场;
  4. 当双线都在反复上下震荡时,是盘整时的混战,阴阳互搏,我会退避三舍。记得:『龙战于野,其血玄黄』,这是混沌的力量比趋势倾向力量更强大的时候。

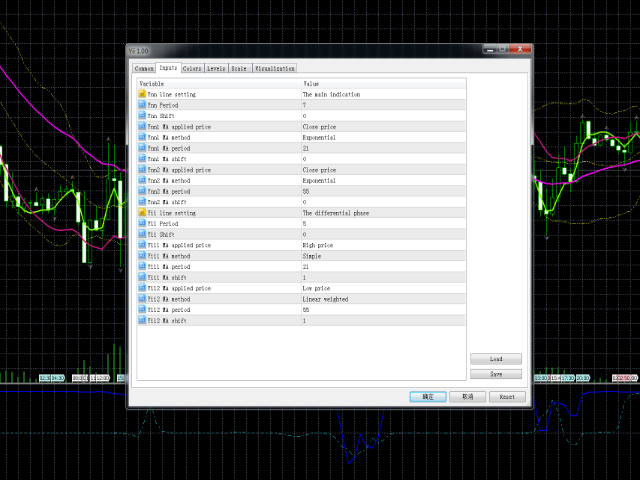
总之,当阴阳双线都安静地平衡前进时,你可以顺应方向入场盈利。当双线不安分的时候,你最好出场隔岸观火为妙。以下附上参数表:

  • Ynn Period - 阳线计算周期,越短对波动越敏感,过长则会丢失横盘识别;
  • Ynn Shift - 阳线迟化周期,1表示当前只观测上一根柱线及更旧的数据;
  • Ynn1 MA applied price - 参与阳线拟合的慢速均线计算价格;
  • Ynn1 MA method - 参与阳线拟合的慢速均线计算方法;
  • Ynn1 MA period - 参与阳线拟合的慢速均线计算周期;
  • Ynn1 MA shift - 参与阳线拟合的慢速均线迟化周期;
  • Ynn2 MA applied price - 参与阳线拟合的快速均线计算价格;
  • Ynn2 MA method - 参与阳线拟合的快速均线计算方法;
  • Ynn2 MA period - 参与阳线拟合的快速均线计算周期;
  • Ynn2 MA shift - 参与阳线拟合的快速均线迟化周期;
  • Yii Period - 阴线计算周期,无论过长过短,都能影响趋势变化契机的识别;
  • Yii Shift - 阴线迟化周期,同上述。它可以调整价格变动频度对趋势虚实的判别性能; 
  • Yii1 MA applied price - 参与阴线拟合的慢速均线计算价格;
  • Yii1 MA method - 参与阴线拟合的慢速均线计算方法;
  • Yii1 MA period - 参与阴线拟合的慢速均线计算周期;
  • Yii1 MA shift - 参与阴线拟合的慢速均线计算迟化周期;
  • Yii2 MA applied price - 参与阴线拟合的快速均线计算价格;
  • Yii2 MA method - 参与阴线拟合的快速均线计算方法;
  • Yii2 MA period - 参与阴线拟合的快速均线计算周期;
  • Yii2 MA shift - 参与阴线拟合的快速均线计算迟化周期。

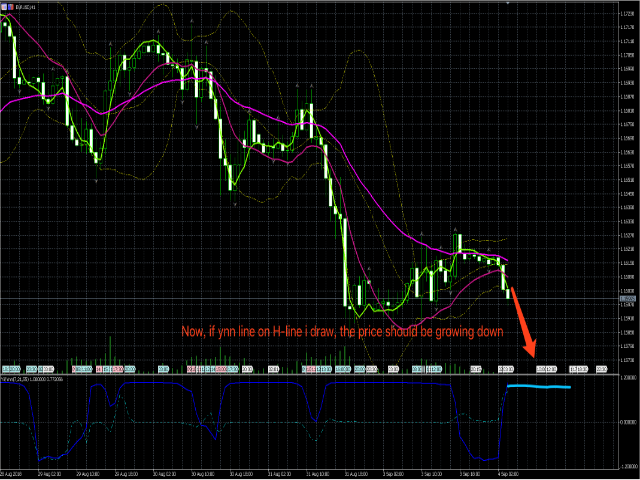
最后,再次谨重说明:本指标只应指明变化到不变之间的那一点契机,方向性请观察价格或者简单的均线即可。不能仅凭单一的本指标出入场。所有对下一秒的事理推测均非事实,请不要沉溺迷信于本指标,市场有风险,请务必在自己能承受的范围内进行交易指标只是指示,交易是个人主观决定,无论盈亏本指标作者均不参与,也不负法律之责任!

附:截图为EURUSD H1 9月4日 中欧时间am 2点左右

推荐产品
Gann Zone Pro MT5
Kirill Borovskii
This indicator identifies and displays zones, as it were areas of strength, where the price will unfold. The indicator can work on any chart, any instrument, at any timeframe. The indicator has two modes. The indicator is equipped with a control panel with buttons for convenience and split into two modes. Manual mode: To work with manual mode, you need to press the NEW button, a segment will appear. This segment is stretched over the movement and the LVL button is pressed. The level is displayed
Smooth price for Monarch
Konstantin Gruzdev
5 (1)
The Smooth Price technical indicator is used for plotting a smoothed line as close to the price of the financial instrument as possible, and serves to eliminate its noise components. The indicator is part of the Monarch trading system, but here it is presented as an independent technical analysis tool. The indicator is based on the cluster digital filter , which, unlike the ClusterSMA , is applied directly to the price time series. Smooth Price does not redraw (except the very last, zero bar) an
MarketMagnet
Kelly Adediran Raymond
Are you ready to take your trading journey to new heights? Look no further than MarketMagnet, this groundbreaking indicator designed to propel your trading success with excitement and accuracy. Powered by the convergence of Momentum and CCI (Commodity Channel Index), MarketMagnet equips traders with the ultimate tool to determine direction and entry prices for a wide range of recommended currency pairs and instruments. It is designed for traders seeking to scalp for a few pips on lower timeframe
The indicator is designed to work on any trading platform. The program is based on proprietary algorithms and W.D.Ganna's mathematics, allowing you to calculate target levels of price movement based on three points with the highest degree of certainty. It is a great tool for stock trading. The indicator has three buttons: NEW - call up a triangle for calculation. DEL - delete the selected triangle. DELS - completely remove all constructions. The probability of achieving the goals is more than 80
Limitless MT5
Dmitriy Kashevich
Limitless MT5 is a universal indicator suitable for every beginner and experienced trader. works on all currency pairs, cryptocurrencies, raw stocks Limitless MT5 - already configured and does not require additional configuration And now the main thing Why Limitless MT5? 1 complete lack of redrawing 2 two years of testing by the best specialists in trading 3 the accuracy of correct signals exceeds 80% 4 performed well in trading during news releases Trading rules 1 buy signa
QXS Market Scanner
Netlux Digital Kft.
QuantXMarketScanner is a multi assets indicator for MT5 - Mathematical model based on 7 custom moving averages indicators  - Adaptable on Currencies, Stocks and Crypto - Automatic setup, self optimized About QuantXsystem Products: –         Simple installation & integration into MT5   –         Unlimited License after purchase (for one user) –         Automatic pattern recognition to identify the best timing and price levels. –         Trading indicators are displayed directly and automatica
SmartTrendMt5
Andrey Spiridonov
The SmartTrendMt5 trend indicator generates signals based on the principle of combined analysis of calculated reference points within the Keltner channel. The indicator plots the Keltner channel in a separate window (by default, red lines and a blue line - the middle of the channel), and also draws the histogram of calculated reference points for each candle (by default, the histogram bars are yellow). The should be attached to a chart of any timeframe and any trading symbol in the usual way.
Trend Direction ADX indicator for MT5
Renaud Herve Francois Candel
Trend Direction ADX indicator Trend Direction ADX is part of a serie of indicators used to characterize market conditions. Almost any strategy only work under certain market conditions. Therefore it is important to be able to characterize market conditions at any time: trend direction, trend strength, volatility, etc.. Trend Direction ADX is an indicator to be used to characterize trend direction: trending up trending down ranging Trend Direction ADX is based on ADX standard indicator.
Owl Smart Levels MT5
Sergey Ermolov
4.47 (36)
MT4版本  |   FAQ Owl Smart Levels Indicator 是一個完整的交易系統,包含 Bill Williams 的高級分形、構建正確的市場波浪結構的 Valable ZigZag 以及標記準確入場水平的斐波那契水平等流行的市場分析工具 進入市場和地方獲利。 策略的详细说明 指示灯使用说明 顾问-贸易猫头鹰助手助理 私人用户聊天 ->购买后写信给我,我会将您添加到私人聊天中,您可以在那里下载所有奖金 力量在於簡單! Owl Smart Levels 交易系統非常易於使用,因此適合專業人士和剛開始研究市場並為自己選擇交易策略的人。 策略和指標中沒有隱藏的秘密公式和計算方法,所有策略指標都是公開的。 Owl Smart Levels 允許您快速查看進入交易的信號,突出顯示下訂單的水平並向您發送有關已出現信號的通知。 優點很明顯: 清楚地顯示主要和更高時間框架的趨勢方向。 指示儀器信號的出現。 標記開單、止損設置和固定利潤的水平。 沒有多餘的,只有必要的結構! ZigZag 表示全球趨勢的方向,因此也表示貿易方向。 市場反轉點的短線清楚地表明在什麼水平上構建斐波
FanTrader
Syed Oarasul Islam
FanTrader is designed to trade any markets (Stocks, Forex, Commodities, Futures, Cryptos). The strategies are developed based on various Price Actions that will be observed on different Fibonacci Fan Levels. Product Home Page:  https://www.mql5.com/en/market/product/51333 ADVANTAGES: Works on any market and time frames Multiple Strategies in 4 categories:  Retracement, Breakout, Trend Follow, Reversal Trades simultaneously on any number of markets under the same account  Display Fibonacci Fa
DeviationScaledMAV1
Hicham Ait Taleb
The "Deviation Scaled Moving Average Crosses" indicator is a powerful technical analysis tool designed for the MetaTrader 5 trading platform. It facilitates informed trading decisions by visually presenting the interaction between two moving averages, both of which are smoothed and scaled to offer enhanced insights into market trends. This custom indicator is developed by mladen and is copyright-protected for the year 2023. Using a unique approach, the indicator displays two types of deviatio
BoS CHoCH FVG Indicator
Usiola Oluwadamilol Olagundoye
5 (1)
The Expert Advisor for this Indicator can be found here:  https://www.mql5.com/en/market/product/115476 The Break of Structure (BoS) and Change of Character indicator with Fair Value Gap (FVG) filter is a specialized tool designed to enhance trading strategies by pinpointing high-probability trading opportunities on price charts. By integrating the BoS and Change of Character concepts with the FVG formation, this indicator provides traders with a robust filtering mechanism to identify optimal e
FREE
Institutional Order Block
Agustinus Biotamalo Lumbantoruan
This indicator doesn't repaint & shows several things 1) Order Block 2) Imbalance candle stick (the icon is a vertical rectangle) 3) Swings (zigzag), 3 to be exact (minor, major and external major zigzags). If you know market structure, you should understand internal & external trends. Minor & major are internal trends of external major in this indicator. 4) Supply & Demand (arrow icon) 5) Major supply & demand (purple arrow) 6) Range/Bias lines (only shown in time frame 1hour & lower) 7) Previo
介绍一下BreakOut Consult,这是一款革命性的工具,将帮助您将交易提升到一个新的水平!我们的尖端算法结合了多种趋势和振荡器,生成准确的买入和卖出信号,是任何交易者的强大工具。 有了BreakOut Consult,您可以轻松地通过我们的动态通道识别市场中的突破,该通道使用支撑和阻力水平来检测突破。我们的算法检测到两种类型的突破,确保您永远不会错过任何一个黄金机会。 从上方的阻力位突破和从下方的支撑位突破。 从下方的阻力位突破和从上方的支撑位突破。 当发生买入突破时,会出现一个向上的箭头,当发生卖出突破时,会出现一个向下的箭头 - 就是这么简单! 我们的算法被设计为适用于所有市场,包括外汇、商品、股票和加密货币。无论您是短线交易者、波段交易者还是持仓交易者,BreakOut Consult都可以帮助您在任何时间框架上检测突破。 我们了解到虚假突破可能是一个真正的问题,这就是为什么我们的算法使用复杂的过滤器来减少虚假突破,使BreakOut Consult更加可靠和有效。 优缺点: 一旦信号箭头在蜡烛收盘后显示在图表上,它就永远不会消失,因此您可以对自己的交易决策有信心。 尽
The indicator predict the future candles direction, by scanning past candle movement. Based on the principal: “ The history repeat itself”. Programmed according to Kendall Correlation. In the settings menu, different scanning options are available. When the indicator find a match, start painting future candles from the current candle to the right, also from the current candle to the left as well, showing you the candle pattern what the actual signal is based on. The left side candle are option
The indicator is a gold mine that works with the MACDI strategy with alert supported by AI it working on gold 5m time frame with 92% win the stratige take 15 pip tp and 15 stop 1:1 follow us on telegram : t.me/tuq98 youtube : youtube.com/ssfx1 green color its buy with alert red color its sell with alert this indicator is one from top 10 in greece and one from top 5 in iraq
Orbit Rage Final 2
BILLY ARANDUQUE ABCEDE
Note : i only sell this EA on MQL5, any other sellers is fake. Orbit Rage Final, a cutting-edge trading strategy meticulously designed around the bull/bear candle approach and divergence analysis. This powerful tool is engineered to empower you to shape the life you desire. To embark on this transformative journey, simply download and seamlessly integrate it into your MetaTrader 4 platform by placing it in the experts advisors folder. Orbit Rage Final revolutionizes trading by offering a risk-f
SYSTEM INTRODUCTION:   The Binary Options Momentum System Is Specifically Designed For Binary Options Trading. Unlike Other Systems And Indicators That Were Adopted From Other Trading Environments For Binary Options. Little Wonder Why Many Of Such Systems Fail To Make Money . Many End Up Loosing Money For Their Users.  A Very Important Fact That Must Be Noted Is The Fact That Application Of Martingale Is not Required. Thus Making It Safer For Traders Usage And Profitability. A Trader Can Use Fi
PZ Mean Reversion MT5
PZ TRADING SLU
3 (2)
采用专业和量化方法进行均值回归交易的独特指标。它利用了价格以可预测和可衡量的方式转移并返回均值这一事实,这允许明确的进入和退出规则大大优于非量化交易策略。 [ Installation Guide | Update Guide | Troubleshooting | FAQ | All Products ] 清晰的交易信号 非常容易交易 可定制的颜色和尺寸 实现性能统计 优于大多数交易策略 显示合适的止损和止盈水平 它实现了电子邮件/声音/视觉警报 这个怎么运作 该指标从更高的时间范围测量完全可定制的移动平均线的标准偏差,并使用趋势跟踪方法精确地找到交易。交易是通过深入当前图表的价格行为发现的,并在价格返回到平均价格区间时关闭,根据您选择的更高时间范围计算。由于其编码方式,该指标将远离高波动性和强劲趋势市场,并且仅在可预测的情况下进行交易,在可接受的波动性与方向性比率范围内,回归均值是可行的。 指标剖析 绿线是更高时间范围内的移动平均线(也就是平均值) 虚线区域是移动平均线周围的典型价格区间 蓝线是看涨交易的突破价格 红线是看跌交易的突破价格 交易是针对均值进行的,并在
The Plasma Trend indicator is a simple technical indication that is used to determine the current trend direction in the market. The Plasma Trend indicator is a powerful tool for determining the direction of the trend in the Forex market. It is based on both standard technical indicators and proprietary mathematical calculations, which provides a more accurate and reliable trend determination. Its implementation in the form of lines of two colors simplifies the visual determination of a change
賺錢和研究的工具。 交易信號和策略的核心是基於作者的價格預測模式形成算法。適用於任何樂器!輔以基於 MA "九尾狐" 的控制系統,盡可能準確地更新和調整市場、儀器和工作期間的信號。 合格:所有市場中的所有工具(有例外)。 適用對象:對沖基金、基金和資產經理、投資經理、投機者、投資者和利益相關者。 ..................................................................................................................................................................................
Scalping Entry Points - is a manual trading system that can adjust to price movements and give signals to open trades without redrawing. The indicator determines the direction of the trend by the central level of support and resistance. The dot indicator provides signals for entries and exits.  Suitable for manual intraday trading, scalping and binary options. Works on all time frames and trading instruments. The indicator gives several types of alerts. How to use the product The blue line
An indicator for all timeframes with a configurable number of bars for calculating fractals. Suitable for determining extremes of both lower and higher order, by which it is possible to determine the patterns of technical analysis, as well as divergences.    The indicator has one adjustable parameter - the number of bars for extremum calculation. It is also possible to change the color characteristics.
Gyroscopes mt5
Nadiya Mirosh
Gyroscope        professional forex expert   (for EURUSD, GBPUSD, USDJPY, AUDUSD, USDCHF, EURGBP, EURJPY, NZDUSD, USDCAD, EURCHF, AUDJPY, CADJPY pairs)   alyzing the market using the Elliot Wave Index. Elliott wave theory is the interpretation of processes in financial markets through a system of visual models (waves) on price charts. The author of the theory, Ralph Elliott, identified eight variants of alternating waves (of which five are in the trend and three are against the trend). The mo
Looking for reliable levels on a price chart? Already tired of searching for similar indicators? Are the levels not working out as they should? Then this is the indicator for you. Volume Prices Universal is a reliable indicator of horizontal volumes. What does it show? First of all, the main idea of ​​the indicator is to display at which price mark the price has been for the longest time. Thus, the display of price volumes on the price chart is formed. With the help of which you can very simp
WanaScalper
Isaac Wanasolo
1 (1)
A scalping indicator based on mathematical patterns, which on average gives signals with relatively small SL, and also occasionally helps to catch big moves in the markets (more information in the video) This indicator has three main types of notifications: The first type warns of a possible/upcoming signal on the next bar The second type indicates the presence of a ready signal to enter the market/open a position The third type is for SL and TP levels - you will be notified every time price r
Hello There, Today I want to show you my new researchable fore BUY SELL indicator, it work all asset, and also work Derive Volatility asset! it work all time frame, but i recommend start 5 minute to H1 when you receive a signal just take trade and stay wait for your take profit asset All Major Pair And minor IT WORK ALSO XAUUSD Fantastic results,  for more info,,, message us thank you   
Divergence Detection: The indicator is designed to identify divergences between the price movement and the Stochastics oscillator. This can help traders spot potential trend reversals or trend continuation opportunities. Early Warning System: By capturing divergences, the Stochastics Divergence Indicator can provide an early warning of possible market turning points. This allows traders to take timely action and make informed decisions. Versatility: The indicator can be applied to various finan
Candle Pattern Finder MT5
Pavel Zamoshnikov
4.33 (6)
This indicator searches for candlestick patterns. Its operation principle is based on Candlestick Charting Explained: Timeless Techniques for Trading Stocks and Futures by Gregory L. Morris. If a pattern is detected, the indicator displays a message at a bar closure. If you trade using the MetaTrader 4 terminal, then you can download the full analogue of the " Candle Pattern Finder for MT4 " indicator It recognizes the following patterns: Bullish/Bearish (possible settings in brackets) : Hamme
该产品的买家也购买
Bill Williams Advanced
Siarhei Vashchylka
5 (3)
Bill Williams Advanced is designed for automatic chart analysis using Bill Williams' "Profitunity" system. The indicator analyzes four timeframes at once. Manual (Be sure to read before purchasing) Advantages 1. Automatically analyzes the chart using the "Profitunity" system of Bill Williams. The found signals are placed in a table in the corner of the screen. 2. Equipped with a trend filter based on the Alligator indicator. Most of the system signals are recommended to be used only accordi
Professional Scalping Tool on Deriv Attention! The indicator will be sold in limited quantities!!! Description: This trading indicator is designed for professional traders focused on scalping. Designed with the market in mind, it provides highly accurate spike trading signals. It works on the M1 timeframe and supports the following symbols: Boom 300 Index, Boom 500 Index, Boom 1000 Index, Crash 300 Index, Crash 500 Index, Crash 1000 Index. Functional Features: - Direction: - Trading is ca
"Piranha" - an autonomous trading system that determines overbought and oversold levels on the chart. Red and blue zones represent overbought and oversold levels respectively. Entry points are marked with arrows: a downward arrow in the red zone for "sell" and an upward arrow in the blue zone for "buy". The Take profit level is indicated by the green moving average. Key features: Adjusting the Take profit level as the green moving average changes position. Averaging ability when a new market e
PZ Swing Trading MT5
PZ TRADING SLU
5 (4)
Swing Trading 是第一个旨在检测趋势方向的波动和可能的反转波动的指标。它使用在交易文献中广泛描述的基准摆动交易方法。该指标研究多个价格和时间向量,以追踪总体趋势方向,并检测市场超卖或超买并准备好进行修正的情况。 [ 安装指南 | 更新指南 | 故障排除 | 常见问题 | 所有产品 ] 市场波动的利润不会被窃取 指示器始终显示趋势方向 彩色价格带代表机会基准 彩色虚线表示可能的反转波动 该指标分析其自身的质量和性能 它实现了一个多时间仪表板 可定制的趋势和波动周期 它实现了电子邮件/声音/推送警报 指示器为非重涂或重涂 什么是摇摆交易 摇摆交易是一种尝试在一天到一周内从证券中获得收益的交易方式,尽管某些交易最终可以保持更长的寿命。摇摆交易者使用技术分析来买入弱点和卖出力量,并有耐心等待这些机会的发生,因为在发生一波抛售浪潮之后购买证券而不是陷入抛售更有意义。 机会基准 关于历史数据的大量研究证明,适合于波动交易的市场倾向于在基线价格带上下交易,基线价格带由图表显示,使用平均真实区间计算得出。波动交易者使用基线,该策略是购买常态和卖出躁狂,或做空常态并掩盖沮丧。
IVISTscalp5
Vadym Zhukovskyi
5 (3)
我们向您介绍iVISTscalp5指标,它不仅独特,而且在交易操作中也非常有效。该指标基于时间数据,是多年金融市场经验和深入分析的结果。iVISTscalp5指标是手动交易的优秀工具。便利性、简单性和可视化 - 所有的复杂性都隐藏在内部。我们将iVISTscalp5指标的设置和使用简化到了最大程度。该指标适用于MT5终端中您所拥有的所有金融工具。 操作时间为UTC+3的早上4点到晚上8点。 iVISTscalp5指标菜单(见截图1): History - 计算行情的周数 dT_min - 选择时间间隔的时间(分钟) TFline - 绘制水平成交量(时间帧) BARSline - 绘制水平成交量(条数) TFtrend1 - 绘制日线通道(时间帧) BARStrend1 - 绘制日线通道(条数) TFtrend2 - 绘制周线通道(时间帧) BARStrend2 - 绘制周线通道(条数) ALERT_TIMER - 设置闹钟 ALERT - 开启/关闭闹钟 Save - 开启/关闭将时间记录到文本文件。 图表上的红色和蓝色旗帜表示时间(VIST智能剃须系统的信号)。卖出信号为红旗,买入
PZ Harmonacci Patterns MT5
PZ TRADING SLU
3.25 (4)
可以说,这是您可以为MetaTrader平台找到的最完整的谐波价格形成自动识别指标。它检测19种不同的模式,像您一样认真对待斐波那契投影,显示潜在的反转区域(PRZ),并找到合适的止损和获利水平。 [ 安装指南 | 更新指南 | 故障排除 | 常见问题 | 所有产品 ] 它检测19种不同的谐波价格形态 它绘制了主要,衍生和互补的斐波那契投影(PRZ) 它评估过去的价格走势并显示每个过去的形态 该指标分析其自身的质量和性能 它显示合适的止损和获利水平 它使用突破来表明合适的交易 它在图表上绘制所有样式比率 它实现了电子邮件/声音/视觉警报 受斯科特·M·卡尼(Scott M. Carney)的书的启发,该指标旨在满足最纯粹和最熟练的交易者的需求。但是,它采取了一种使交易更容易的方式:在向交易发出信号之前,它会等待Donchian朝正确方向突破,从而使交易信号非常可靠。 斐波那契投影与向量无关 它实现了电子邮件/声音/推送警报 它绘制了ABCD投影 重要提示: 为了符合 Scott M. Carney先生 的商标申诉,某些图案名称已重命名为不言自明的替代方式, Scot
TrendMaestro5
Stefano Frisetti
note: this indicator is for METATRADER4, if you want the version for METATRADER5 this is the link:  https://www.mql5.com/it/market/product/108106 TRENDMAESTRO recognizes a new TREND in the bud, he never makes mistakes. The certainty of identifying a new TREND is priceless. DESCRIPTION TRENDMAESTRO identifies a new TREND in the bud, this indicator examines the volatility, volumes and momentum to identify the moment in which there is an explosion of one or more of these data and therefore the mome
Weis Wave with Alert MT5
Trade The Volume Waves Single Member P.C.
4.93 (15)
Rental/Lifetime Package Options and Privileges  * For optimum results the yearly or lifetime package is suggested due to live training ! Rent Monthly Six Months   Yearly/Lifetime Weis Wave with Speed with Alert+Speed Index x x x Manual  x x x Quick Set up Video x x x Blog x x x Lifetime Updates x x x Setup and Training Material x x Free Rectangle Break Alert Tool      x Discord Access Channel "The SI traders" x 2-hour live methodology training x How to trade with it:    http://
RAD Real Acummulation and Distribution
Jose Alejandro Jacome Jimenez
RAD CRITICAL LEVES RAD indicator tracks “Relevant Volume” in real time, identifying accumulation and distribution processes, projecting them in the chart as SUPPORT or RESISTANCE zones. Natural   support   and resistance levels are generated by Volume Accumulation and Distribution processes. As these processes evolve, levels at which the relevant volume in the market place is positioned, become difficult areas to cross upwards or downwards. By using this information, traders can identify very s
PZ Divergence Trading MT5
PZ TRADING SLU
3.75 (4)
棘手的发现和频率稀缺是最可靠的交易方案之一。该指标使用您喜欢的振荡器自动查找并扫描常规和隐藏的发散。 [ 安装指南 | 更新指南 | 故障排除 | 常见问题 | 所有产品 ] 容易交易 发现常规和隐藏的分歧 支持许多知名的振荡器 根据突破实现交易信号 显示适当的止损和获利水平 可配置的振荡器参数 可自定义的颜色和尺寸 按条形过滤大小差异 实现绩效统计 它实现了电子邮件/声音/视觉警报 为了提供广阔的市场前景,可以使用不同的振荡器在同一张图表中多次加载该指标,而不会产生干扰。该指标支持以下振荡器: RSI CCI MACD OSMA 随机 动量 很棒的振荡器 加速器振荡器 威廉姆斯百分比范围 相对活力指数 由于差异可能会扩大很多,尤其是在外汇市场中,因此该指标产生了转折:它在等待交易突破之前等待donchian突破确认差异。最终结果是带有非常可靠的交易信号的重新粉刷指示器。 输入参数 幅度:用于寻找差异的之字形周期 振荡器-选择要加载到图表的振荡器。 突破期-交易信号的突破期,以柱为单位。 发散类型-启用或禁用发散类型:隐藏,常规或两者。 最小散度单位为条形-最
Introduction to X3 Chart Pattern Scanner X3 Cherart Pattern Scanner is the non-repainting and non-lagging indicator detecting X3 chart patterns including Harmonic pattern, Elliott Wave pattern, X3 patterns, and Japanese Candlestick patterns. Historical patterns match with signal patterns. Hence, you can readily develop the solid trading strategy in your chart. More importantly, this superb pattern scanner can detect the optimal pattern of its kind. In addition, you can switch on and off individu
PZ Trend Trading MT5
PZ TRADING SLU
3.67 (3)
许多盈利交易者不仅知道如何识别市场趋势,而且也能把握趋势建立后的交易机会。 Pz 趋势交易 指标设计用来在趋势行情中尽可能的赚取利润。 已建立的趋势提供了一揽子交易机会,但大多数趋势交易指标完全忽视了它们,让交易者在趋势行情时完全不知道该如何做!一般趋势指标只通知有关的趋势变化,但根本不足以得到卓越的回报. Pz 趋势交易 指标比一般趋势指标显示多达 20 倍的交易 , 因为它注重所谓的市场时机。它不仅显示当前的市场趋势,也有回调,内柱线的突破和调整。它令您在趋势回调之后介入,安全的柱线内突破金字塔加仓,以及发现潜在的反转,和已知的调整。 趋势改变 一个趋势改变在市场方向变化时发生。趋势变化在图表上用带数字的彩色圆圈显示。蓝色 (1) 信号为上涨开始, 而红色 (1) 信号为下跌开始。趋势变化并非评估当前价格动作的结果, 它意味着交易设置是不定时地。如果您正确使用本指标, 在趋势变化时, 您将将已经入场 (参看下面的调整)。 回调 但凡趋势在运动中,行情上下抖动,盈利者收割利润,且其它参与者入场。趋势回调代表好的买入机会,通常是由主力获利离场导致。如果行情在回调后回归上行, 指
Big Player Range
Thalles Nascimento De Carvalho
5 (2)
欢迎使用"BigPlayerRange"指标,这是一款技术分析工具,旨在识别市场中金融机构关注的重要区域。该指标提供了对大型市场参与者表现出相当活跃和关注的价格范围的精确分析。 主要特点: 1. 机构兴趣区域映射: "BigPlayerRange" 准确地突出显示金融机构表现出强烈活动的图表区域。这些点具有战略重要性,提供了对可能市场走势的见解。 2. 投影作为退出参考:除了识别关注区域,该指标还使用投影作为两个不同阶段可能退出的参考。这些投影帮助投资者基于未来可能的价格方向规划策略。 3. 返回到识别范围时的回撤概率: "BigPlayerRange" 的一个独特功能是当价格返回到关注范围时计算回撤概率。这有助于评估潜在的趋势反转。 如何使用 "BigPlayerRange": - 辨识关注区域:使用该指标辨识金融机构活动较多的区域。这些点可能对于预测重大波动至关重要。 - 投影作为退出参考:在计划市场退出时,使用投影作为参考。这些投影提供在关闭仓位时可能价格方向的见解。 - 评估回撤概率:在价格返回到已识别范围时注意回撤的概率。这有助
AI Binary Sniper
Angelo Capoferri
基於人工智慧的指標,可產生二元期權的可能的看漲期權和看跌期權條目。 此指標適用於 3 種不同的策略: 1) 透過讀取交易量,它會在價格應該反轉時發出訊號 2)透過價格和成交量之間的背離,發出趨勢何時繼續或反轉的信號 3)透過價格和成交量之間的收斂,它發出了趨勢何時應該繼續的信號。 此指標適用於所有時間範圍,但在 3 分鐘或 5 分鐘期限內獲得最佳結果(因為在低時間範圍內會出現機構攻擊)。 最佳時間是流動性較大的時間,即格林威治標準時間 7 點至 18 點。 雖然該指標產生超過 70% 的正確訊號,但您可能會遇到操縱價格或相互排斥的機構之間的爭鬥,從而產生一系列錯誤訊號,因此我們建議使用充分的資金管理(例如 Masaniello )...
PZ Day Trading MT5
PZ TRADING SLU
2.83 (6)
该指标仅使用价格行为分析和donchian渠道以锯齿形检测价格反转。它是专门为短期交易而设计的,根本不需要重新粉刷或补漆。对于精明的交易者来说,这是一个绝佳的工具,旨在增加他们的运作时间。 [ 安装指南 | 更新指南 | 故障排除 | 常见问题 | 所有产品 ] 极易交易 它在每个时间段都提供价值 实施自我分析统计 它实现了电子邮件/声音/视觉警报 基于可变长度的突破和拥挤区域,该指标仅使用价格行为来选择交易并对市场快速做出反应。 显示过去信号的潜在利润 该指标分析其自身的质量和性能 突围的损失突出显示并解决 该指标是不可重涂和不可重涂的 该指标将帮助盘中交易者不要错过单个价格反转。但是,并非所有价格反转都是一样的,也不是具有相同的可行质量。决定要突破哪些突破而忽略哪些取决于交易者的良好判断。 如何解释统计数据 该指标研究其自身信号的质量,并在图表上绘制相关信息。将分析每笔交易,并在图表的左上角显示总体历史结果,这使您可以针对任何给定的工具和时间范围自行优化指标参数。每个乐器和时间表都有其自己的最佳设置,您可以自己找到它们。 最大优惠交易:对于任何给定的交易,MFE都是
VTrende Pro
Andrii Diachenko
5 (1)
VTrende Pro - MTF indicator for trend trading with a display panel for MT5 *** Videos can be translated into any language using subtitles (video language - Russian) Although the signals of the VTrende Pro indicator can be used as signals of a full-fledged trading system, it is recommended to use them in conjunction with the Bill Williams TS. VTrende Pro is an extended version of the VTrende indicator. Difference between Pro version and VTrende: - Time zones - Signal V - signal 1-2 waves
SMCpro
Arief
5 (1)
SMCpro MT5  Original Price  $440   ---  Currently Price  40% OFF  ( for unlimited use ) Hello World! Introducing.. SMCpro tool and Indicator for  MetaTrader 5 , a cutting-edge feature designed to revolutionize your trading experience. With innovative ICT Smart Money Concept, you gain unparalleled insight into market dynamics, empowering you to make informed trading decisions like never before. Built on the foundation of advanced algorithms and real-time data analysis, SMCpro tool and Indicat
Tatino Super Signals is Non Repaint Indicator for Binary Option trading and Forex trading. Recommendations: Timeframe: All timeframes. For best results we recommend using it on M1, M5 and M15 timeframes. Currency pairs: All Pairs Account type: All Type Broker time: Any Brokers : Alls Binary Trading : Expired 1 Candle Buffer Buy=1, Sell=0, Entry Next Candle Recommended Forex trading stop loss : 15 pips Recommended  Forex tradingTake profit levels : 15 pips Specifications: Does not repaint  
How to use Pair Trading Station Pair Trading Station is recommended for H1 time frame and you can use it for any currency pairs. To generate buy and sell signal, follow few steps below to apply Pair Trading Station to your MetaTrader terminal. When you load Pair Trading Station on your chart, Pair Trading station will assess available historical data in your MetaTrader platforms for each currency pair. On your chart, the amount of historical data available will be displayed for each currency pai
ZigZag de Suavizador
Cesar Juan Flores Navarro
Teniendo una entrada de precios suavizados, los cuales son procesador por un ZigZag en tiempo real, dando como resultado un suavizador ajustado a un ZigZag. Con valores de entrada (periodo) mayores se vuelve un poco lenta en M1,, Ideal para H1, H4, D1 Trabaja bien con otros suavizadores, ya que su intersección es ideal Al iniciar empiza con mayor precisión desde el momento de activación, siendo el historial (anterior) de referencia ----------------------------------------------------------------
Recommended TimeFrame >= H1. 100% Non Repainted at any moment.  Use it carefully, only with Trend Direction. Trading Usage: 2 Variants: as Range System or as BreakOut System (Both Only With Trend Direction)::: (Always use StopLoss for minimise Risk); [1] as Range System: (Recommended) in UP TREND:  - BUY in Blue Line , then if price goes down by 50 points (on H1) open Second BUY.   Close in any Profit you wish: TrailingStop(45 points) or Close when Price touches upper Gold Line. in DOWN TR
Super Suavizador
Cesar Juan Flores Navarro
Indicador en MQL5 que obtiene el promedio de 10 EMAS que son alineadas y procesadas según Fibonacci luego el promedio es suavizado"  Se ingresa un número de 2 a N que multiplica los EMA-Fibonacci y por consiguiente aumenta los fibonacci, resultando un promedio.   Se ingresa un número que suaviza los EMA-Fibonacci. Considerando los números 1/1 seria la suavización minima. Considerando los números 3/5 seria la suavización media. Considerando los números 10/30 seria la suavización alta.....etc
Entry Pro
Bartlomiej Tadeusz Tomaja
Entry Pro Indicator is a powerful multi-functional trading tool designed to increase your market entry accuracy. It combines the power of several key market trend indicators, including ATR Trailing Stop and both fast and slow EMA, to provide comprehensive market insight. It offers easy-to-interpret market entry signals represented by colored arrows. Also, it's fully customizable, allowing you to adjust ATR and EMA periods to suit your trading strategy. Trend filters and alerts can be toggled on
BookMap HeatMap
Roberto Spadim
1 (3)
This Indicator creates a heatmap based on depth of market of the current symbol or another symbol. Other symbol is useful when you trade futures market and a contract has 'mini' and 'full' split. For example, in Brazil (B3 - BMF&Bovespa), WDO and DOL are future Forex contract of BRL/USD (where 1 DOL = 5 WDO) and big banks work mostly with DOL (where liquidity is important). Please use with M1 timeframe , objects are too small to be displayed at higher timeframes (MT5 limit). The number of level
Классификатор силы тренда. Показания на истории не меняет. Изменяется классификация только незакрытого бара. По идее подобен полной системе ASCTrend, сигнальный модуль которой, точнее его аппроксимация в несколько "урезанном" виде, есть в свободном доступе, а также в терминале как сигнальный индикатор SilverTrend . Точной копией системы ASCTrend не является. Работает на всех инструментах и всех временных диапазонах. Индикатор использует несколько некоррелируемых между собой алгоритмов для класси
Gartley Projections D
Oleksandr Medviediev
3 (2)
具有经过验证的概念和盈利能力的最佳、最有效、可靠的产品。感谢您的考虑。  该指标根据H.M.Gartley的发展(《股票市场利润》,1935年)识别和确认谐波模式(XABCD)。 它将D点投影为透视投影中的一个点(在设置中指定ProjectionD_Mode = true)。 不会重绘。当工作时间段的柱形图关闭时,如果已识别的模式点在Patterns_Fractal_Bars柱中未移动,则在图表上出现一个箭头(指向预期价格运动的方向)。从此刻起,箭头将永久保留在图表上。 注意:连续出现2-3个或更多箭头 - 这是市场条件的变化,而不是重绘。 总共有85种模式(包括Gartley-222和Gartley-222WS,完整列表可在评论部分的Google Drive链接中找到)。在所有已识别的模式中,只有最新识别的模式填充了单一颜色。 参数 DrawPatterns(true/false)- 以实心颜色绘制模式 ProjectionD_Mode(true/false)- 定义D点作为透视投影模式 Patterns_Fractal_Bars - 在认定为形成分形
Currency Index Watcher is a simple and user-friendly tool for whoever wish to trade Forex using currencies indexes. Currency Index Watcher is configurable and usable directly from the panel. Indexes of 8 custom currencies EUR, USD, GBP, JPY, CHF, AUD, CAD, NZD (default) Any 3-chars symbol from your market watch could be used (BTC = bitcoin, RUB = ruble, CNH = yuan etc ...) : double click the symbol label  Ability to select which currencies and made-of pairs will be analyzed : check/uncheck want
Quantum Currency Strength Indicator for MT5
QUANTUM TRADING SOFTWARE LIMITED
If there is only one MT5 indicator you ever buy for trading forex – this has to be it. Your success as a forex trader depends on being able to identify when a currency or currency pair is oversold or overbought. If it is strong or weak. It is this concept which lies at the heart of forex trading. Without the Quantum Currency Strength indicator, it is almost impossible. There are simply too many currencies and too many pairs to do this quickly and easily yourself. You need help! The Quantum C
Matreshka
Dimitr Trifonov
5 (1)
Matreshka self-testing and self-optimizing indicator: 1. Is an interpretation of the Elliott Wave Analysis Theory. 2. Based on the principle of the indicator type ZigZag, and the waves are based on the principle of interpretation of the theory of DeMark. 3. Filters waves in length and height. 4. Draws up to six levels of ZigZag at the same time, tracking waves of different orders. 5. Marks Pulsed and Recoil Waves. 6. Draws arrows to open positions 7. Draws three channels. 8. Notes support and re
Forex Relative Performance indicator This indicator calculates the relative strength of major currencies against the US dollar. The basic idea behind this indicator is "to buy strong currency and to sell weak currency". This indicator allows you to quickly identify the best forex pair to trade according to your trading style (Intraday, Scalping, Swing, or Long Term)
筛选:
无评论
回复评论
版本 1.1 2018.09.13
Optimized:
1. Update indicator's default parameters so that predicating more accurate.
2. Rebuild codes of kernel function to calculate the lines, pull big up performance.
3. Add an extra line to help reading Yii-Ynn lines' correlation, so we can only refer to the red line on program or by eyes to predicate the changing of new trend.
4. And more detail of coding.