Alert Stochastic
- 指标
- 版本: 140.417
- 激活: 5

Modification of the Stochastic indicator with several types of alerts added to aid in your search for better opportunities in the market.
Product Features
- Email Alert
- Sound alert
- Push Notification (Alerts can be sent to your mobile phone)
- Signs on chart
- Alert box
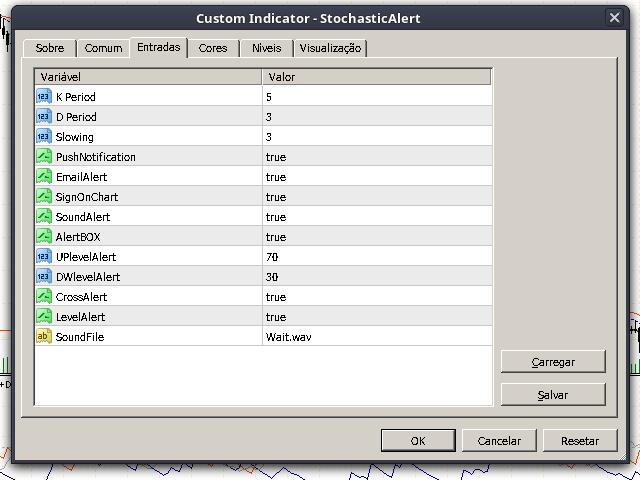
Indicator Parameters
- Push Notification - This option enables your MetaTrader 4 to send alerts to your smartphone (IOS or Android).
- Email Alert - Configure your alerts to receive in your e-mail adress.
- SignOnChart - Enable drawing alerts on your chart.
- Sound Alert - Enable sound alert on cross or level mode.
- Alert Box - Enable simple alert box on events.
- CrossAlert - Enable alert on crossing Sign with Main indicator.
- UpLevelAlert / DwLevelAlert - Configure the range Max and Min of indicator level to alert you.
- LevelAlert - Enable alert on crossing the levels configured above.
- SoundFile - File that you like to play on sound alert mode.