WWCS Trade Information Indicator
- 指标
- 版本: 1.0
- 激活: 5

The WWCS Trade Information Indicator is designed to assist you with money management and provide you with important information about a currency pair both before taking a trade and after your trade is in progress. The trade information (such as recommended lot size for a desired percentage of your account equity, the amount of money at risk, etc.) takes quite a bit of time and knowledge to calculate and, because of the speed at which prices change, is out of date as soon as you've calculated it. The WWCS Trade Information Indicator eliminates this problem by calculating and displaying the relevant values every time a tick comes in.
The information provided for each trade is as follows:
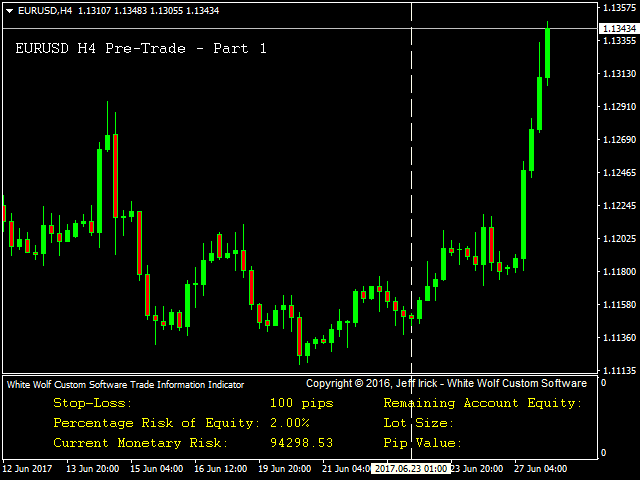
Pre-Trade
- Stop Loss
- Percentage Risk of Equity
- Current Monetary Risk
- Remaining Account Equity
- Lot Size
- Pip Value (Note: This is the monetary value of a one pip movement for the entire trade.)
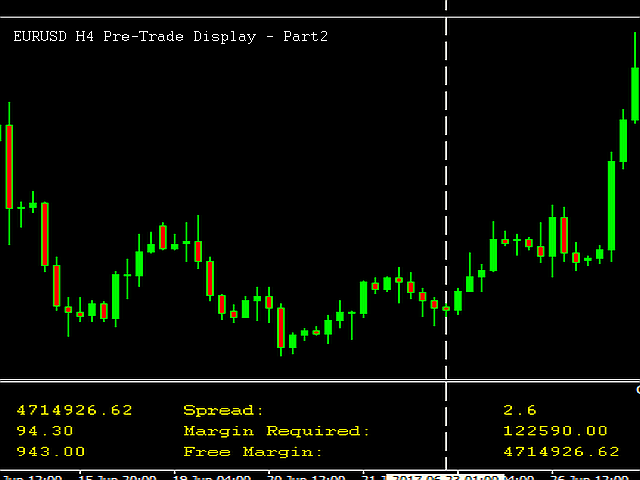
- Spread
- Margin Required
- Free Margin
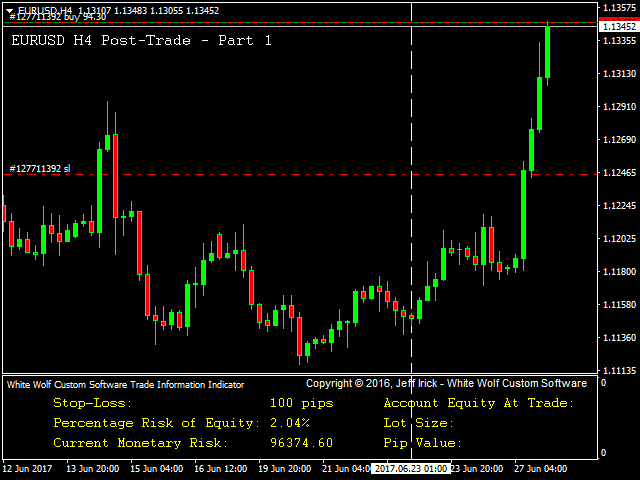
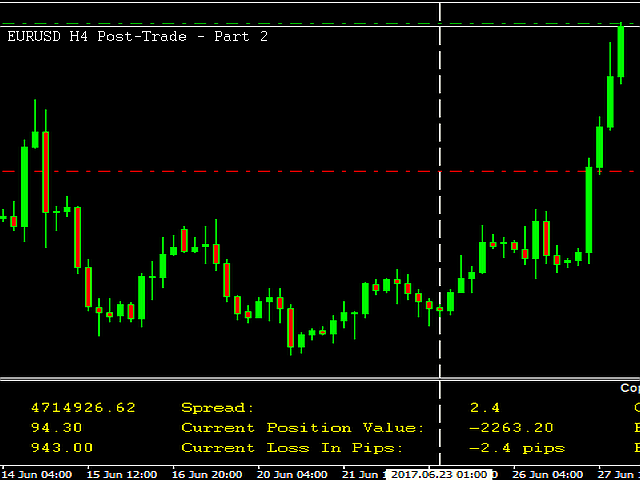
Post-Trade
- Stop Loss
- Percentage Risk of Equity (Note: This is the risk at the time you initiated the actual trade.)
- Current Monetary Risk
- Account Equity At Trade (Note: This the account equity at the time you initiated the trade.)
- Lot Size
- Pip Value
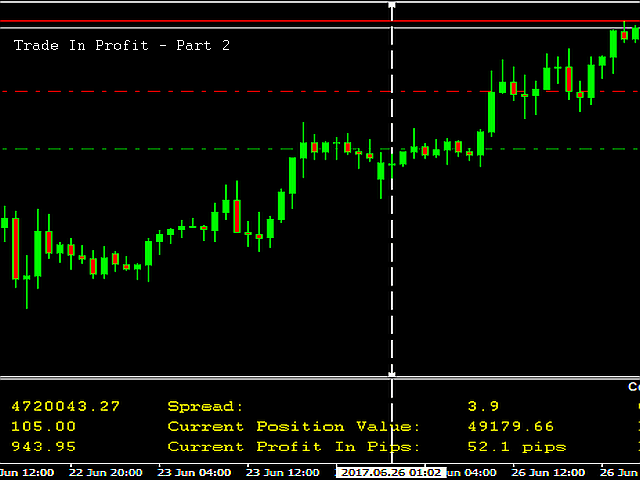
- Spread
- Current Position Value (Note: This is the monetary value of your position as of the current tick.)
- Current Profit/Loss In Pips (Note: This again is the value as of the current tick.)
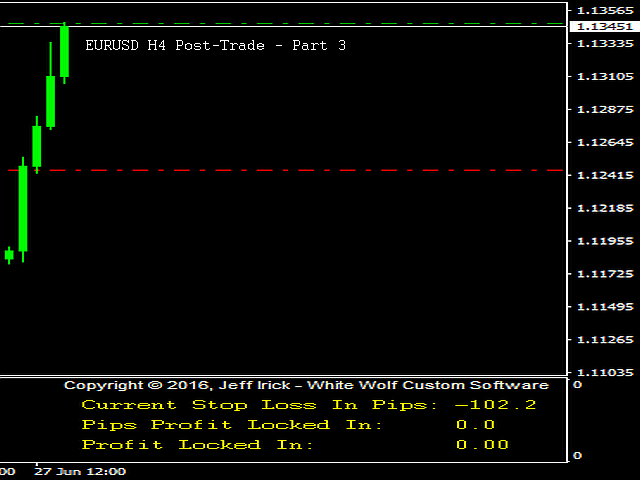
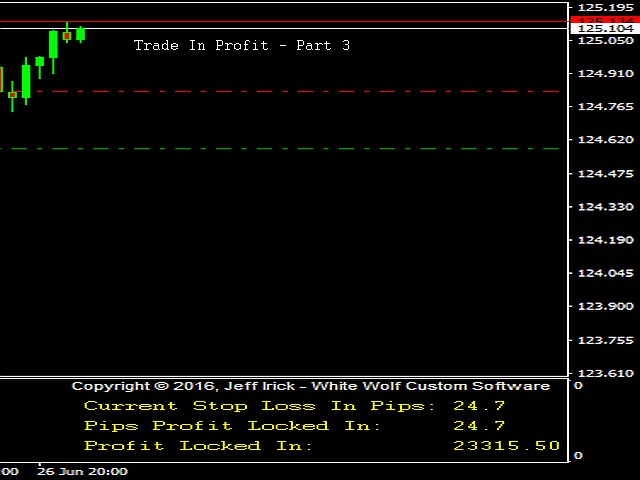
- Current Stop Loss In Pips
- Pips Profit Locked In
- Profit Locked In
Note: The last two values are calculated ONLY if your trade is in profit and you have a stop set to lock in profit. If you use a trailing stop the indicator will follow it and recalculate the values as the stop changes. In addition, if you have profit locked in, the percentage risk and monetary risk are set to zero to reflect this.
Note: You do not have to trade the lot size recommended by the indicator. If you choose to trade a different lot size, the indicator will pick up on the change and all information will be adjusted and recalculated according to the lot size you choose.
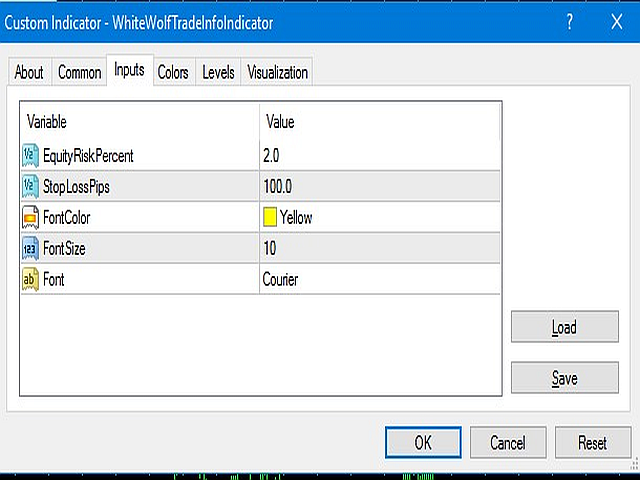
Indicator Parameters
- Equity Risk Percentage
- Stop Loss Pips
- Font Color
- Font Size
- Font
Important: You may set all these parameters to your liking. However, the Risk Percentage and Stop Loss MUST be set in order for the indicator to correctly calculate the information it displays. In addition, however you initiate a trade, you MUST set an initial stop loss for it that agrees with the value you set for the indicator. If you don't do this, the indicator will not work correctly. As mentioned above, if you choose to trade a different lot size than recommended by the indicator, all information displayed will be adjusted accordingly.
Note: If you are trading and setting your initial stop loss manually, you may see some calculated values that don't agree exactly with what you expect. The difference in monetary values won't be much if your stop loss is close to what you specified in the indicator. The reason you will see this is that the indicator uses the stop loss that the broker has to do its work. You can eliminate this issue by adjusting your trade stop loss to agree exactly with the value you specified in the indicator.
Important: The indicator is designed to work with one trade per currency pair only. If you like to scale into your trades it will only display the information for the first trade you took. If you use a partial “take profit” it will pick up on that and display the information of the remainder of the trade.
Summary: The WWCS Trade Information Indicator provides you with a wealth of real time information both pre- and post-trade that you cannot possibly calculate manually. This is a very versatile and helpful tool that should be an integral part of every trader's arsenal.