Osama Echchakery / 卖家
已发布的产品
"GA Moving Average"("GA 移动平均线")是一个移动平均线交叉策略的专家顾问(EA),它具有可调整的设置,可根据您的想法打造完美的交易策略。
"GA Moving Average"的核心概念是利用移动平均线指标来识别潜在的交易机会。通过分析不同移动平均线之间的相互作用,该EA旨在生成市场上的买入和卖出信号。
主要特点和自定义选项: 1. 移动平均线参数:交易者可以定义特定的移动平均线期数(短期和长期),以适应其交易风格和偏好。这提供了灵活性,以适应不同的市场条件和时间框架。
2. 交叉信号生成:该EA监控短期移动平均线与长期移动平均线的交叉。当短期移动平均线向上穿过长期移动平均线时,生成一个看涨信号,表示可能的买入机会。相反,当短期移动平均线向下穿过长期移动平均线时,生成一个看跌信号,表示可能的卖出机会。
3. 风险管理:该EA包含风险管理功能,允许交易者控制市场风险敞口。用户可以指定交易手数、止损和止盈水平等参数,以管理风险并保护交易资本。
4. 可自定义参数:"GA Moving Average"提供一系列可调整的参数,用于优化策略。交易者可以尝试不
FREE

Jesus XAUUSD is a professional Gold trading EA built specifically for XAUUSD, using advanced price-action pattern recognition and multi-timeframe analysis to deliver stable, accurate entries on Gold. This Expert Advisor is engineered for traders seeking a true institutional-grade XAUUSD robot with real candlestick logic, tested through over 100,000 optimization cycles. - REAL SIGNAL: 5K Live Signal : Click Here Gold is fast, aggressive, and unforgiving… but with the right strategy, it becomes

Infi Trade: 使用先进自动化技术彻底改变您的交易方式 释放自动化交易的力量: Infi Trade是一款为追求效率和盈利性的外汇市场交易者设计的尖端专家顾问(EA)。我们的EA利用复杂的网格对冲策略来最大化您的交易机会,提供无缝的自动化交易体验。 智能网格对冲策略: Infi Trade的核心是我们创新的网格对冲策略。这种方法灵活地放置和管理交易,通过在不同价格水平创建交易网格来利用市场波动。EA能够动态地适应市场条件,旨在确保利润的同时减轻风险。 全自动化,无压力交易 :Infi Trade实现全自动操作。一旦设置完成,它就会接管交易过程,在24/7不间断分析市场。这意味着您可以享受交易的好处,而无需不断监控市场,为其他重要活动腾出时间。 用户友好界面,简单设置 :Infi Trade既适合新手也适合经验丰富的交易者,拥有用户友好的界面。设置EA非常直接,只需要用户最少的输入。我们全面的指南确保了无论您的经验水平如何,设置过程都顺畅。 安全可靠: 安全性和可靠性是Infi Trade的首要任务。我们加入了先进的风险管理功能,以保护您的投资。EA定期经过严格测试,以确保在各种

Hello, traders! I am Jesus , the ultimate GBP trading machine . My strategy is built on thousands of optimized candle patterns, meticulously refined to extract the best setups on GBPUSD . Precision is my foundation, and my goal is simple: to dominate the GBPUSD market with laser-sharp accuracy. I’m not just an Expert Advisor—I’m a relentless force in GPBUSD trading, designed to cut through market noise and deliver exceptional results. Whether it’s volatile spikes or quiet trends, Jesus i
"GA Moving Average"("GA 移动平均线")是一个移动平均线交叉策略的专家顾问(EA),它具有可调整的设置,可根据您的想法打造完美的交易策略。
"GA Moving Average"的核心概念是利用移动平均线指标来识别潜在的交易机会。通过分析不同移动平均线之间的相互作用,该EA旨在生成市场上的买入和卖出信号。
主要特点和自定义选项: 1. 移动平均线参数:交易者可以定义特定的移动平均线期数(短期和长期),以适应其交易风格和偏好。这提供了灵活性,以适应不同的市场条件和时间框架。
2. 交叉信号生成:该EA监控短期移动平均线与长期移动平均线的交叉。当短期移动平均线向上穿过长期移动平均线时,生成一个看涨信号,表示可能的买入机会。相反,当短期移动平均线向下穿过长期移动平均线时,生成一个看跌信号,表示可能的卖出机会。
3. 风险管理:该EA包含风险管理功能,允许交易者控制市场风险敞口。用户可以指定交易手数、止损和止盈水平等参数,以管理风险并保护交易资本。
4. 可自定义参数:"GA Moving Average"提供一系列可调整的参数,用于优化策略。交易者可以尝试不
FREE

Unlock the power of automated trading with the Fully Automated Fibonacci Retracement EA for MetaTrader 5. This Expert Advisor dynamically identifies Fibonacci retracement levels and places trades based on candle formations—completely hands-free. Designed to simplify your trading process, it ensures accurate and timely execution without the need for constant monitoring. Key Features: Automated Trade Execution : The EA automatically analyzes Fibonacci retracement levels and enters trades based on
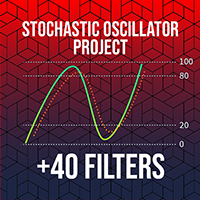
Unlock the full potential of trading with the Stochastic Oscillator PROject Expert Advisor (EA) , a highly customizable, automated tool built around the widely-used Stochastic Oscillator indicator. This EA is designed with advanced filters and flexible settings, empowering traders to manage risk effectively through customizable parameters such as lot size, stop-loss, take-profit, and session filters. With multiple trend confirmation options and versatile trailing stop methods, the Stochastic

"GA Moving Average"("GA 移动平均线")是一个移动平均线交叉策略的专家顾问(EA),它具有可调整的设置,可根据您的想法打造完美的交易策略。
"GA Moving Average"的核心概念是利用移动平均线指标来识别潜在的交易机会。通过分析不同移动平均线之间的相互作用,该EA旨在生成市场上的买入和卖出信号。
主要特点和自定义选项: 1. 移动平均线参数:交易者可以定义特定的移动平均线期数(短期和长期),以适应其交易风格和偏好。这提供了灵活性,以适应不同的市场条件和时间框架。
2. 交叉信号生成:该EA监控短期移动平均线与长期移动平均线的交叉。当短期移动平均线向上穿过长期移动平均线时,生成一个看涨信号,表示可能的买入机会。相反,当短期移动平均线向下穿过长期移动平均线时,生成一个看跌信号,表示可能的卖出机会。
3. 风险管理:该EA包含风险管理功能,允许交易者控制市场风险敞口。用户可以指定交易手数、止损和止盈水平等参数,以管理风险并保护交易资本。
4. 可自定义参数:"GA Moving Average"提供一系列可调整的参数,用于优化策略。交易者可以尝试不
FREE

隆重推出 Last Hope EA ,它是我个人排名前 30 的 EA 之一,它是一款创新的 MQL4 EA 交易系统,正在改变您的交易方式!由我精心开发,拥有超过 5 年的交易经验。 重要的! 推荐货币对:EURCHF、EURUSD、USDCHF、GBPCAD 和 EURCAD 促销价仅需 50 美元! 价格很快就会涨到 100 美元,然后每购买10次就涨 50 美元! 该 EA 无需描述,您可以自行测试 EA 并查看结果。 添加到您的投资组合中的好选择,具有良好的安全被动收入和长期投资! 建议: 货币对:欧元兑瑞郎 时间范围:H1 最低存款:100 美元 账户类型:ECN、Raw 或 Razor,点差较低。 重要提示: 使用低点差账户以获得最佳结果非常重要! 规格: 贸易欧元瑞郎 请勿使用网格、对冲或多个未平仓交易 最多只有 1 笔未平仓交易 每个操作都受到 SL 的保护 内置自动抽签功能 安装非常简单,无需更改设置,默认设置非常适合大多数经纪商。 使用 VPS 让 EA 24/7 工作(强烈推荐)

The Tweezer Bottom candlestick pattern is formed by two candles. Here’s how to identify the Tweezer Bottom candlestick pattern: The first candle is bearish The second candle is bullish The lows from both candles should be pretty much at the same level This 2-candle bullish candlestick pattern is a reversal pattern, meaning that it’s used to find bottoms. For this reason, we want to see this pattern after a move to the downside, showing that bulls are starting to take control. When a Tweezer Bott

The Three Outside Up candlestick pattern is formed by three candles. Here’s how to identify the Three Outside Up candlestick pattern: The first candle is bearish and small The second candle is bullish and engulfs the first one completely The third candle is bullish and closes above the other ones This 3-candle bullish candlestick pattern is a reversal pattern, meaning that it’s used to find bottoms. For this reason, we want to see this pattern after a move to the downside, showing that bulls are

The Bullish Counterattack Line candlestick pattern is formed by two candles. Here’s how to identify the Bullish Counterattack candlestick pattern: The first candle is bearish and big The second candle is bullish and small There’s a gap between the close of the first candle and the open of the second candle They both close at the same level This 2-candle bullish candlestick pattern is a reversal pattern, meaning that it’s used to find bottoms. For this reason, we want to see this pattern after a
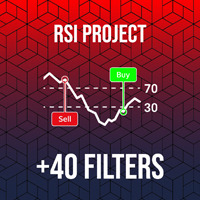
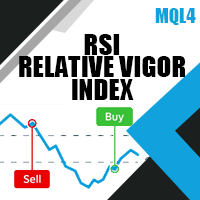
Discover the full potential of automated trading with RSI PROject, our cutting-edge MT5 Expert Advisor (EA). This sophisticated tool is designed to streamline your trading journey, offering a user-friendly interface combined with powerful filters and in-depth customization options. Whether you're a novice or an experienced trader, RSI PROject adapts to your needs, helping you optimize strategies and make informed decisions with confidence. $32 (3 copy left) next price $99 Key Features and Benef

Unlock the full potential of trading with the Parabolic SAR PROject Expert Advisor (EA) , a highly customizable, automated tool built around the widely-used Parabolic SAR indicator. This EA is designed with advanced filters and flexible settings, empowering traders to manage risk effectively through customizable parameters such as lot size, stop-loss, take-profit, and session filters. With multiple trend confirmation options and versatile trailing stop methods, the Parabolic SAR PROject EA ad

Hello, traders! I am Jesus , the ultimate Gold trading machine . My strategy is built on thousands of optimized candle patterns, meticulously refined to extract the best setups on XAUUSD . Precision is my foundation, and my goal is simple: to dominate the Gold market with laser-sharp accuracy. I’m not just an Expert Advisor—I’m a relentless force in gold trading, designed to cut through market noise and deliver exceptional results. Whether it’s volatile spikes or quiet trends, Jesus is here
Unlock the full potential of trading with the ADX PROject Expert Advisor (EA) , a highly customizable, automated tool built around the widely-used ADX indicator. This EA is designed with advanced filters and flexible settings, empowering traders to manage risk effectively through customizable parameters such as lot size, stop-loss, take-profit, and session filters. With multiple trend confirmation options and versatile trailing stop methods, the ADX PROject EA adapts seamlessly to various mar
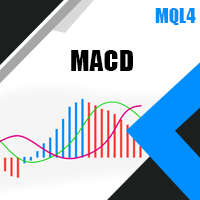
Unlock the full potential of trading with MACD PROject Expert Advisor (EA) , a highly customizable, automated tool based on the popular MACD indicator. The EA is designed with robust filters, allowing traders to manage risks through flexible settings like lot size, stop-loss, take-profit, and session filters. It offers multiple trend confirmation options and trailing stop methods, making it suitable for diverse market conditions. Price : $32 (3 copies left), Next: $99 Full Control Over Your Tra
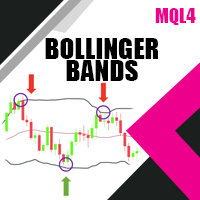
Unlock the full potential of trading with the Bollinger Bands Expert Advisor (EA) , a highly customizable, automated tool built around the widely-used Bollinger Bands indicator. This EA is designed with advanced filters and flexible settings, empowering traders to manage risk effectively through customizable parameters such as lot size, stop-loss, take-profit, and session filters. With multiple trend confirmation options and versatile trailing stop methods, the Bollinger Bands PROject EA adap
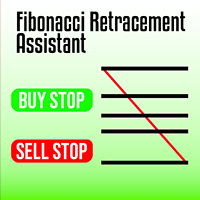
Maximize your trading efficiency with the Fibonacci Retracement Assistant for MetaTrader 5. This powerful tool automates the process of setting Buy Limit and Sell Limit orders as soon as you draw your Fibonacci retracement levels. Designed for traders seeking precision and speed, it eliminates the manual effort of order placement, letting you focus on market analysis. Key Features: Automatic Order Placement : Instantly set Buy Limit and Sell Limit orders when you drag Fibonacci retracement leve

The Hammer candlestick pattern is formed by one single candle. Here’s how to identify the Hammer candlestick pattern: The candle has a small body The wick at the bottom must be big compared to the body At the top, it should have no wick, or be very small The color of the body doesn’t matter This 1-candle bullish candlestick pattern is a reversal pattern, meaning that it’s used to find bottoms. For this reason, we want to see this pattern after a move to the downside, showing that bulls are star

GOLD xKiller is a precision Gold trading EA built on one powerful market truth: strong trends don’t reverse randomly .
By exploiting rare but high-probability streaks of 5+ consecutive daily candles in one direction , this strategy targets exhausted moves with exceptional historical performance on XAUUSD.
Simple logic. Extreme selectivity. Data-backed results that speak for themselves. Fully automatic adviser. - REAL SIGNAL: 3K Live Signal : Click Here Limited price $79 is only for 10 first sa

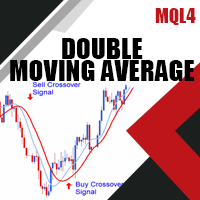
MA Crossover EA is a professional-grade Expert Advisor built on the powerful and time-tested Double Moving Average Crossover strategy , designed to give traders full control, full flexibility, and unlimited customization . The double moving average crossover is one of the most widely used trading concepts in technical analysis. It is simple, effective, and adaptable to all markets and timeframes — Forex, Gold, Indices, Crypto, and more.
This EA takes that classic concept and elevates

Euro xKiller is a precision EURUSD trading EA built on one powerful market truth: strong trends don’t reverse randomly .
By exploiting rare but high-probability streaks of 5+ consecutive daily candles in one direction , this strategy targets exhausted moves with exceptional historical performance on EURUSD.
Simple logic. Extreme selectivity. Data-backed results that speak for themselves. Fully automatic adviser. - REAL SIGNAL: 5K Live Signal : Click Here Limited price $79 is only for

Pound xKiller is a precision GBPUSD trading EA built on one powerful market truth: strong trends don’t reverse randomly .
By exploiting rare but high-probability streaks of 5+ consecutive daily candles in one direction , this strategy targets exhausted moves with exceptional historical performance on GBPUSD.
Simple logic. Extreme selectivity. Data-backed results that speak for themselves. Fully automatic adviser. - REAL SIGNAL: 5K Live Signal : Click Here Limited price $79 is only

GBPJPY xKiller is a precision GBPJPY trading EA built on one powerful market truth: strong trends don’t reverse randomly .
By exploiting rare but high-probability streaks of 5+ consecutive daily candles in one direction , this strategy targets exhausted moves with exceptional historical performance on GBPJPY.
Simple logic. Extreme selectivity. Data-backed results that speak for themselves. Fully automatic adviser. - REAL SIGNAL: 5K Live Signal : Click Here Limited price $79 is onl