Fibonnaci path profile
- Indicadores
-
Shipra Gupta
 Sou Shipra Gupta, trader e desenvolvedora de estratégias quantitativas com sólida formação em matemática, economia e sistemas de trading algorítmico. Ao longo dos anos, trabalhei amplamente nos mercados de forex, ouro, índices, commodities e criptomoedas, focando na construção de estratégias
 - Versão: 1.0
Fibonnaci path profile Metatrader 5 indicator
Overview
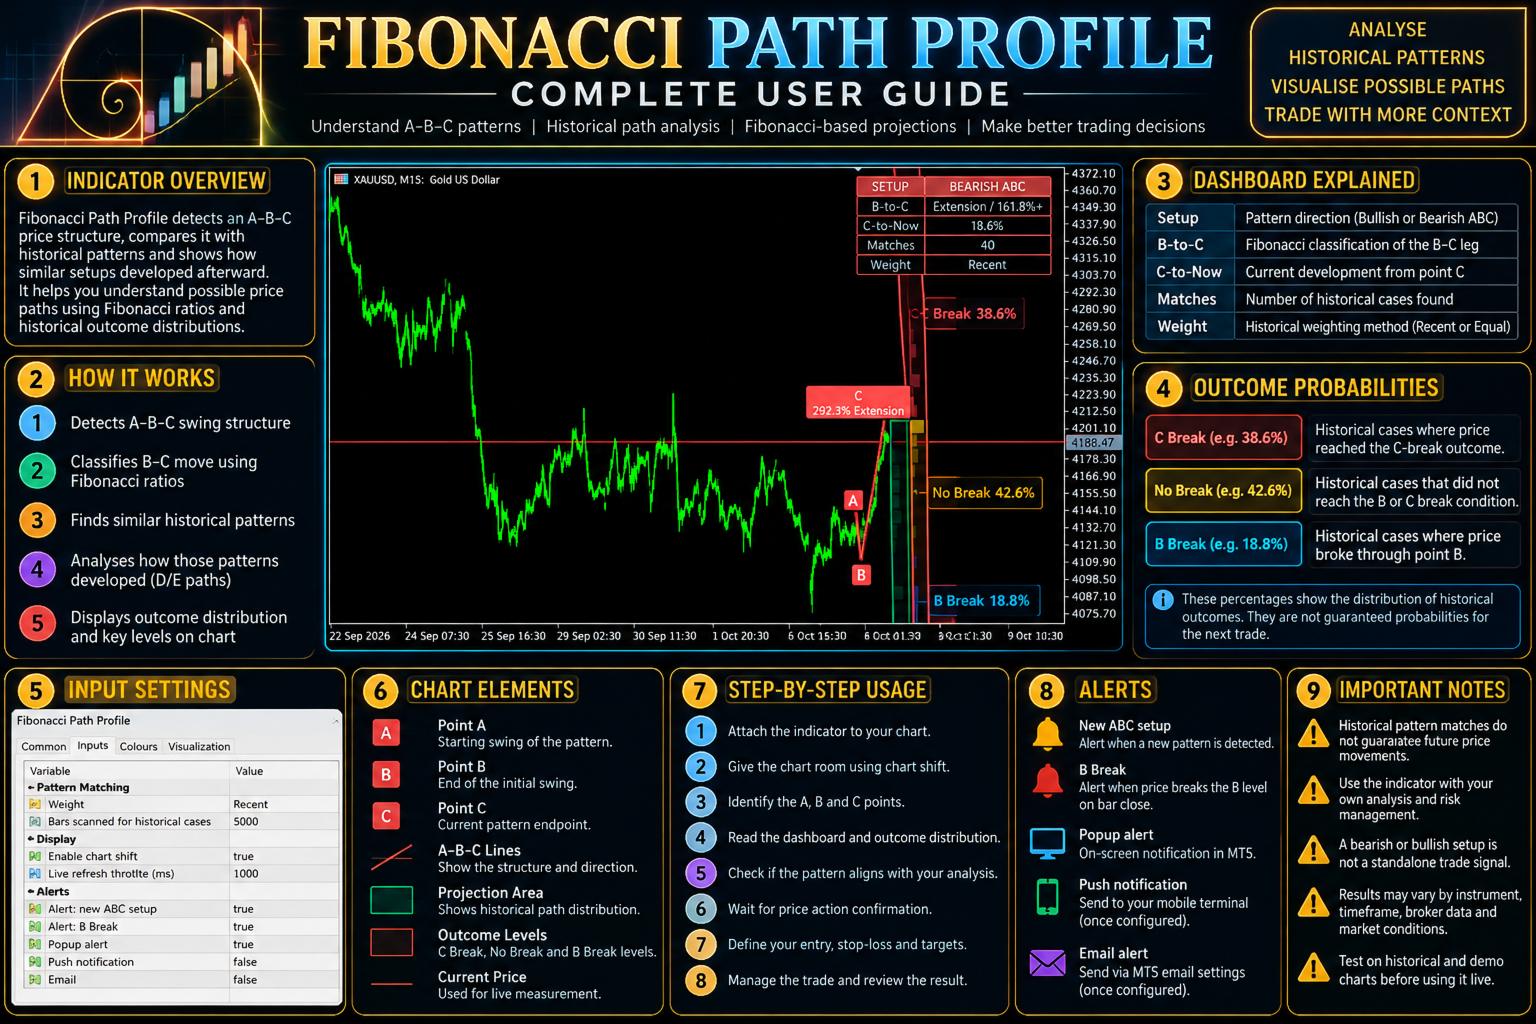
Fibonacci Path Profile analyses historical ABC swing structures to show how price has developed after comparable retracements. It matches historical patterns with similar swing characteristics and displays the subsequent price paths as a distribution of possible outcomes.
The indicator is designed to support scenario analysis for continuation, retracement, and reversal conditions. Its projections are historical comparisons, not fixed-price forecasts.
MT5 Expert Advisor Collection
Explore automated systems built for Gold & Bitcoin, covering breakout, scalping, momentum and multi-horizon strategies.
Gold: Range Striker | Gold Flash | Vortex Pro | Neural Scalper | Titan Forge | Quantum Pulse | GoldGridBreakout | Gold Micro Account
Bitcoin: BTC Strike | Alpha Vault | Edge Pilot
How It Works
ABC Structure and Retracement Classification
The indicator identifies alternating price pivots and evaluates the relationship between the A–B impulse and the B–C retracement. Qualifying structures are classified into Fibonacci-based retracement and extension ranges.
Historical Pattern Matching
The indicator scans a configurable amount of historical data for comparable swing structures. You can choose between two weighting methods:
-
Recent: Gives more influence to recent qualifying cases.
-
Equal: Gives each qualifying historical case the same weight.
D/E Path Analysis
After a qualifying ABC structure is identified, the indicator evaluates how comparable historical patterns developed during the subsequent D and E stages. The resulting paths illustrate historical extension and retracement behaviour rather than predicting a guaranteed outcome.
Fibonacci Classification
The indicator uses levels including 23.6%, 38.2%, 50.0%, 61.8%, 78.6%, 100.0%, 127.2%, and 161.8% to classify retracements and extensions.
Key Features
-
Historical matching of comparable ABC swing structures.
-
Recent or equal weighting of historical examples.
-
D/E path visualisation for forward scenario analysis.
-
Fibonacci-based retracement and extension classification.
-
Monitoring for newly formed ABC structures.
-
Optional alerts when price closes beyond the relevant B level.
-
Configurable historical calculation range.
-
Optional chart shift to provide room for projected paths.
-
Popup, push, and email notifications.
Input Settings
Pattern Matching
-
Weight: Select Recent or Equal weighting.
-
Calculation Bars: Set the amount of historical data scanned for comparable patterns.
Display
-
Enable Chart Shift: Creates space to the right of price for projected paths.
-
Refresh Interval: Sets the minimum refresh interval when a new bar has not formed.
Alerts
-
New ABC Setup: Enables alerts for a qualifying structure.
-
B Break: Enables alerts when the relevant B level is broken on a bar close.
-
Popup Alert, Push Notification, Email: Select the notification methods. Push and email alerts also require the relevant MetaTrader terminal settings.
Suggested Workflow
-
Identify a qualifying ABC structure.
-
Review its retracement classification and the historical D/E path distribution.
-
Compare the displayed paths with the broader trend and nearby support or resistance.
-
Wait for independent price-action confirmation before considering a trade.
-
Define the invalidation level and risk before entering.
Suitable For
-
Traders who analyse Fibonacci retracements and swing structures.
-
Traders comparing current price patterns with historical analogues.
-
Discretionary traders assessing continuation and reversal scenarios.
Important Notes
Fibonacci Path Profile is an analytical indicator and does not execute trades. Similar historical patterns can develop differently in the future. Results depend on the available history, selected weighting method, instrument, timeframe, and market conditions. Projections are not guarantees of future price movement. Use independent confirmation and appropriate risk management.