Momentum Decoupling Scalper

  • 指标
  • Kay Zaremba
    Kay Zaremba
    Trader and MQL4 / MQL5 / Pine Script developer behind trader.lifestyle.
    YouTube: youtube.com/@traderlifestyle
    What I do:
    • Build free indicators and Expert Advisors for MT4, MT5
    • Turn strategies from YouTube videos, TradingView scripts and forum posts into working code
  • 版本: 1.0
  • 激活: 5

Momentum Decoupling Scalper turns a popular 1-minute scalping method for gold into clear, non-repainting signals. A signal on the 15-minute chart arms the setup, the first momentum candle on the 1-minute chart is the entry, and every trade comes with a stop loss, three targets (TP1 / TP2 / TP3) and an automatic break-even.

The part most traders skip is the one that matters: the market must move on its own momentum against the US dollar. The indicator measures the dollar for you (the broker's dollar index or a synthetic one built from five major pairs) and only lets a signal through when gold and the dollar decouple in your favour.

✔ Never repaints Closed candles only, from a fixed starting point. An arrow, a stop or a target never moves - live and in the Strategy Tester.
✔ Complete trade plan Entry, stop loss, TP1 / TP2 / TP3 and the break-even level for every signal, drawn on the chart and sent with the alert.
✔ Dollar decoupling built in No second chart, no extra indicator. The dollar index is found or built automatically, symbol suffixes included.
✔ Settings from real data Defaults come from a study on 21 months of XAUUSD M1 data (Jan 2025 - Oct 2026) with the spread of every candle deducted and a separate out-of-sample period.

■ The idea in 30 seconds

1. RSI matrix (M15) Four RSI lines (5, 8, 13, 21). When the fast RSI crosses the slow RSI, momentum on the 15-minute chart turns. A buy needs the slow RSI below 50 (still room to run), a sell above 50.
2. Dollar decoupling Momentum of the market (white line) against momentum of the US dollar (red line). The signal only counts when the gap between the lines opens in the signal direction and the market is on the right side of the dollar.
3. Entry (M1) The setup is now armed. The entry is the first candle in the signal direction that closes beyond the momentum EMA - within 15 candles.
4. Manage Stop behind the recent swing. One third of the position at TP1 (1R), TP2 (2R) and TP3 (3R). At +0.5R the stop moves to break-even.

Example: M15 fast RSI crosses above the slow RSI at 42, gold momentum turns up while the dollar momentum falls (gap opens upwards) → BUY armed. Two minutes later an M1 candle closes up and above the EMA → BUY 4128.40, SL 4121.90, TP1 4134.90, TP2 4141.40, TP3 4147.90. Price runs 3.25 → stop to break-even 4128.72.

■ How to trade it, step by step

Step 1
Chart
Open XAUUSD M1 and load the indicator with the default settings. The signal timeframe (M15) is read automatically - you do not need a second chart.
Step 2
Wait
Nothing to do until an alert comes. The dashboard shows "waiting for a M15 matrix signal", the live RSI matrix and the dollar decoupling status.
Step 3
Armed
Alert: "M15 matrix BUY signal + dollar decoupling - wait for the first bull candle". The chart shows ▲ M15 and a dotted entry window, the panel shows BUY ARMED with the candles left. Do not enter yet.
Step 4
Entry
Alert: "BUY ENTRY 4128.40 SL 4121.90 TP1 ... TP2 ... TP3 ..." with the entry arrow. Enter at market, put the stop and the targets (or split the position in three).
Step 5
Break-even
Alert: "move the stop to break-even". The cyan dashed line shows the new stop. From now on the trade can not turn into a full loss.
Step 6
Targets
Alerts for TP1, TP2, TP3. The ladder in the panel ticks off every target, the exit dot shows the result in R.

■ What you see on the chart

Momentum candles Teal = bull (up candle closing above the momentum EMA), red = bear, white = neutral (no momentum). The running candle is coloured live, closed candles never change.
Momentum EMA The cyan line (EMA 9). A candle must close beyond it to count as an entry candle.
▲ / ▼ M15 Higher timeframe signal that passed every filter. Hover it for the RSI values and the dollar gap. While armed, a dotted frame shows the entry window.
Entry arrow On the trigger candle. Entry = close of this candle.
Position ladder Red zone = risk (entry to stop). Green ladder = entry → TP1 → TP2 → TP3 (brighter when hit). Gold line = entry, red line = stop, cyan dashed = break-even stop, "TP1 ✓" when a target is hit.
Exit dot Gold dot at the exit candle with the result, e.g. +1.00R BE or +2.00R TP3.

■ The dashboard, card by card

Header Symbol, signal → entry timeframe, LIVE status. Buttons: entry timeframe (M1 ★, M2, M3, M5), layers (CANDLE, EMA, SIGNAL, ENTRY, TRADE, EXIT), compact mode, close to a pill. Drag the header to move the panel. Status line: waiting / ARMED / IN TRADE.
M15 RSI matrix The last 48 M15 bars of the four RSI lines (blue fast, cyan, yellow, orange slow) with green / red background (fast above / below slow). Filled triangles = signals that passed the dollar filter, grey = crosses that were filtered out. Right: live values. Bottom: matrix state and how many lines are stacked.
Dollar decoupling Market momentum (white) vs. dollar momentum (red) with the gap shaded green (market stronger) or red. Right: asset, dollar and gap values. Bottom: "decoupling UP - buy side open", "decoupling DOWN - sell side open" or "lines converge". The header shows the dollar source.
Setup / trade Armed: direction, candles left in the window, what the entry candle needs, stop / target / break-even rules. In trade: entry, stop, break-even status, TP1 / TP2 / TP3 boxes, progress bar stop → TP3 with the live price and the live R. Afterwards: the last trade with its result.
Trade journal Trades, win rate, profit factor and net R (after spread) of the last 60 days on your chart, rates for TP1 / TP2 / TP3 / break-even / full stop, last 16 results (hover a dot for the details).

Every element has an explanation on mouse over. The panel avoids other Quant Series panels automatically, folds to a pill when there is no room and remembers its position.

■ Inputs

Signal - RSI matrix on the higher timeframe
Signal timeframe M15 (default, as in the strategy). M5, M10, M30, H1 possible. The chart timeframe must be lower - it is the entry timeframe.
Matrix RSI 1 - 4 5, 8, 13, 21. RSI 1 = fast line, RSI 4 = slow line; the cross of these two is the signal, RSI 2 and 3 complete the matrix display.
Buy zone / sell zone 50 / 50. Buy only when the slow RSI is below the buy zone, sell only above the sell zone.
Dollar decoupling filter
Decoupling rule Off / lines separate in the signal direction / lines separate + right side (recommended) / asset and dollar turn in opposite directions.
Dollar source, symbol Auto (broker dollar index if there is one, else synthetic) / synthetic / a symbol you name (e.g. DXY).
Momentum fast / slow / normalisation 8 / 21 / 100 bars. Momentum = fast EMA - slow EMA of the log price, divided by the volatility of the last 100 bars, so market and dollar are comparable.
Trend filter
Trend filter, EMA length Off (default) / close on the trend side of the EMA / + EMA slope. Off by default because it did not improve the results in the study.
Entry trigger
Entry candle First momentum candle (default, as in the strategy) / momentum candle that also closes beyond the previous candle.
Momentum candle EMA 9. Also colours the candles.
Entry window 15 chart bars after the signal. No entry candle in time = setup expires.
Session from / until 07 - 21 server hours. Signals outside are ignored (rollover and the quiet Asian hours performed worst). Same value = 24 h.
Max spread 0.10 R. Skips the entry when the spread is too large compared to the stop.
Stop loss, 3 targets, break-even
Swing bars, buffer, min / max 30 bars, 0.2 ATR, 4 - 16 ATR. Stop behind the swing, never tighter than 4 ATR (protects against spread and noise), never wider than 16 ATR.
TP1 / TP2 / TP3 1R / 2R / 3R. 1R = the stop distance. One third of the position at each target.
Break-even, trigger, lock When X R in profit (default 0.5R) / after TP1 / off. The new stop locks 0.05R to cover the spread.
Early exit Off (default) / after TP1 close on a neutral or opposite candle / close on an opposite candle.
Close the rest after 600 bars (time stop).
Journal after spread, history days On / 60 days.
Drawing, alerts, display
Layers, colours Candles, EMA, signals, entries, trades, exits; last 12 trades drawn; all colours editable.
Alerts Signal armed, entry, TP1/2/3, break-even, trade closed - popup, sound, push, e-mail, on-chart toast.
Display Full dashboard or compact panel, automatic placement, start position, explanations on mouse over.

■ For Expert Advisors (iCustom)

Buffers: 0-3 candle OHLC, 4 candle colour (0 bull, 1 bear, 2 neutral), 5 momentum EMA, 6 buy entry, 7 sell entry, 8 M15 buy signal, 9 M15 sell signal, 10 trade exit, 11 signal (+1 / -1), 12 entry, 13 stop loss, 14 TP1, 15 TP2, 16 TP3. Values are written on the closed candle and never change.

■ Good to know

  • Built and tested for gold (XAUUSD) on M1; silver works with the same settings. On forex pairs the spread is large compared to an M1 stop - use the journal to judge your own symbol.
  • The synthetic dollar index needs EURUSD, USDJPY, GBPUSD, USDCAD and USDCHF in your terminal (they are added to the Market Watch automatically). If one is missing, the panel shows it and no signals are given while the filter is on.
  • Past results do not guarantee future results. The journal shows the real outcomes on your own chart, broker and spread.
  • The indicator does not open trades. It is a decision tool.
推荐产品
Manyal trading system, CovEchoTrend Robot, focuses on reliability and flexibility. By employing statistical analysis methods to study the relationships between the base indicator and market patterns, the system enables a deeper understanding of market processes. Intelligent pattern analysis: The application of statistical data processing helps identify key trend reversal points more accurately, signaling significant market shifts. Informed decision-making is based on the intersection of indicato
SMC Market Structure PRO — 订单块、FVG、流动性与汇合区指标 不再靠猜测。开始像大资金那样解读市场。 SMC Market Structure PRO 自动在图表上识别聪明钱的关注区域——订单块(Order Blocks)、公允价值缺口(FVG)以及时间失衡区,并高亮显示三种结构相互重叠的汇合区(Confluence Zones)。价格恰恰最常在这些区域产生反应。 这是一款基于聪明钱概念(Smart Money Concepts / ICT)方法论的完整市场结构分析工具。它适用于任意品种和任意周期,启动时自动处理历史数据,并在每根新K线上更新——已形成的区域不会重绘。无需堆叠十几个零散指标,您即可在图表上获得一张完整的机构意图地图。 核心功能 自动订单块(看涨与看跌) 指标不只是简单地标出一根大K线。它会验证真正的 SMC 条件:实体至少占整根K线幅度的 60%、流动性抓取(liquidity grab)以及随后的价格位移(displacement)。只有经过确认的订单块才会显示在图表上。 公允价值缺口(FVG / 失衡区) 精确识别三K线价格缺口,并带有最
Aurus Apex
Dmitriq Evgenoeviz Ko
Aurus Apex — A Next-Generation Intelligent Trading Terminal Aurus Apex is more than just an advisor; it's a fully-fledged trading ecosystem that combines classic technical analysis, modern trade support algorithms, and fundamental data filtering. Designed for professionals who value deep customization, it remains as friendly as possible to beginners thanks to the "Plug & Play" concept: by default, the robot is configured for extremely conservative operation - one order per market with strict St
PatternDetector
Thien Thanh Tran
PatternScope — Multi-Pattern Recognition for MT5 PatternScope is a multi-pattern recognition indicator for MetaTrader 5. It scans price action for classic chart patterns, confirms breakouts, and draws clear   Entry, Stop Loss and Take Profit   levels. A compact dashboard shows the latest pattern, bias and Risk:Reward. Patterns:   Double Top/Bottom, Triple Top/Bottom, Head and Shoulders (and inverted), Bullish & Bearish Flag, Pennant, Rising & Falling Wedge, Triangle, Rectangle, Cup and Handle —
Core Scalper RSI
Ignacio Agustin Mene Franco
CORE SCALPER RSI A gold scalper that trades in the direction of momentum Core Scalper RSI gauges market strength using the RSI indicator, triggering only when momentum is clearly leaning in one direction. Designed for XAUUSD on the M5 timeframe—where gold moves rapidly and every second counts. The concept in 3 steps 1️⃣ Take the pulse The RSI determines who’s in control: if the momentum is bullish, it enables buy trades; if bearish, it enables sell trades. If the market is indec
Gold Super Trends AutoTrader Robot
Hesham Ahmed Kamal Barakat
5 (5)
60% Discount General description; This EA is made to be used in the Gold market. It's made for trading Gold in mind. This Trading Robot is based on more than 14 years of winning patterns and will open trades by the minute, 24 hours a day. It will handle everything, from opening positions, closing them, managing risk. Features; - Timeframe-Less Expert Advisor that works by the second and recalculate everything with whichever situation that might exist. - Dynamic market watcher that adjust itse
Aurum Reversion Pro MT5
Olaoluwa Oluwaseun Bamitale
Aurum Reversion Pro Aurum Reversion Pro is a professionally developed Expert Advisor designed for traders who want a structured, automated approach to trading Gold (XAUUSD) . Built with a strong focus on automation, flexibility and risk management, Aurum Reversion Pro combines intelligent trade management with configurable protection features to provide a streamlined trading experience. The EA is optimized for XAUUSD (Gold) and is recommended for the M15 (15-minute) timeframe . For best operatin
介绍Three Moving Averages Pro,这是一系列包括强大的自定义优化指标的移动平均策略,Three Moving Averages Pro帮助您找到低停滞和高净利润的最佳交易系统。 该策略使用两个入场条件和一个出场条件来执行精确和准确的交易。通过多种选项,例如在不同移动平均线上方或下方的开盘柱位置和不同方向的移动平均线交叉,您将拥有所需的所有控制权以进行盈利交易。 您可以通过将收益率和止损设置为价格的百分比来控制风险。此外,您还可以设置进入和关闭时间以增加对交易的控制。借助自定义优化指标,交易员可以找到具有高CAGR和低回撤以及低停滞的系统。 Three Moving Averages Pro的最佳功能之一是它提供了广泛的移动平均类型可供选择。这使得交易员可以灵活定制其交易策略以适应其个人需求。通过选项,例如简单移动平均线(SMA)、指数移动平均线(EMA)、平滑移动平均线(SMMA)、线性加权移动平均线(LWMA)、双指数移动平均线(DEMA)、三指数移动平均线(TEMA)、高低移动平均线(HiLo)、成交量加权移动平均价格(VWAP)和线性回归移动平均线(LINR
Xelox
Yvans Tetua Li Cheng
XELOX — 黄金哨兵 XAUUSD 日内智能交易系统 · 结构突破 · 无网格、无马丁格尔 当前价格:399 美元。每售出 10 份价格上调 50 美元,直至最终价格 999 美元。 传说 在任何一座大金库里,真正重要的黄金从来不是陈列出来的那些,而是在无人注视时、在时辰之间悄然移动的黄金。 XELOX 之名,正取自这种移动。 传说从不把黄金托付给唯一的守望者。守护那道宏大边界的卫士——那条黄金整整守持一个月、每季才越过一次的边界——与另一种哨兵相呼应:当卫士等待季节更替时,哨兵则在时辰之间的走廊里巡行。他守望重大的行情,她则注视白昼本身。她学到了每个日内交易者最终都要吃亏才明白的道理——黄金不断地说谎。它突破一个价位来引诱急躁者,随后又急速回撤,把他们抛在错误的一侧。 于是她不再相信第一波行情。她守在黄金所守持的每一道边界之后,等待证据。不是意图——而是证据。当突破为真时,她果断入场,一次,毫不犹豫。而她从不交还已经占据的阵地。 这就是这款智能交易系统的全部理念。它不预测。它不逆势加仓摊平。它不会为了拯救一笔亏损单而开第二笔。它等待黄金证明其突破,然后守护它所夺得的一切。 XEL
Viking Alpha DAX Ivar Edition
Valdeci Carlos Dos Passos Albuquerque
Viking Alpha DAX — Germany 40 Expert Advisor for MetaTrader 5 LAUNCH PROMO Only 10 copies at launch price. Price increases with each sale. Launch price: $297 Next price: $497 Final price: $997 Live Performance: FX Blue — Vikingtradingbots What Makes Viking Alpha DAX Different Most DAX robots fail for one simple reason: they treat the Germany 40 like a forex pair. It isn't. The DAX has a heartbeat — a specific rhythm tied to the Frankfurt Stock Exchange opening, the European session structure, an
Gold Crazy EA MT5
Nguyen Nghiem Duy
Gold Crazy EA   is an Expert Advisor designed specifically for trading Gold H1/ EU M15. It use some indicators to find the good Entry. And you can set SL or you can DCA if you want. It can be an Scalping or an Grid/ Martingale depend yours setting. This EA can Auto lot by Balance, set risk per trade. You also can set TP/ SL for earch trade or for basket of trade. - RSI_PERIOD - if = -1, then the default strategy works, if >0, then the RSI strategy works - MAX_ORDERS - to trade with only 1 order,
Ranked Zone Trader
Attapong Pintasri
Ranked Zone Trader is an Expert Advisor for MetaTrader 5. It detects non-repainting fair value gap zones on closed bars, ranks active zones by strength, and waits for a retest before placing a trade. The EA is designed around price-zone retests rather than grid or recovery logic. Each trade uses a hard stop-loss and a fixed reward-to-risk target. Position size can be fixed or calculated from a risk percentage. Main features: - Closed-bar fair value gap zone detection - Strength ranking for ac
了解价格可能寻找流动性的位置 Liquidity Reaction Map MT5是一款基于图表的市场分析指标。它根据已确认的价格结构识别潜在的买方流动性区域和卖方流动性区域。 该指标将摆动高低点、等高点和等低点、前一日和前一周高低点、交易时段极值以及心理整数价格整合到一个清晰的流动性地图中。相互接近的价位可以合并,并根据强度、与当前价格的距离以及多个来源的一致程度进行排序。 该指标帮助交易者分析价格可能接近、扫过、拒绝或突破流动性区域的位置。它不会开仓或管理交易。 流动性来源 流动性地图可以从以下来源识别流动性: 已确认的摆动高点和低点 等高点和等低点 前一日高点和低点 前一周高点和低点 已完成交易时段的高点和低点 心理整数价格水平 多个可配置时间周期 买方流动性显示在相关高点上方,卖方流动性显示在相关低点下方。 这些区域是根据历史价格结构计算的估计值。该指标不会访问经纪商订单簿或真实的止损持仓数据。 排序后的流动性区域 检测到的价位会根据以下多个因素进行评估: 支持该价位的枢轴点数量 等高点或等低点的聚集程度 多个来源的一致性 时间周期的重要性 与当前价格的距离 价位的新鲜度 相互
Fox Edge Scalper
Arif Lesmana Yoga
Fox Edge Scalper - Multi-Strategy Grid EA with Trend Filters and Margin Protection Fox Edge Scalper is an automated trading system built around three selectable position-management strategies (Martingale, Averaging, and Smart Hybrid Hedging), combined with a multi-filter entry engine and a dedicated risk-control layer. Instead of relying on a single fixed method, the EA lets the strategy, the entry conditions, and the protection rules be configured independently, so the same core engine can be a
Structure King AI Signal
Shingala Gautamkumar
Structure King AI Signal Structure King AI Signal is a professional MetaTrader 5 trading indicator designed to help traders analyze market structure, trend direction, multi-timeframe confirmation and trade management from one clean dashboard. Key Features • Market Structure & Trend Analysis • BUY / SELL Signals • Multi-Timeframe (HTF) Confirmation • Entry Price Levels • Dynamic Stop Loss (SL) • TP1 / TP2 / TP3 Levels • ATR Volatility Analysis • ADX Trend Strength Filter • Adaptive Market Filter
The Non Repaint Buy/Sell Signals QCL MT5 Indicator is a powerful trading tool built on mathematical analysis. This software reduces chart noise avoids confusion when making trading decisions and provides clear market signals directly on MetaTrader 5 without repainting. Special launch discount price. Final price $149 Indicator User Manual User Manual Asset: XAUUSD Timeframe: 15 Minutes, We doing manual trading upon the signals sent by our Indicator Core Quantitative Architecture Adaptive Momentum
Cyclone Intraday
Mikhail Mitin
5 (1)
How the EA works (simple explanation) Trades on M5 timeframe Uses H1 timeframe to analyze global market context Analyzes 2 or 3 timeframes simultaneously On each timeframe: Checks price position relative to one or two Moving Averages Evaluates MA angle and distance between price and MA Entry logic is based on trend + volatility conditions , not on random signals The full algorithm is illustrated in the screenshots. Recommended usage Symbol: EURUSD Timeframe: M5 Trading style: Intraday
Introduction to the Manual Backtesting Indicator on MQL5 The MetaTrader platform provides an excellent backtesting tool for evaluating Expert Advisors (EAs). However, when it comes to manually backtesting a strategy to assess its effectiveness, this tool has some limitations: You cannot manually draw zones or trend lines while in backtesting mode. You cannot switch timeframes to check time alignment. For example, if my strategy requires additional confirmation from a higher timeframe (HTF), this
Introduction This indicator detects volume spread patterns for buy and sell opportunity. The patterns include demand and supply patterns. You might use each pattern for trading. However, these patterns are best used to detect the demand zone (=accumulation area) and supply zone (=distribution area). Demand pattern indicates generally potential buying opportunity. Supply pattern indicates generally potential selling opportunity. These are the underlying patterns rather than direct price action. T
TradeAQ
Guo Sheng Zhao
这个量价结构指标是一款适用于   MetaTrader 4 和 MetaTrader 5   的图表分析指标,集量价结构、成交量分布、市场情绪、波动提示和关键价格区域展示于一体。指标直接运行在主图窗口,可帮助交易者快速观察市场的重要价格位置与活跃程度。 主要功能 1. 量价结构支撑与阻力 自动标记连续量价结构形成的潜在支撑位和阻力位,辅助识别价格可能出现停顿、反应或突破的位置。 支持两种分析模式: 成交量结构 价格结构 线条颜色、宽度和样式均可自定义。 2. 成交量尖峰提示 当市场成交量显著放大时,在图表中显示醒目标记,帮助发现异常活跃、加速、衰竭或可能发生方向变化的行情。 可选功能包括: 尖峰图标提示 尖峰价格水平线 高点、低点、收盘价或组合价位显示 自定义成交量阈值 3. 高波动行情提示 自动标记波动明显扩张的 K 线,方便交易者及时发现突破、加速和快速行情。 支持: 高波动图标 关键价格水平线 自定义检测周期与敏感度 自定义线条颜色、宽度和样式 4. 成交量分布 在图表右侧显示指定范围内的成交量分布,直观呈现不同价格区域的交易活跃程度。 主要显示内容包括: 高成交量节点 低成交量
产品名称 :突破追踪交易系统(Breakthrough Tracker Trading System) 核心定位 本系统脱胎于多年实盘交易经验,历经不同市场环境的检验与优化,旨在彻底解决交易者在无序震荡行情中频繁损耗账户资金的痛点。其核心逻辑可概括为—— 只做突破,不参与震荡 。我们摒弃复杂的技术堆砌,将交易决策流程极简化、规则化、可复制化,帮助您在任何市场环境下都能保持清晰的交易视角。 适用品种与周期 系统当前针对 现货黄金(XAUUSD)   及主流外汇货币对( EURUSD、GBPUSD、USDJPY 等)进行深度优化,同时兼容多时间框架: 日内短线交易者,推荐使用   5分钟   周期; 波段趋势交易者,推荐使用   1小时   周期。 您也可根据自身交易风格,灵活调整至任意适配周期。 核心功能与使用规则 轨道识别系统 加载指标后,屏幕将显示三条颜色分明的动态轨道: 绿色上轨   —— 阻力边界 红色下轨   —— 支撑边界 蓝色中轨   —— 多空分水岭 重要原则 :当价格运行于轨道内部时,视为无序震荡阶段, 严禁开仓操作 。 入场信号(突破确立即入场) 当K线有效
SMC Golden Price
Endra Setiyanto
SMC GOLDEN PRICE - 终极机构算法指标 SMC Golden Price 不仅仅是一个指标;它是一个专门为高级聪明钱概念(SMC)和价格行为(Price Action)交易者设计的算法市场结构映射系统。该工具能够自动追踪机构足迹,发现隐藏的流动性区域,并通过优雅的交互式仪表板面板提供高精度的执行指导。 该指标配备了基于真实波动幅度(ATR)的计算和严格的市场噪音过滤,确保您只在 最佳交易入场区 (OTE) 进入市场。 为什么选择 SMC GOLDEN PRICE? 全能武器库: 告别重叠指标造成的图表混乱。SMC Golden Price 将 BOS/CHoCH 检测、订单块(Order Blocks)、公允价值缺口(FVG)、流动性清扫(Liquidity Sweeps)和自动斐波那契集成到一个高度优化且轻量级的系统中。 零图表混乱(智能自动清理): 与其他在屏幕上留下过时区域的工具不同,我们的智能算法在供需区域被价格成功缓解(Mitigated)或突破后会自动将其删除。让您的图表保持干净、专业。 机构级精度(数学而非猜测): 每一个波段检测、突破容差和区域计算都由实
Gecko EA MT5
Profalgo Limited
5 (1)
NEW PROMO: Only a few copies copies available at 349$ Next price: 449$ Make sure to check out our " Ultimate EA combo package " in our   promo blog ! Gecko runs a simple, yet very effective, proven strategy.  It looks for important recent support and resistance levels and will trade the breakouts.  This is a "real" trading system, which means it will use a SL to protect the account.  It also means it will not use any dangerous techniques like martingale, grid or averaging down. The EA shows its
Aquila Miner
Wahyu Krisnandi
4.67 (3)
Aquila Miner is an automated gold EA. It confirms entries by matching CCI & Demaker Indicator with BBMA readings across H1 and D1. A trade opens only when the current market structure fits a known pattern, which keeps entries selective. Live Monitoring Signal KEY FEATURES - Fixed Stop Loss and Take Profit on every trade - Trailing stop to lock in profit on running trades - Optional Recovery mode: at most 2 positions per direction, no lot multiplication, shared SL (see Risk Notes) - News filter
RBreaker
Zhong Long Wu
RBreaker Gold Indicators 是黄金期货一种短线日内交易策略,它结合了趋势跟踪和日内反转两种交易方式,既能捕捉趋势行情的利润,又能在行情反转时及时止盈并顺势反手。 该策略曾连续15年被美国《Futures Truth》杂志评选为前十大最赚钱的交易策略之一,具有很长的生命周期,至今仍在国内外普遍使用与研究。 本指标结合了2026年期货黄金的走势,依据14日ATR指标,分别定义了突破系数A,观察系数B,反转系数R更合理的数值,非常不错的指标,已实现年稳定盈利,值得推荐~ 以上指标适合高波动品种,参数适合期货黄金,股指期货等,如果需要其他品种行情,需要单独设定 突破系数A,观察系数B,反转系数R,进行回测才能使用。 欢迎指标售后有问题可以加+V:504282029
Caicai L&S Yield Histogram Important Notice: This indicator is an integral tool of the automated EA Caicai Long and Short Pair Trading . This indicator visually displays the percentage deviation (Yield %) of a pair's current spread relative to its own historical mean. It is an excellent tool for quickly visualizing the gross financial potential of a market distortion in Long & Short operations. Main Features: Percentage Visualization: Understand the size of the distortion in palpable percentage
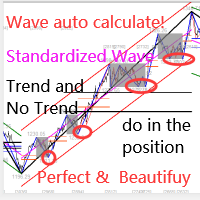
本指标是实践实战交易完善的波浪自动分析的指标 !  案例... 注: 波浪分级用西方叫法不习惯,因受到缠论(缠中说禅)命名方式习惯的影响,我是将基础波浪命名为 笔 ,将二级波段命名为 段 ,同时具有趋势方向的段命名为 主趋段 (以后笔记中都是这种命名方式,先告知大家),但是算法上和缠论关系不大切勿混淆.反映的是本人分析盘面总结的 千变万化纷繁复杂的运行规律 . 对波段进行了标准化定义,不再是不同人不同的浪  ,    对人为干扰的画法进行了排除,在严格分析进场起到了关键的作用 . 使用这个指标,等于将交易界面提升美感,抛弃最原始的K线交易带你进入新的交易层次.如果不是为了交易,在宣传上也将使客户观感提升层次. 指标内容: 1.   基础波浪 (笔) : 首先我们找出了价格波动过程中的基础波动拐点,当然他的有序性低,为下一步的计算提供基础. 2.   二级波段( 段 ) :在基础波浪的基础上,通过算法分析得到层级更明显的二级波段,二级波段为波浪提供了分析基础 3.   波浪( 浪 ): 有着更清晰的趋势,更清晰直观的方向.分析一个波浪是否延续,需要看二级波段的形态,分析二级的构成
Matsukaze Reversal Scanner Matsukaze Reversal Scanner is a professional-grade M1 indicator that combines Bollinger Bands + RSI reversal signals with a built-in multi-pair scanner, currency strength meter, and real-time equity curve. It scans 19 currency pairs simultaneously and ranks them by Profit Factor, showing you exactly which pairs have the strongest reversal edge right now. How It Works The indicator detects oversold/overbought reversal points using Bollinger Bands and RSI. When price clo
Chỉ báo này sẽ thông báo cho bạn nếu cấu hình xu hướng thành công. Tín hiệu theo xu hướng không nên được tăng theo, nhưng tín hiệu mua ở mức giá thấp theo mô hình giao dịch thông thường của bạn, hoặc tín hiệu bán ở mức giá tốt, là một lựa chọn rất tốt. Hãy thiết lập nó trên khung thời gian lớn hơn và theo dõi các khung thời gian nhỏ hơn, bám sát các xu hướng chính. Tôi thường thiết lập ba khung thời gian gần nhau nhất và không bao giờ đi ngược tín hiệu của INdicator này. INdicator   này không có
Sonic R Pro Enhanced
Huu Thuong Nguyen
Sonic R Pro Enhanced EA - 2025 版本 $249 仅限前5名购买者! 实时信号 查看 Sonic R Pro Enhanced 的实时表现: 交易策略 Sonic R Pro Enhanced 是经典 Sonic R 策略的升级版,通过 Dragon Band(EMA 34 和 EMA 89)进行自动化交易,并结合先进算法以提高盈利能力。 时间周期:M15, M30 支持货币对:XAUUSD, BTCUSD, AUDJPY, USDJPY 交易风格:回调交易 & 反趋势交易 最低资金要求:500 USD 杠杆比例:1:200 起 用户指南 设置:只需配置一个参数 - RiskAmount 如果 RiskAmount < 0:按账户余额的百分比计算风险 如果 RiskAmount > 0:每笔交易的固定风险金额 (USD) 示例: RiskAmount = -1 : 风险为账户余额的 1% RiskAmount = -2.5 : 风险为账户余额的 2.5% RiskAmount = 50 : 每笔交易固定风险 50 USD RiskAmou
该产品的买家也购买
Trend Sniper X
Sarvarbek Abduvoxobov
4.87 (46)
Trend Sniper X 是一款适用于 MetaTrader 5 的多周期趋势跟踪指标,可帮助交易者清晰精准地识别趋势方向和潜在的反转点。 适用于 MT4: https://www.mql5.com/en/market/product/193245 价格信息: 当前价格为促销价,随着后续更新和新功能的推出,价格可能会有所变动。 赠品优惠: 购买后联系作者,即可免费获取该指标的 Auto-Trade Assistant EA(自动交易助手 EA)。 Code2Profit 频道 通过多时间框架分析掌控市场! 如何使用 Trend Sniper X 最大化您的胜率:核心规则与交易时段技巧 技术规格 平台 MetaTrader 5 指标类型 多时间周期趋势指标 运行时间周期 任何图表时间周期,可独立选择更高的时间周期 (M1–MN1) 主要交易品种 外汇、黄金 (XAUUSD) 及其他差价合约 (CFD) 推荐账户 任何账户类型 可视化 彩色趋势蜡烛 (买入/卖出/微弱/变化) + 买入/卖出箭头 附加模块 交易时段方框 (悉尼、东京、伦敦、纽约) 主要功能 多时间周期趋势分析: 直接在
Entry Points Pro for MT5
Yury Orlov
4.54 (156)
Entry Points Pro 是一款 不会重绘 的 MT5 指标,会在您下单之前显示入场价格、止损、手数以及按金额估算的风险。设置您的本金和每笔交易的风险,面板会为您计算手数。 截图中,4357.65 是突破入场价位,4324.53 是止损,按 0.04 手计算,预计风险为 $132。 可在 MT5 策略测试器中免费试用。选择 Entry Points Pro 和 XAUUSD H1,然后以可视化模式开始。购买后,我会亲自帮您完成设置。 一次性购买,199 USD。 包含 20 次激活和产品更新。 永久许可证再售出三份后,价格将上调至 249 USD。 租用一个月为 99 USD,可在 MT5 实时图表上使用本指标。 平台会在付款时显示最终价格,其中包含适用的增值税。 Entry Points Pro 让您的入场不再靠猜测,并给您每一位交易者都在寻找的东西——信心与平静。因为它实实在在地有效,绝不重绘自己的信号,并且会立刻在您的图表上用金额把这一点显示出来。厌倦了那些窗口一大堆、设置多达三十项、满是空洞承诺的复杂指标了吗?它们不管用,只会让您更加困惑。还有那些事后重绘的箭头。那些只
Gann Made Easy MT5
Oleg Rodin
5 (14)
Gann Made Easy   是一个专业且易于使用的外汇交易系统,它基于使用先生理论的最佳交易原则。 W.D.江恩。该指标提供准确的买入和卖出信号,包括止损和获利水平。您甚至可以使用推送通知在旅途中进行交易。 购买后请联系我,即可免费获得交易指导和超棒的额外指标! 您可能已经多次听说过江恩交易方法。通常 Gann 的理论不仅对于新手交易者而且对于那些已经有一定交易经验的人来说都是非常复杂的东西。这是因为江恩的交易方法在理论上并不那么容易应用。我花了几年时间来完善这些知识,并将最好的原则应用到我的外汇指标中。 该指标非常易于应用。您所需要的只是将其附加到您的图表并遵循简单的交易建议。该指标不断进行市场分析工作并寻找交易机会。当它检测到一个好的入口点时,它会为您提供一个箭头信号。该指标还显示止损和获利水平。 换句话说,当您像先生一样进行交易时,该指标会为您提供最佳江恩建议。江恩亲自告诉你此时此刻该做什么。但最好的部分是您不需要了解任何有关江恩交易原则的知识,因为该指标会为您完成整个市场分析工作。
Ultra Indicator
Ihor Otkydach
5 (1)
ULTRA 是一項採用「一站式」運作模式的技術指標——它能獨立分析市場、產生交易訊號、顯示設定停損單的價位,並建議何時平倉以鎖定獲利或將損失降至最低。 換句話說,無論您是否懂得分析市場、判定價位(該將停損設在哪裡),或是對資金管理感到棘手,都無妨。ULTRA 會為您處理所有這些事情! 買家專屬好禮 : 購買 ULTRA 指標後,請透過私訊聯繫我,即可免費獲贈「ULTRA BOT」。這是一款特別設計的工具,能協助您根據該指標發出的訊號來管理已開倉的交易(它會為每筆交易設定停損點,並依照策略規則自動平倉,以爭取最佳交易結果)。 我還會為買家提供各種資產的預設參數,讓該指標能發揮最大效能。請透過私訊聯繫我,免費獲得這些超級好處! ULTRA 策略的運作方式 ULTRA 指標會分析歷史價格數據(涵蓋約過去 4 年),並自動學習辨識波段反轉,以便在實際交易中為您創造最大利潤。 該指標的訊號絕不會重新繪製!!一切都盡可能做到真實且直觀! ULTRA 指標運用特殊的虛擬化演算法,根據歷史數據計算所有訊號的結果,並將其交易成果顯示於儀表板上。這意味著您甚至在開始交易之前,就能預先了解 ULTRA 指標
货币强度向导是一个非常强大的指标,为您提供成功交易的一体化解决方案。该指标使用多个时间范围内所有货币的数据来计算这个或那个外汇对的力量。此数据以易于使用的货币指数和货币电力线的形式表示,您可以使用它们来查看这种或那种货币的力量。 您所需要的只是将指标附加到您要交易的图表上,该指标将向您显示您交易的货币的真实强度。该指标还向您显示买卖量压力的极值,您可以在顺势交易时利用这些压力。该指标还显示了基于斐波那契的可能目标。该指标可用于各种交易时间范围。该指标支持各种货币对的交易。   该指标为您提供所有类型的警报,包括推送通知。 购买后请联系我。我将与您分享我的交易技巧,并免费为您提供丰厚的红利指标! 祝您交易愉快,获利丰厚!
Auto Optimized SpeedAngle 是一款机构级的动量向量化系统,通过持续的前瞻优化(Walk-Forward Optimization, WFO)彻底消除了曲线拟合(curve-fitting)。该指标没有采用在市场 状态转换时容易失效的静态输入参数,而是利用出样外验证(Out-of-Sample, OOS) dynamically 动态重新校准设置,从而确保显示的 信号代表真正的统计优势,而非历史巧合。 核心机构级架构 前瞻优化引擎(Walk-Forward Optimization Engine): 核心算法持续扫描数千种回溯周期(lookback)与阈值组合,严格将数据划分为样本内(in-sample)和样本外(out-of-sample)。只有当参数配置在未知数据环境中证明具备数学优越性时,系统才会对其进行 adoption。 量化目标函数(Quantitative Objective Functions): 优化引擎不一味追求绝对毛利,而是聚焦于机构级的稳定性指标。用户可针对系统质量数(SQN)、期望值(每笔交易的平均 R 倍数)或净 R 值进行优化,从而优
RelicusRoad Pro MT5
Relicus LLC
4.96 (25)
别再凭猜测做交易。 在同一张图表上看清何时入场、何时离场,以及市场的方向。 RelicusRoad Pro 将近二十种工具整合进一个指标,你可以只开启适合自己交易方式的那几项。 入场清晰。出场清晰。每张图表都有计划。 是不是很熟悉? 你刚买入,价格一分钟后就逆着你运行。 你出场太早,然后眼看着行情在你离场后继续走下去。 图表上有五个指标,给出五种不同的答案。 你的止损全凭猜测。 我们为何开发它 我们做外汇交易已有 18 年。RelicusRoad 背后的核心算法最初是在私下为我们自己的专业交易员圈子开发的。 初衷很个人。我们厌倦了一次次手工画同样的线,违反自己定下的规则,错过图表上真正重要的那一点。 对我们有效的是一致性:每天以同样的方式读图,直到它变成肌肉记忆。RelicusRoad Pro 把这种看盘方式带到你的图表上。 之后我们把它开放给更多交易员,因为一个小圈子能看到的东西有限。 每位交易员都会带来新的问题和想法,好的想法会进入下一次更新。今天其中很多工具之所以存在,是因为我们的交易员提出了需求。 这个社区保持私密且规模不大,同时活跃的交易员保持在 2,000 人以内。有些人使
Dynamic Forex28 Navigator MT5
Bernhard Schweigert
5 (1)
多货币强度与动量指标 MT5 Dynamic Forex28 Navigator 是我们长期受欢迎的指标的演进,把五种力量合而为一: Advanced Currency Strength28 Indicator(700 条评价) Advanced Currency IMPULSE with ALERT(530 条评价) Currency Strength EXOTICS GOLD Impulse with Alert CS28 Combo Signals(当前赠品) 无需购买四个指标并把它们堆在图表上。一切都合并在一个强大的指标中:28 个 Forex 货币对的强度、引领它们的市场动量,以及两者的警报——在一个窗口中,在一张图表上。 上述程序在 MQL5 Market 上合计获得超过 1,200 条评价,自 2016 年以来一直是 MT4 社区的一部分。Dynamic Forex28 Navigator MT5 延续同样经过验证的逻辑。 为 MetaTrader 5 完全重建——专为利用 MT5 原生多品种架构而设计。 用户手册: https://www.mql5.com/en/blo
下一次更新 — 版本 2.52 即将推出![全新功能] 准备迎接 4 项重大新功能,全面提升您的市场分析能力与交易流程! 我们将通过 4 项全新功能,进一步提升市场分析水平,满足您的交易需求。现为您介绍: 1. TRADE OVERVIEW DASHBOARD 2. CONFLUENCE AT ZONE 3. STRONG & WEAK HIGH/LOW 4. OTE 1. TRADE OVERVIEW DASHBOARD 一个帮助您更轻松地了解整体市场状况的仪表盘,为您的交易决策提供参考指引,帮助您系统地分析市场并规划交易,所有信息尽在一个屏幕中。 多时间周期市场概览(Multi-Timeframe Market Overview) 更清晰地了解市场方向与价格结构 快速查看市场状况 为系统化市场分析和入场规划提供指引。 2. CONFLUENCE AT ZONE 当价格进入关键区域时……您将了解有多少项支持因素相互吻合。 关键区域是交易决策至关重要的地方。但仅仅是价格进入某个区域还不够。此功能可帮助您在入场交易前,识别相互吻合的因素,包括信号及其他相关因素,从而进行更全面的分析,并
M1 Sniper MT5
Oleg Rodin
5 (7)
M1 SNIPER   是一款易于使用的交易指标系统。它是一个专为 M1 时间框架设计的箭头指标。该指标可以作为独立的系统在 M1 时间框架下进行剥头皮交易,也可以作为您现有交易系统的一部分使用。虽然该交易系统专为 M1 时间框架交易而设计,但它也可以用于其他时间框架。我最初设计此方法是为了交易 XAUUSD 和 BTCUSD。但我发现这种方法在其他市场交易中也同样有用。 指标信号既可以顺势交易,也可以逆势交易。我教授一种特殊的交易技巧,帮助您利用指标信号进行双向交易。该方法基于使用特殊的动态支撑位和阻力位区域。 购买后,您可以立即下载 M1 SNIPER 箭头指标。此外,我还为所有 M1 SNIPER 工具用户免费提供下方屏幕截图所示的 Apollo Dynamic SR 指标!这两个指标的组合可以帮助您更轻松、更准确地利用 M1 时间框架进行交易。 购买后请联系我,免费获取交易提示和奖励指标! 祝您交易成功!
Azimuth Pro
Ottaviano De Cicco
5 (7)
Azimuth Pro V2:MT5合成分形结构分析与确认入场 概述 Azimuth Pro 是 Merkava Labs 推出的多层级波段结构指标。四层嵌套波段层级、锚定波段的VWAP、ABC形态识别、三时间框架结构过滤以及收盘确认入场——一个图表,一个从微观波段到宏观周期的完整工作流程。 这不是盲目的信号产品。它是一个以结构为先的工作流程,专为重视位置、背景和时机的交易者打造。 1. V2的变化 合成多时间框架引擎 高时间框架分析从零开始重建,采用与Meridian Pro相同的专有合成架构。更清晰的HTF背景、稳定的实时行为、无经典MTF同步问题。合成引擎还解锁了 固定比率时间框架级联 (x2、x3、x4、x6)——不再在经纪商的固定时间框架之间任意跳转,您可以按图表时间框架的固定倍数分析结构,在每个尺度上保持相同的分形关系。 确认入场箭头 作为稳定且可恢复的执行层而设计的收盘确认箭头。当ABC设置形成且自适应确认逻辑在收盘K线上验证方向时,箭头会写入下一根K线的开盘,并设计为在刷新、切换时间框架、重新加载指标或重启终端等正常图表生命周期事件后仍能一致恢复。 这些不是独立的买
Boba Analysis Suite
Trade Ready Solutions LLC
5 (2)
Boba Analysis Suite Boba Analysis Suite 是一款适用于 MetaTrader 5 的分析指标。它将市场结构、关键价格区域和整体市场背景整合到同一图表视图中。 该指标源于交易及交易教学的实践经验,旨在帮助用户建立有条理的分析流程:评估市场方向、识别重要价位,并结合多个时间周期进行分析。 结合市场背景进行分析 单个信号的意义取决于市场背景。Boba Analysis Suite 帮助用户将当前图表状况与更大范围的市场结构相结合,并根据预先制定的规则评估交易思路。 分析功能包括: **趋势与市场结构:**评估市场方向及相关结构背景。 **关键价格区域与价位:**在图表上直观标示值得进一步分析的重要区域。 **多时间周期:**整合不同时间周期的信息,评估整体市场背景。 **可视化分析流程:**直接在图表上查看分析信息。 自主做出交易决策 Boba Analysis Suite 适合希望系统分析图表并结合多个时间周期信息的交易者。 该指标用于辅助分析,不会开仓或平仓,也不能替代交易策略或风险管理。每一笔交易的决策均由用户自行做出。 使用与许可 平台:Meta
Gold Sniper Scalper Pro
Ich Khiem Nguyen
3.9 (10)
Gold Sniper Scalper Pro 是一款专为检测 XAUUSD 上的 假突破 (false breakout)形态而构建的 MetaTrader 5 指标。它识别 4 根K线陷阱结构——价格突破区间边界、吸引突破交易者入场、然后反转回区间内部——确认该突破为虚假突破。指标通过 17 个质量因子对每个交易设置评分,经过 4 层汇流管道评估,对照 7 个时间框架趋势共识引擎验证,并通过黄金波动率状态分类器过滤——所有这些都在信号显示在图表之前完成。 详细的用户指南可在作者的   MQL5 博客   中找到。额外更新可通过作者的   MQL5 频道   获取。 根据当前的支持政策,购买者可能会获得作者开发的精选配套工具的额外使用权限。 该系统也适用于外汇货币对、指数和加密货币,但其检测参数、波动率处理和过滤器逻辑针对 XAUUSD 的特性进行了优化。 4 根K线假突破形态 检测引擎识别特定的四组件K线结构。Mother Bar 建立清晰的价格区间。一到三根 Inside Bar 在该区间内形成,压缩价格。False Breakout Candle 将价格推出边界——扫
Non repaint MT5
Yan Zhen Du
5 (1)
This is a professional chart indicator designed for traders focused on stability and clear price action. It helps filter market noise and provides clear visual entry and exit zones for your trading decisions. Price Information: The current price is promotional and is subject to change as upcoming updates and new features are released. MQL5 public channel:  CLICK HERE for MT4:  Non-repainting MT4 version Core Features: Strictly Non-Repainting:   The system is built with strict non-repaint logic.
Power Candles MT5
Daniel Stein
4.58 (12)
Power Candles V3 - 自我优化的强度指标 Power Candles V3 把货币与品种的强度直接转化为图表上可执行的交易方案。指标不再仅根据强度给K线着色,而是在后台持续运行实时自动优化,为您正面对的品种给出最佳 Stop Loss、Take Profit 与信号阈值。一键采用,Entry、Stop Loss、Take Profit 线就以精确价格绘制在图表上,提醒消息中直接包含方向。 本工具是 Stein Investments 生态系统的一部分 - 18+ 款工具,加上 Max,您的一对一 AI 交易导师。  随时在线,深入了解每一款指标,在您需要梳理思路的那一刻就在那里。  立即认识他: https://stein.investments 每根收盘K线运行 3,000+ 次交易模拟。9 种强度状态。2 种策略并行测试。一键采用最优配置。 为什么需要这个 大多数强度指标只给您一个数值,然后留下三个问题:相信哪个阈值、用哪个 Stop Loss、走哪个交易方向。Power Candles V3 在每根收盘K线上自动回答这些问题。结果就是一个完整的交易方案 -
FX Levels Premium indicator for MT5
Renaud Herve Francois Candel
Fx Levels Premium Indicator Support and Resistance are important concepts in trading. Fx Levels Premium was created to easily draw important levels of support and resistance for the active trader. The indicator will give you all important levels (support/resistance) to watch for a wide range of assets. Trading without these levels on your chart is like driving a car for a long journey without a roadmap. You would be confused and blind. Support and resistance levels should be used as guideline
OrderFlux – MetaTrader 5用 Order Flow Footprint Chart・Volume Profile・Market Profile インジケーター OrderFluxは、MetaTrader 5用のオーダーフローFootprintインジケーターです。各ローソク足の内部で何が起きているのかを視覚的に分析できます。1本のローソク足を展開し、価格レベルごとの取引量を表示するとともに、買い手と売り手の成行注文による積極的な取引を区別します。TickデータからリアルタイムでFootprintチャートを構築し、Delta、Imbalance、Absorption、Volume Profile、Market Profile(TPO)、VWAP、Cumulative Delta(CVD)、DOMタブ、経済カレンダーを、見やすく整理された1つのインターフェースに統合します。 通常のチャートが表示するのは、始値、高値、安値、終値だけです。これらは値動きの結果であり、その原因ではありません。OrderFluxは、オーダーフロー取引の中心的な疑問に答えます。実際に値動きを主導
Meridian Pro
Ottaviano De Cicco
4 (3)
Meridian Pro 2.00:MT5 专业多周期趋势矩阵 Meridian Pro 2.00 是面向 MetaTrader 5 的专业自适应趋势矩阵。它结合了原始 Meridian 趋势引擎、清晰的图表 ribbon、收盘柱确认箭头、8 周期 dashboard、Fuel 动量、加权共识、合成 HTF 处理,以及直接显示在当前图表上的高周期环境线。 目标很简单:在一个有纪律的 workflow 中读取当前趋势、多周期结构、强度、动量和 EA-ready 状态,而不是在多个图表上堆叠互不关联的指标。 Meridian Pro 的不同之处 一个自适应引擎 - 同一套波动率感知 Meridian 逻辑应用于 M1 到 W1。 合成 HTF 架构 - 高周期行由低周期数据推导,减少传统零售 MTF 中常见的 repaint、同步延迟和 broker-dependent HTF 质量问题。 完整矩阵输出 - Bias、Strength、Fuel 和加权 Consensus 一起显示,而不是拆成独立工具。 图表执行层 - ribbon 和箭头专注于当前周期,选配 HTF 线在同一图表上增加高
PZ Swing Trading MT5
PZ TRADING SLU
5 (5)
Swing Trading 是第一个旨在检测趋势方向的波动和可能的反转波动的指标。它使用在交易文献中广泛描述的基准摆动交易方法。该指标研究多个价格和时间向量,以追踪总体趋势方向,并检测市场超卖或超买并准备好进行修正的情况。 [ 安装指南 | 更新指南 | 故障排除 | 常见问题 | 所有产品 ] 市场波动的利润不会被窃取 指示器始终显示趋势方向 彩色价格带代表机会基准 彩色虚线表示可能的反转波动 该指标分析其自身的质量和性能 它实现了一个多时间仪表板 可定制的趋势和波动周期 它实现了电子邮件/声音/推送警报 指示器为非重涂或重涂 什么是摇摆交易 摇摆交易是一种尝试在一天到一周内从证券中获得收益的交易方式,尽管某些交易最终可以保持更长的寿命。摇摆交易者使用技术分析来买入弱点和卖出力量,并有耐心等待这些机会的发生,因为在发生一波抛售浪潮之后购买证券而不是陷入抛售更有意义。 机会基准 关于历史数据的大量研究证明,适合于波动交易的市场倾向于在基线价格带上下交易,基线价格带由图表显示,使用平均真实区间计算得出。波动交易者使用基线,该策略是购买常态和卖出躁狂,或做空常态并掩盖沮丧。在没有疲
Crystal Heikin Ashi Signals
Muhammad Jawad Shabir
5 (6)
Crystal Heikin Ashi Signals—Professional Trend & Signal Detection Indicator Advanced Heikin Ashi Visualization with Intelligent Signal System for Manual & Automated Trading Final Price: $149 ---------> Price goes up $10 after every 10 sales . Limited slots available — act fast . Overview User Guide PDF Crystal Heikin Ashi Signals is a professional-grade MetaTrader 5 indicator that combines pure Heikin Ashi candle visualization with an advanced momentum-shift detection system. Designed for both m
Neuro Poseidon MT5
Daria Rezueva
4.68 (53)
Neuro Poseidon is a new indicator by Daria Rezueva. It combines precise trading signals with adaptive TP/SL levels - creating best possible trades as a result! Message me and get  Neuro Poseidon Assistant  as a gift to automize your trading process! What makes it stand out? 1. Proven profitability on all assets and timeframes 2. Only confirmed BUY and SELL signals present on the chart 3. Adaptive TP & SL levels generated by the software for each trade 4. Easy to understand - suitable for al
Trend Lines PRO MT5
Roman Podpora
5 (1)
TREND LINES PRO 帮助您了解市场真正的方向转变点。该指标显示真实的趋势反转点以及主要参与者重新入场的时机。 您可以看到 BOS线、 趋势变化和更高时间框架的关键水平——无需复杂的设置或不必要的干扰。信号不会重绘,并在K线收盘后仍然保留在图表上。 VERSION MT4    -   与……搭配使用时,可发挥其最大潜力   RFI LEVELS PRO 指示器 该指标显示的内容: 实际变化 趋势(BOS 线) 一旦信号出现,它就始终有效!这与会重绘的指标有着重要的区别,后者可能会发出信号后又改变信号,从而导致资金损失。现在,您可以更精准、更准确地进入市场。此外,还有一个功能,会在箭头出现后为K线着色,直到达到目标价位(止盈)或出现反转信号为止。 重复条目   以及主要玩家的充值 为了提高寻找入场点时的视觉清晰度,我们创建了一个模块,该模块首先显示买入/卖出区域,并在该区域内寻找最佳入场点。此外,我们还加入了智能逻辑来管理止损位,该逻辑会随着时间的推移逐步降低止损位的大小,从而降低入场交易时的初始风险(移动止损位)。 信号强度水平(BOS) 该指标采用三个显著性等级来衡量趋
Murrey Math Classic
Sarvarbek Abduvoxobov
5 (2)
Murrey Math Classic Murrey Math Classic 是一款专业且动态的交易指标,旨在以极高的数学精准度预测金融市场的价格走势。该系统将传奇的价格-时间几何学进行了现代化改造,将其转化为适用于现代金融市场的高度结构化数学模型。 莫里数学(Murrey Math)的核心逻辑在于,金融市场并非随机移动,而是按照特定的节奏运行。就像音乐被划分为八度音阶的 8 个音符一样,任何给定的价格区间都被划分为 8 个相等的数学级别(从 0/8 到 8/8)。这些线条充当了隐藏且高度可靠的支撑位与阻力位区域,在价格到达之前就能揭示潜在的转折点。 Code2Profit 频道 指标如何工作 | 完整策略概述 终极多重确认入场策略详解 为什么 Murrey Math Classic 优于传统指标 Murrey Math Classic:从理论到图表精准度 指标历史与概念 该系统由 T. Henning Murrey 于 1995 年创建,并发表在其开创性著作《莫里数学 trading 系统》("The Murrey Math Trading System")中 莫里
Bill Williams Advanced
Siarhei Vashchylka
5 (11)
Bill Williams Advanced is designed for automatic chart analysis using Bill Williams' "Profitunity" system. The indicator analyzes four timeframes at once. Manual (Be sure to read before purchasing) Advantages 1. Analyzes the chart using Bill Williams' "Profitunity" system. Signals are displayed in a table in the corner of the screen and on the price chart. 2. Finds all known AO and AC signals, as well as zone signals. Equipped with a trend filter based on the Alligator. 3. Finds "Divergence Bar
Advanced Supply Demand MT5
Bernhard Schweigert
4.53 (15)
任何新手或专业交易者的最佳解决方案! 该指标是一款独特、高质量、且价格合理的交易工具,因为我们已经整合了许多专有功能和新公式。 依据此更新,您将能够显示双重时间帧区域。 您不仅可以显示一个较高的时间帧,还可以同时显示图表时间帧,加上更高的时间帧:显示嵌套时区。 供需双方所有交易者都会喜欢它。 :) 重要信息披露 高级供需的最大潜力,请访问 https://www.mql5.com/zh/blogs/post/720245   想象您的交易如何得以改善,是因为您能够精准定位入场或目标位吗? 构建于新的底层算法,它可以更轻松地识别出买卖双方之间的潜在失衡。 这是因为它以图形方式展示供需最强劲区域,及其过去的表现(显示旧区域)。 这些功能旨在帮助您更轻松地发现最佳入场区域和价位。 现在您可以针对您的交易品种和时间帧来优化和编辑区域强度! 高级供需指标适用于所有产品和时间帧。 它是一个新的公式,非常新的功能是两个区域强度函数可由用户输入进行调整! 这在交易中是一大优势。 当您学习如何使用专有功能,例如带有价格游离最小 X 因子的区域强度时,您能够判断该区域强劲与否。 供需区域用作警报触发器。
TPA True Price Action indicator reveals the true price action of the market makers through 100% non-repainting signals strictly at the close of a candle! TPA shows entries and re-entries, every time the bulls are definitely stronger than the bears and vice versa. Not to confuse with red/green candles. The shift of power gets confirmed at the earliest stage and is ONE exit strategy of several. There are available now two free parts of the TPA User Guide for our customers. The first "The Basics"
ARICoins
Temirlan Kdyrkhan
ARICoin is a powerful trading companion designed to generate high-probability entry signals with dynamic TP/SL/DP levels based on volatility. Built-in performance tracking shows win/loss stats, PP1/PP2 hits, and success rates all updated live. Key Features: Buy/Sell signals with adaptive volatility bands Real-time TP/SL/DP levels based on ATR Built-in MA Filter with optional ATR/StdDev volatility Performance stats panel (Success, Profit/Loss, PP1/PP2) Alerts via popup, sound, push, or email Cust
Basic Harmonic Patterns Dashboard MT5
Mehran Sepah Mansoor
4.36 (11)
该仪表盘显示所选符号的最新可用谐波形态,因此您可以节省时间并提高效率 /  MT4 版本 。 免费指标:  Basic Harmonic Pattern 指标列 Symbol:   显示所选符号 Trend:     看涨或看跌 Pattern:    形态类型(Gartley、蝴蝶、蝙蝠、螃蟹、鲨鱼、Cypher 或 ABCD) Entry:     入口价格 SL: 止损价 TP1: 第一止盈价 TP2: 第二次获利价格 TP3: 第三次获利价格 Current price:    当前价格 Age (in bars):   最后绘制的模式的年龄 主要输入 Symbols :   从 "28 种主要货币对 "或 "选定符号 "中选择。 Selected Symbols :   希望监控的符号,用逗号分隔("EURUSD,GBPUSD,XAUUSD")。如果您的经纪商为货币对设置了后缀或前缀,您必须在以下两个参数中添加(货币对前缀或货币对后缀)。 Max Iteration:   调整模式的最大迭代次数(如果该值越小,则模式越少,性能越快;如果该值越大,则模式越多,性能越慢)
Superhero
Ihor Otkydach
5 (3)
SUPERHERO 指標是一款基於「全方位」原則設計的多貨幣交易系統。該指標能獨立分析市場,並提供開倉與平倉的交易訊號。它採用止損與獲利了結訂單,風險報酬比(R:R)為 1:1。 此系統可向您的智慧型手機發送推播通知,讓您無需綁定電腦,即可「隨時隨地」進行交易。這對於自營交易公司而言再適合不過了。 每位顧客皆可享額外好禮: 每位購買此指標的買家,都將收到我贈送的一項特別實用工具,該工具: 自動下達止損與獲利了結訂單 當價格達到目標水準時,系統會自動平倉 支援待執行訂單交易 支援均值交易模式 如果您希望將這款優秀且極為便利的工具作為禮物獲贈,請在購買 SUPERHERO 指標後,立即透過 MQL5 平台的私訊與我聯繫。此外,您還將獲得培訓課程「如何安裝與設定 SUPERHERO 並開始穩定獲利」的存取權限。 關於「超級英雄」策略 SUPERHERO 策略是利用價格回調時,順應趨勢方向進行盤中交易。 「超級英雄」程式碼內含數個強大的技術指標,用以分析價格通道的趨勢方向與波動範圍,並能識別在修正性回調後形成的盤中波段反轉形態。 SUPERHERO 指標採用獨特的自我優化演算法,一旦添加至價格
Apex Patterns PRO 购买指标 — 免费获取基于该指标的 Expert Advisor。 自我优化的图表形态与突破分析智能 传统的形态扫描器依赖固定输入,在市场波动和结构发生变化时通常表现不佳。 Apex Patterns PRO 旨在适应不断变化的市场条件,将结构性图表形态识别、动量过滤和统计自我优化结合到一个分析框架中。 适应性扫描引擎 自我优化形态模式 在近期历史数据中自动搜索合适的形态参数,使指标能够根据当前市场行为调整其结构检测,而不是使用静态配置。 智能突破过滤 将经典形态识别与动量、成交量和价格行为指标相结合。引擎不会同等对待每次突破,而是评估潜在的市场结构,以识别符合当前统计环境的交易设置。 主要功能 固定的、不重绘的实时信号 自我优化的形态检测参数 丰富的图表结构库(顶部/底部、头肩顶/底、三角形、楔形) 基于动量和成交量的突破过滤 基于市场结构的动态止损和止盈水平 图表信号和实时性能指标 标准的推送、电子邮件和平台提醒 专为适应不断变化的市场条件而设计,而非依赖永久固定的参数 核心理念 目标不是将静态的几何形状强加于动态的市场。 目标是让历史市场数据
作者的更多信息
Gold Killzone Sweep Matrix trades the most famous ICT idea for gold. Every kill zone (Asia, London, New York) leaves a high and a low . Stop orders sit beyond them, and that is liquidity . Smart money takes this liquidity (the sweep ) and then turns the market (the change of character, CHoCH ). Most kill zone indicators only draw the lines and leave the rest to you. This one does the whole job. It finds the sweep, confirms the CHoCH and prints a buy or sell arrow with entry, stop loss and target
Footprint Matrix Pro turns your MetaTrader 5 chart into an order-flow footprint chart . Every column shows who traded at each price: aggressive buyers lifting the ask against aggressive sellers hitting the bid. It is built from the real tick history of your broker, and every number is recorded tick by tick from the market data. You can see absorption, exhaustion, imbalances and real displacement as they happen, inside the candle and not only after it closes. Five footprint modes (one click) Bi
Omni Signal Copier – Telegram, Discord, Slack and TradingView signals into MetaTrader 4 Omni Signal Copier reads trading signals from Telegram, Discord, Slack, TradingView alerts (via ntfy), text files and manual input , understands them with a multi-language parser and trades them on your MetaTrader account – with multi-TP, break-even, trailing, a prop-firm guard and a live dashboard with 8 tabs. Everything runs inside the Expert Advisor: no extra program, no DLL, no external server of ours . T
️ TRADE ESCORT COMMANDER – Your trades never walk alone The trade manager + account shield in one. Open your trades the way you like – by hand, with any Expert Advisor or with a signal copier. Trade Escort Commander takes them over within a second and escorts every single one: automatic stop loss, break-even incl. fees, 5 staggered partial take profits , 5 trailing methods , hidden stops – and a prop-firm shield that protects the whole account against daily loss and drawdown. All symbols fro
QUARTER ZONE SCALPER Pullback signals · 25 % quarter zone target · live hit-rate lab · MT4 + MT5 Quarter Zone Scalper turns a simple pullback scalping method into clear, non-repainting signals. A trend ribbon sets the side, price pulls back through the EMA 20 and closes back on the trend side, and a stochastic 8 / 5 / 3 cross confirms. Every signal comes with the pullback swing, a stop and four targets - with the 25 % "quarter zone" as the main target. The idea: the less of a move you ask
Signal Verdict Pro reads the indicators that are already on your chart, finds the signal that just fired and gives it a verdict : does this signal have substance, or is it noise? Every signal gets a score from 0 to 100 from 17 scenario checks, the indicator's own track record on this chart and a live repaint test. You keep your indicators and your strategy. Signal Verdict Pro adds the second opinion: STRONG , VALID , WEAK or REJECT , with the reasons for and against the trade. Works with the i
Currency Velocity Matrix shows the strength of the 8 major currencies ( EUR, GBP, AUD, NZD, USD, CAD, CHF, JPY ), calculated from all 28 pairs . It also shows the rate of change : which currency is gaining strength the fastest and which one is losing it the fastest. Knowing which currency is strong is not enough. A strong currency may already be losing momentum. The best opportunities usually appear when the currency gaining strength the fastest meets the currency losing strength the fastest . T
Market Maker Cycle Matrix shows the daily market maker cycle on your MetaTrader 5 chart. The Asian session builds a range. The London open often runs the stops on one side of it. Then the real move starts, room after room, until the market maker reaches the target and the cycle turns. The indicator tracks this cycle for you: the Asian range , the kill zones , the level count L1 / L2 / L3+ , the peak formation that turns the cycle, and five M15 entry types with entry, stop loss and two targets. A
Triple Edge Prop – three rule-based NASDAQ-100 intraday strategies in one Expert Advisor. Each engine has its own logic, its own magic number, its own timeframe and its own trading window. Together they cover three different market situations: a volatility breakout , an institutional VWAP pullback and an overnight bias breakout . Built for prop-firm challenges and funded accounts, with a full challenge guard on board. Why three strategies instead of one? A single strategy goes through losing
Volatility Range Compass is a volatility dashboard for MetaTrader 5. It answers the questions every trader has before entering a trade: How far does this market normally move in a day, a week, a month? (ADR, AWR, AMR) How much of today's normal move is already done, and is there still room? (% of ADR used, ADR targets) How volatile is each timeframe right now compared with its own history? (ATR matrix M1 to W1 with regime) Which hours of the day move the most? (volatility clock) How big should m
Trend Exhaustion Radar answers one question that every trader asks in a strong move: is this trend running out of strength? Instead of watching three oscillators at the same time and missing the moment, the indicator reads DI+ / DI-, ADX and RSI for you, finds the classic warning signs - extreme zones, divergences, ADX hooks - and combines them into one traffic light with a rule score from 0 to 6. You get three windows in one product: the price chart with a 9/21 EMA cloud, warning markers and di
Omni Signal Copier – Telegram, Discord, Slack and TradingView signals into MetaTrader Omni Signal Copier reads trading signals from Telegram, Discord, Slack, TradingView alerts (via ntfy), text files and manual input , understands them with a multi-language parser and trades them on your MetaTrader account – with multi-TP, break-even, trailing, a prop-firm guard and a live dashboard with 8 tabs. Everything runs inside the Expert Advisor: no extra program, no DLL, no external server of ours . The
️ TRADE ESCORT COMMANDER – Your trades never walk alone The trade manager + account shield in one. Open your trades the way you like – by hand, with any Expert Advisor or with a signal copier. Trade Escort Commander takes them over within a second and escorts every single one: automatic stop loss, break-even incl. fees, 5 staggered partial take profits , 5 trailing methods , hidden stops – and a prop-firm shield that protects the whole account against daily loss and drawdown. All symbols fro
️ SECONDS CANDLE FORGE – See what the M1 chart hides One M1 candle can hide a spike, a stop hunt, a fake breakout and the real entry – all in 60 seconds. MetaTrader 5 stops at M1. Seconds Candle Forge opens real 1-second to 3600-second candle charts built from your broker's own ticks, live, tick by tick. And they are not pictures: they are normal MT5 charts . Your indicators, drawings, templates and even your Expert Advisors run on them. S1 … S3600 – any seconds timeframe   Real tick data,
QUARTER ZONE SCALPER Pullback signals · 25 % quarter zone target · live hit-rate lab · MT4 + MT5 Quarter Zone Scalper turns a simple pullback scalping method into clear, non-repainting signals. A trend ribbon sets the side, price pulls back through the EMA 20 and closes back on the trend side, and a stochastic 8 / 5 / 3 cross confirms. Every signal comes with the pullback swing, a stop and four targets - with the 25 % "quarter zone" as the main target. The idea: the less of a move you ask
筛选:
无评论
回复评论