RelativeVolume
- 指标
- 版本: 1.20
- 激活: 10

See When Volume Really Matters
Not all volume is equal.
The Relative Volume (RVOL) Indicator helps you quickly identify when the market is experiencing unusually high trading activity compared with its recent average.
Instead of simply showing how much volume is trading, RVOL puts current volume into context—making it easier to spot moments when buyers or sellers may be becoming more active.
Key Features
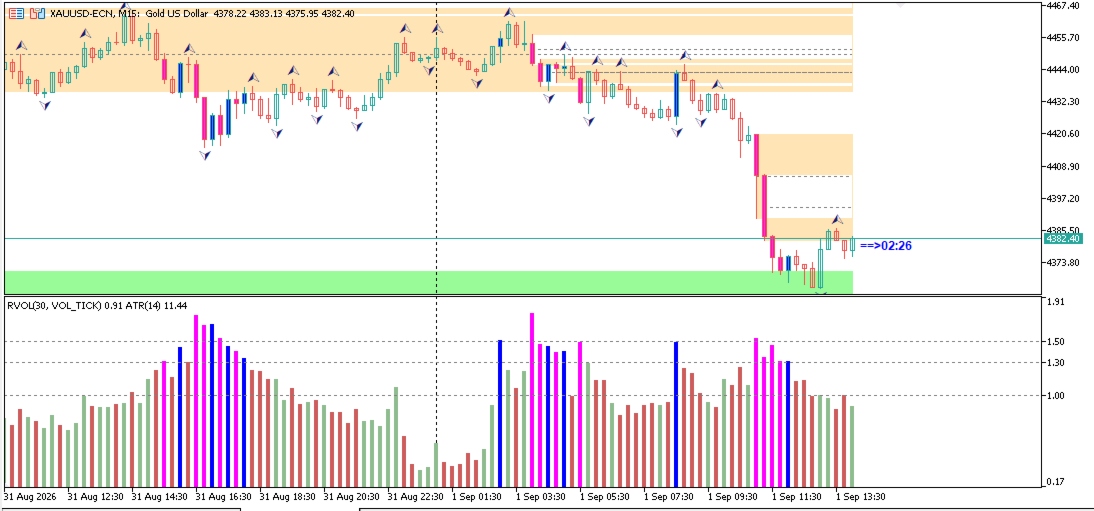
🔵 Identify High-Volume Bullish Moves
Quickly spot candles where strong volume is accompanied by bullish price movement. These can highlight periods of increased buying activity.
🟣 Identify High-Volume Bearish Moves
See when unusually high volume occurs alongside bearish price action, helping you recognize potential periods of increased selling pressure.
📊 Relative Volume Reading
Compare the current volume against its recent average to determine whether market activity is normal or unusually strong.
🚨 High-Volume Highlighting
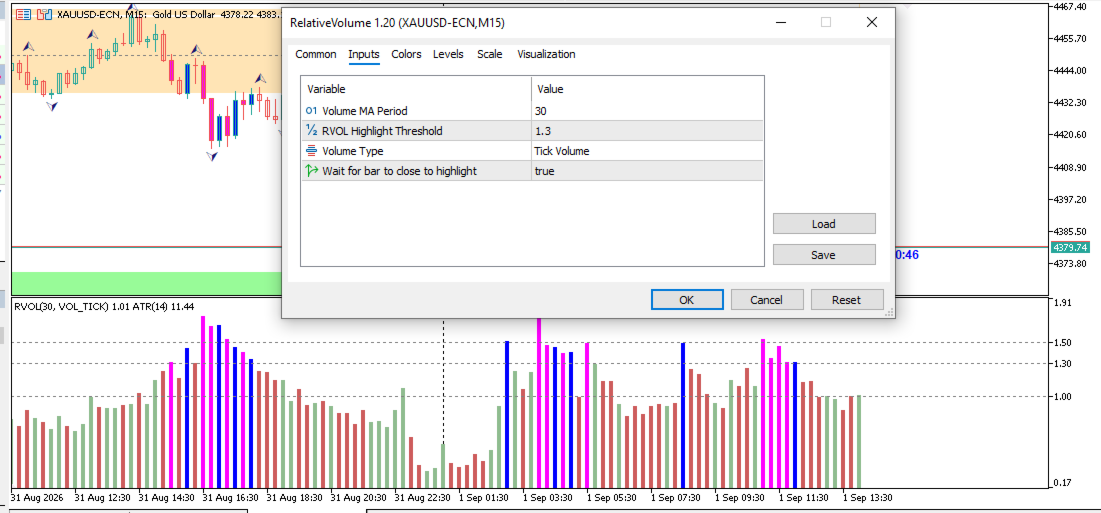
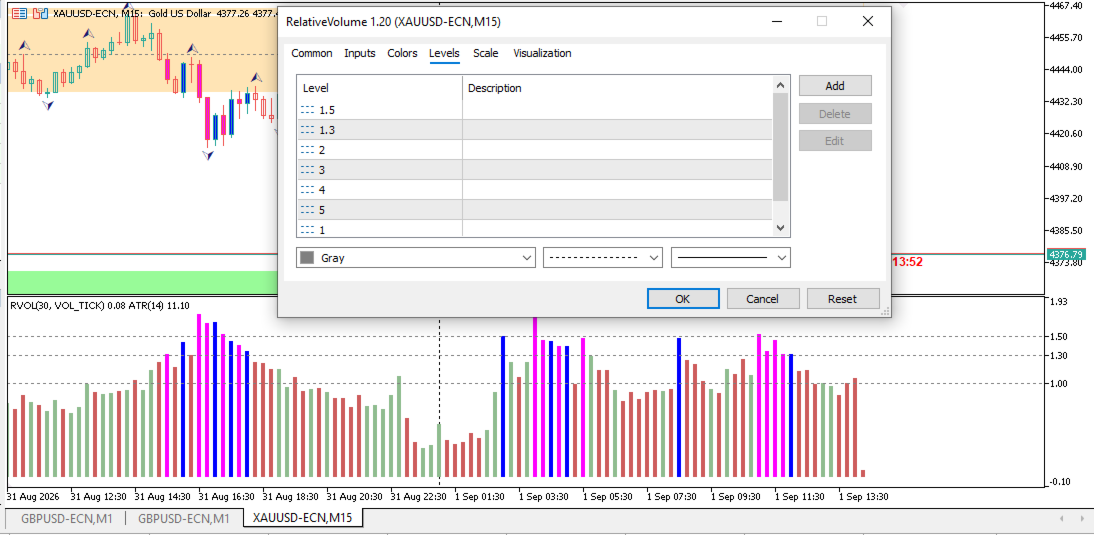
Set your own threshold for what qualifies as significant volume. When volume reaches your chosen level, the indicator visually highlights it so important activity stands out immediately.
🎨 Easy-to-Read Color Coding
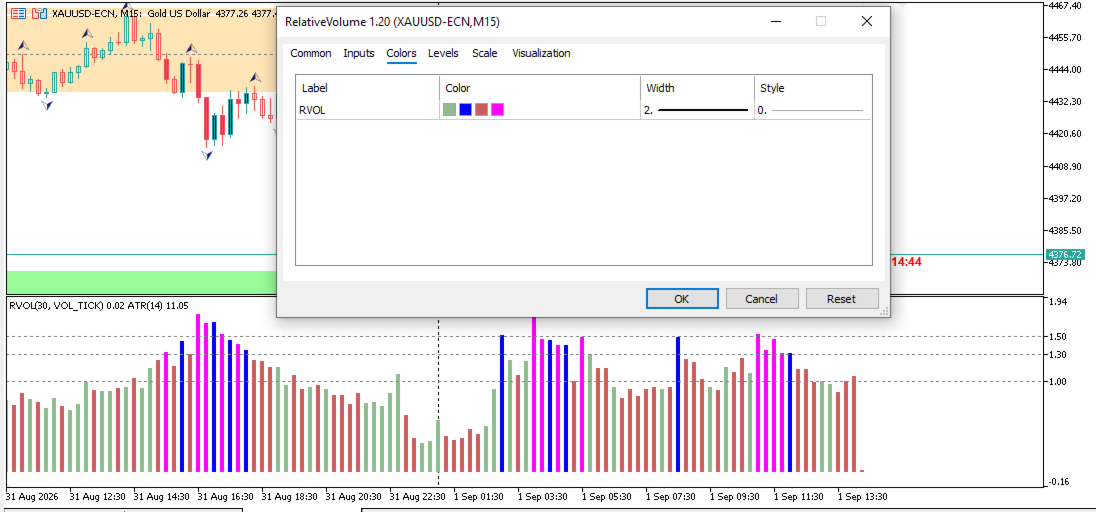
Volume bars are separated into four simple categories:
-
Normal Bullish Volume
-
High Bullish Volume
-
Normal Bearish Volume
-
High Bearish Volume
This allows you to understand volume + price direction at a glance.
⏱️ Tick Volume or Real Volume
Choose between available Tick Volume and Real Volume data depending on your broker and trading environment.
🔒 Closed-Bar Confirmation
Optional closed-bar confirmation prevents the currently forming candle from being prematurely classified as high volume. This helps reduce misleading highlights while a candle is still developing.
⚙️ Customizable Settings
Adjust the volume averaging period and high-volume threshold to suit your preferred trading style and market.
Why Use RVOL?
Volume can provide important context behind price movements.
A price breakout accompanied by unusually strong volume may tell a very different story from a breakout occurring on weak activity.
RVOL helps make these differences easy to see directly on your chart.
Designed For
✔ Day Traders
✔ Scalpers
✔ Swing Traders
✔ Breakout Traders
✔ Price Action Traders
✔ Volume-Based Strategies
✔ Multi-Market Traders
Use It To Spot
• Unusual market activity
• Strong buying participation
• Strong selling participation
• Volume-supported price moves
• Potential breakout confirmation
• Changes in market participation
• Periods of unusually high activity
Trade the move—but understand the activity behind it.
The Relative Volume Indicator gives you a simple visual way to see when volume is normal, when it is unusually strong, and whether price is moving with bullish or bearish pressure.