Sweet Waffle
- 指标
- 版本: 1.1
- 激活: 20

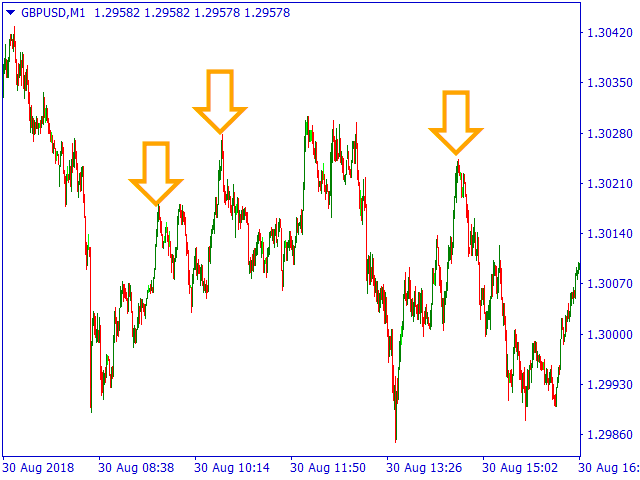
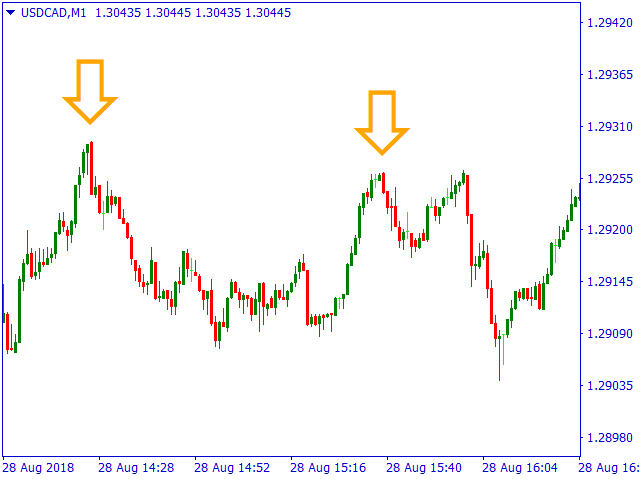
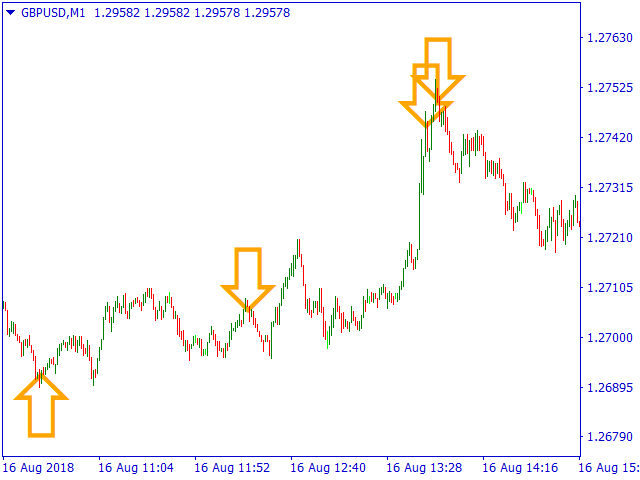
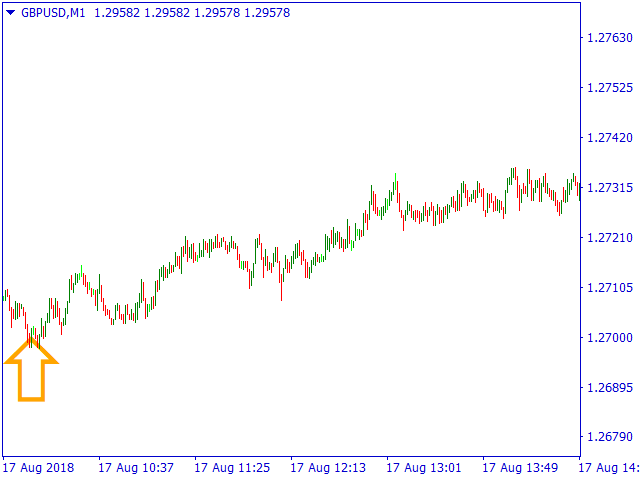
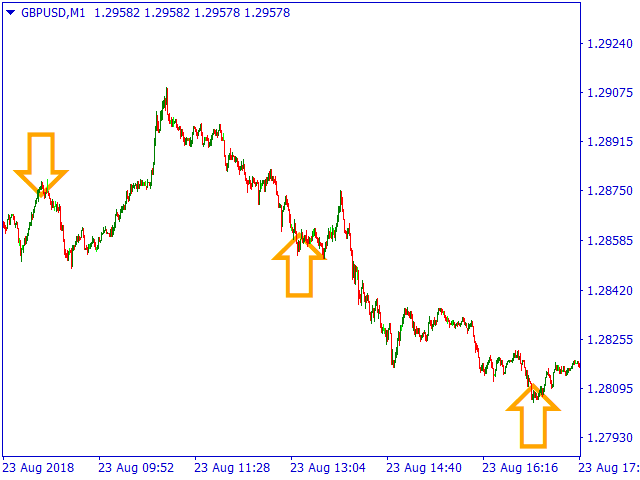
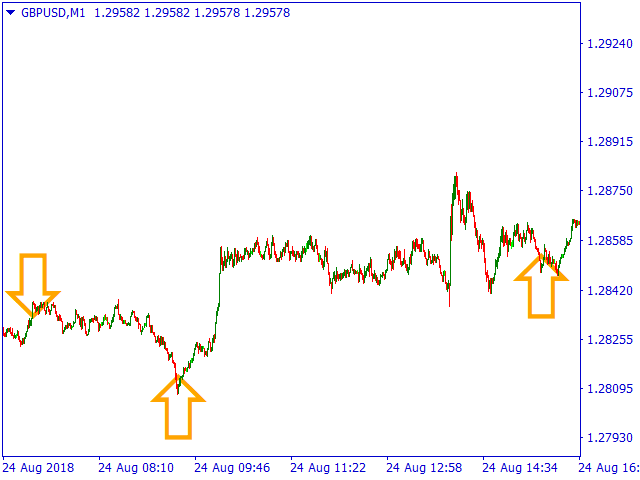
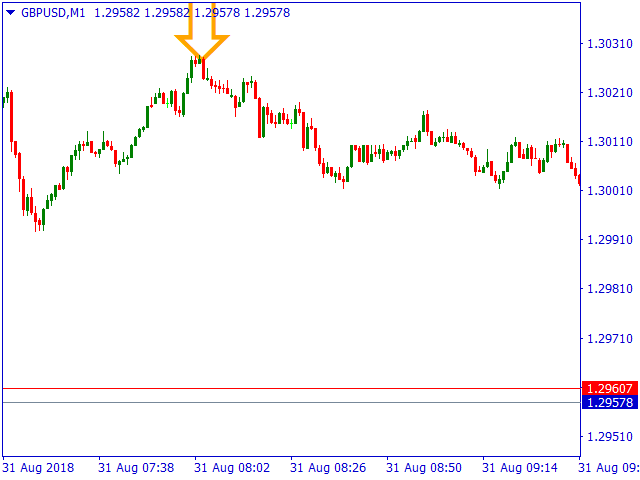
The arrows are calculated with:
- 2 Parabolic parameters
- 2 ADX parameters
- 4 Stochastic parameters
We recommend to combine it with Parabolic, ZigZag or Elliot waves indicator.
Always trade the trend!
If you make sure to draw your trend lines and support/resistance zones you will just have to wait for the signal to appear.
Take the trade.
For Binary Options it is advisable to set the expiry time to 5-15 min in M1 chart.
THIS INDICATOR IS ZERO REPAINT
Best assets to trade:
- EUR/USD
- AUD/USD
- NZD/USD
- USD/JPY
Best Timeframe: M1
Trading hours: Avoid news and market closure / opening.
Alert parameters :
- Sound alert
- Push notification
- Email notification
The number of signals a day can vary between 2 - 8 per asset per day.
Happy trading!
hbm

用户没有留下任何评级信息