CR7Structure

CR7 结构——市场结构解码。

价格波动并非随机,而是取决于决策。CR7 Structure旨在精准地向您展示这些决策的制定过程,以及其中一项决策失败的瞬间。

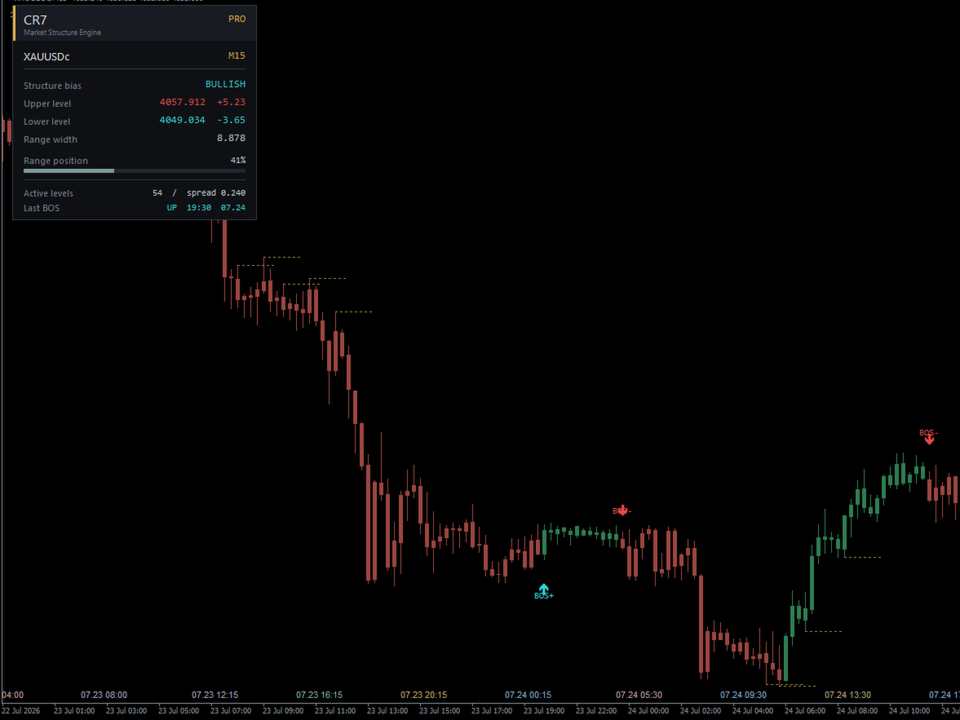
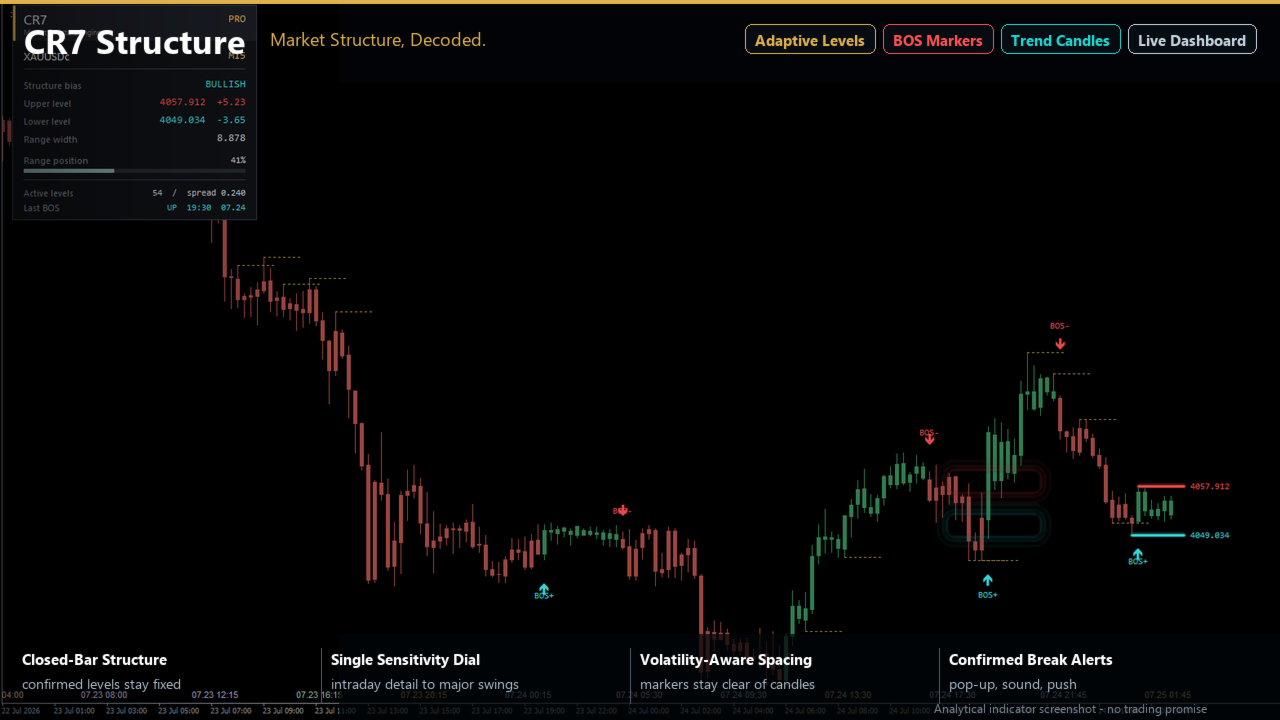
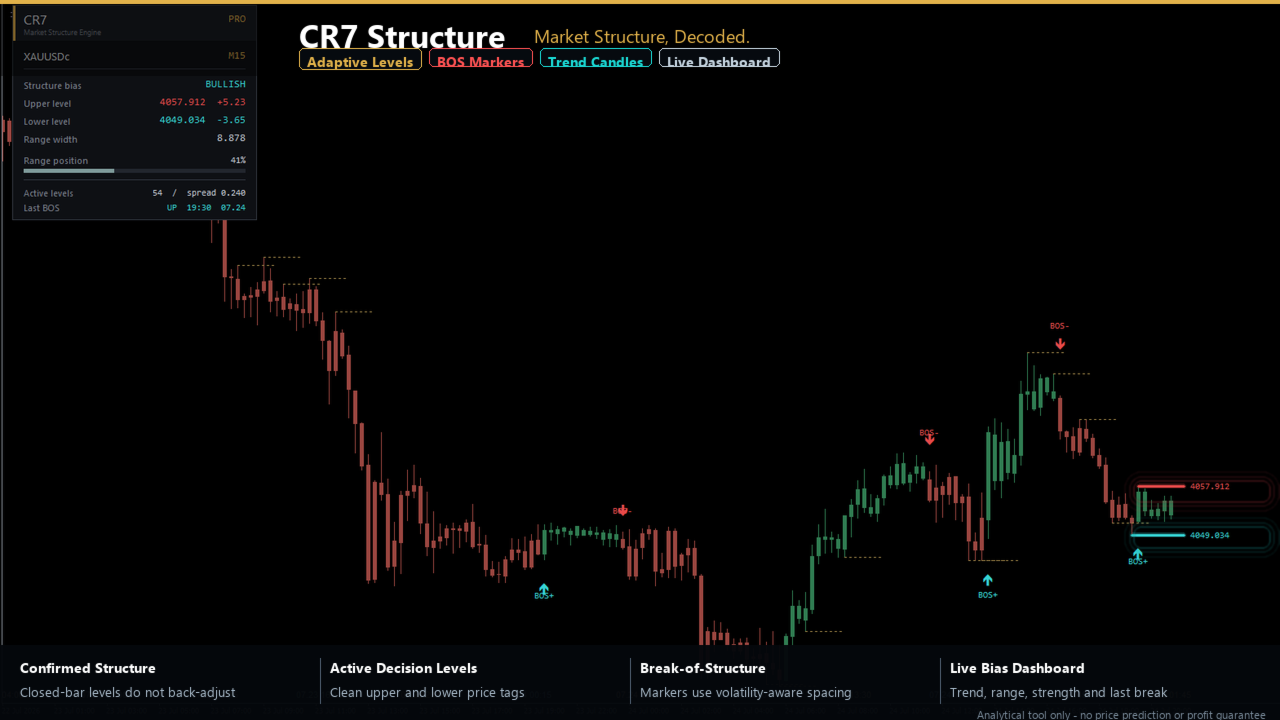
大多数结构分析工具会用几十条线淹没图表,让你自己去猜测哪些线才是关键。CR7 则恰恰相反。它的自适应过滤引擎会持续评估市场波动,只保留当前价格实际遵循的水平。其他所有信息在显示到你的屏幕之前就被舍弃了。

当这些价位之一真正被突破时,CR7 指标会标记突破点,反转趋势状态,并按照市场既定方向重新绘制K线图。你会在突破真正发生的那一刻就看到这种转变——而不是三根K线之后,也不是在一个原本就无关紧要的价位上。

图表上显示的内容

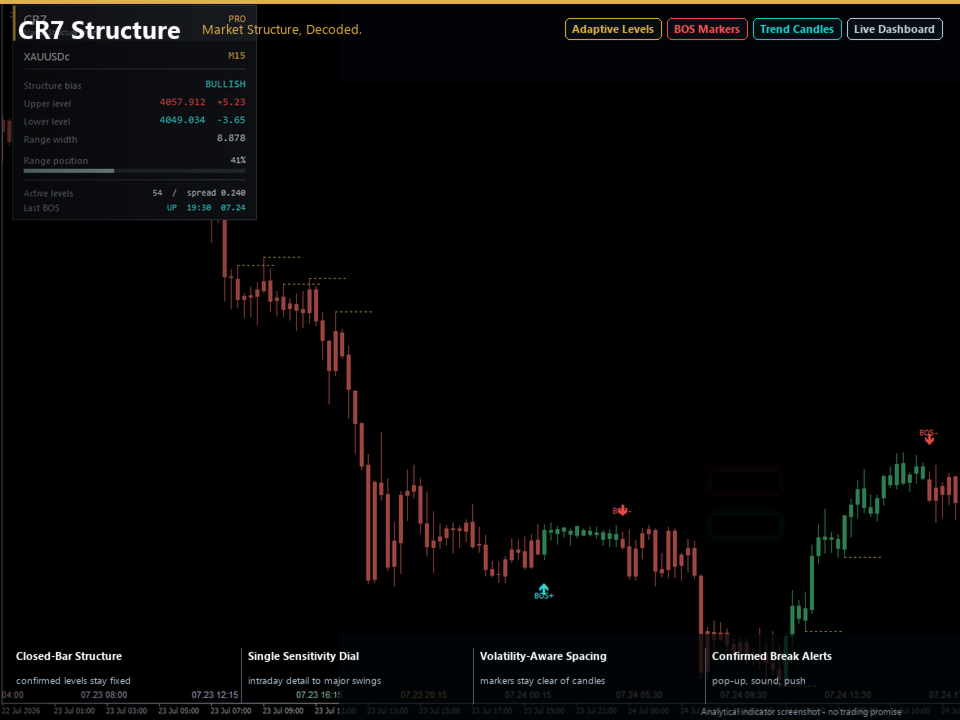
清晰的结构水平线,并以自适应发光效果突出显示当前最重要的两个水平线。活跃结构上实时显示价格标签。突破结构标记采用波动率感知间距,确保它们不会与K线重叠。趋势状态K线颜色有两种可选模式。实时仪表盘显示当前趋势、活跃结构价格、区间宽度、结构强度以及最近一次确认的突破。四款精心调校的专业主题——Aurum、Neon、Carbon和完全自定义。

专为真实交易环境而设计

已确认的K线结构不会改变。无需回溯调整,信号不会消失,也无需事后完美截图。适用于所有交易品种和所有时间周期,从M1短线交易到D1持仓操作,只需一个灵敏度调节旋钮即可匹配您的交易风格。K线渲染会随缩放级别自动调整。仅在确认突破时发出弹出窗口、声音和移动推送提醒。

适用人群

对于那些已经明确入场策略,需要可靠、清晰地了解市场背景的交易者而言,这款产品尤为实用:它能清晰地展现哪一方占据主导地位、双方的底线在哪里,以及底线是否已经突破。它既可以作为独立的结构图使用,也可以叠加在现有的订单流、供需关系或信息通信技术(ICT)工作流程中。

关键输入

结构灵敏度   ——只需一个旋钮即可定义多少波动才能被视为结构。较低的值追踪日内细节;较高的值则仅突出显示主要转折点。 显示深度 ——结构绘制的范围,可选择简洁图表或完整映射图表。 主题 ——四个预设主题,或自定义每种颜色。 标记模式 ——标记每个已确认的突破,或仅标记真正的趋势反转。K 线模式 ——显示连续趋势,或仅突出显示突破K线。 仪表盘和警报 ——完全控制位置、大小和通知渠道。                    

常问问题

Does it repaint? Structure confirmed on a closed bar is final. The current forming bar is optional and clearly separated in the settings. Is this a complete trading system? No, and it is not sold as one. It is a context and decision-framework tool. Entries, sizing, and risk remain yours. Which markets? Any symbol with clean price data — FX, metals, indices, crypto, futures.

Trading involves substantial risk. This product is an analytical tool. No indicator can predict future prices, and past behavior does not guarantee future results.
推荐产品
Crypto_Forex 指标“相对回撤显示”适用于 MT4,是实用的交易工具。 ............................................................................ 对于使用网格交易系统的交易者来说,这是必备指标!!! - 相对回撤显示指标显示您账户中当前的相对 DD 或浮动利润(以百分比表示)。 - 内置 PC 和移动警报,触发级别可调。 - 指标还显示账户余额和权益。 - 可以将指标值定位在图表的任何角落: - 还可以设置颜色和字体大小。 - 如果使用相对回撤显示,交易者不再需要任何计算器。 Click here to see high quality Trading Robots and Indicators! 这是仅在 MQL5 网站上提供的原创产品。
Diamond Grail
Dmitriy Kashevich
The universal indicator Diamond Grail which received such a name is not so simple! The indicator has been tested for over a year by our experts! One of the best arrow indicators that is perfect for binary options and forex trading, If you trade on binary options, the best ragtime for it is from 3 minutes to a maximum of 5 minutes An arrow appears on the previous candle. If you trade forex, then the opening time from candle to candle Forex result From 40 To 1324 pips! Profitability of Diam
A Gold Mine
Xiao Peng Tian
AGoldMine是专为黄金XAUUSD优化的MT4(MT5)自动化交易EA,融合网格交易与趋势识别双逻辑,震荡抓波段利润/趋势控单边回撤/内置极端行情风控/全参数可自定义/适配不同风险偏好.适配品种:主力适配黄金XAUUSD,可兼容其他高流动性直盘品种/推荐周期:M1可根据交易风格调整,起步资金建议:以0.01手起始手数为准,轻仓运行建议10000美金(分)起运行环境:兼容所有主流MT4(MT5)经纪商/支持VPS全天候挂机AGoldMine是专为黄金XAUUSD优化的MT4/5自动化交易EA融合网格交易与趋势识别双逻辑,震荡抓波段利润/趋势控单边回撤,内置极端行情风控,全参数可自定义,适配不同风险偏好。
UniversalIndicator
Andrey Spiridonov
UniversalIndicator is a universal indicator. A great helper for beginners and professional traders. The indicator algorithm uses probabilistic and statistical methods for analyzing the price of a trading instrument. The indicator is set in the usual way. Advantages of the indicator works on any time period works with any trading tool has a high probability of a positive forecast does not redraw Indicator Parameters LengthForecast = 30 - the number of predicted bars
Fantastic Price Entry
Muhammed Emin Ugur
The   Fantastic Price Entry   Signal Indicator is a powerful tool designed to assist traders in making informed decisions in the financial markets. This advanced indicator leverages cutting-edge algorithms and technical analysis to identify potential entry points with high accuracy.  Features: 1. Precision Entry Points: The indicator generates precise arrow signals on the chart, highlighting potential entry points for various trading strategies. 2. Trend Identification: By analyzing price mov



Rainbow Price Visualizer
Vincent Jose Proenca
Rainbow Price Visualizer v1.21 See where the market really breathes. Turns your MT4 chart into an ultra-precise heatmap that highlights price zones favored by big players. Why it matters 300 price levels at 0.2‑pip resolution — microscopic detail. 8 visual themes (Rainbow, Fire, Ocean…) for instant readibility. Smart opacity: low noise fades, real zones pop. Lightweight rendering with automatic cleanup. Fully customizable: saturation, opacity, resolution, history depth. Bands project into the f
The Raven Binary Options Indicator
Ellan Dirgantara Tholkhah
1 (1)
UPDATE: Works EXTREMELY well for EURJPY! --> more than 66% win rate monthly Guarantee! I want to introduce you the next-gen unique adaptive Binary options Indicator. This will destroy EURUSD & EURJPY The Raven is so sharp and efficient that it will pick the tops and bottoms of ANY type of market. Can also be used as a Forex Scalper. The Raven signal is based on multiple confirmation analysis. Gets confirmation from the most consistent signals known to man; Ichimoku, SMA, Bollinger Bands; and als
DivirgentMAX
Mikhail Bilan
Indicator without redrawing Divergent MAX The DivirgentMAX indicator is a modification based on the MACD. The tool detects divergence based on OsMA and sends signals to buy or sell (buy|sell), taking into account the type of discrepancies detected. Important!!!! In the DivirgentMAX indicator, the optimal entry points are drawn using arrows in the indicator's basement. Divergence is also displayed graphically. In this modification of the MACD, the lag problem characteristic of its predecessor i
PZ Order Block
PZ TRADING SLU
订单块的个人实现,一种简单而有效的头寸交易策略。如果价格范围没有在与突破相反的方向被突破,则交易者应进入市场或在最后一个订单块的方向上寻找交易。为清楚起见,未绘制开放块。 [ 安装指南 | 更新指南 | 故障排除 | 常见问题 | 所有产品 ] 一个看涨的开盘是在一个新的市场低点之后的第一个看涨柱 看跌的开盘是在新的市场高点之后的第一个看跌柱 当打开的块被破坏时出现信号,成为订单块 当一个订单块被打破到相反的一侧时,它就变成了一个反转块 该指标实施各种警报 它不会重新粉刷或重新粉刷 输入参数 周期:创建新高或新低所需的柱线数量。较小的值会产生更多的信号。 最小 ATR 过滤器:订单块栏的最小主体尺寸,表示为 ATR 的乘数。 Max ATR Filter:订单块的最大主体尺寸,表示为 ATR 的乘数。 颜色:设置线条和箭头的颜色和大小。 警报:启用显示/电子邮件/推送/声音警报。 支持和问题 使用帮助台解决问题或及时获得支持。写一封电子邮件至:help@pointzero-trading.com。 作者 Arturo López Pérez,私人投资者和投机者、软件工程师和 P
PABT Pattern Indicator - it's classical system one of the signal patterns. Indicator logic - the Hi & Lo of the bar is fully within the range of the preceding bar, look to trade them as pullback in trend. In the way if indicator found PABT pattern it's drawing two lines and arrow what showing trend way.  - First line - it's entry point and drawing at: 1. On the high of signal bar or on middle of the signal bar (depending from indicator mode) for buy; 2. On the low of signal bar or on middle of t
Reversion King MT4
Eugen-alexandru Zibileanu
市场新王者登场 —— 指标 + 订单管理系统(TP1 + TP2 + TP3)(完整交易系统) 该指标集成了一套先进的交易策略、可自定义订单管理系统以及均值回归(Mean Reversion)交易体系。系统结合 Envelopes 通道扩展技术,并通过 RSI 等多重智能确认过滤器筛选高概率反转机会,生成清晰的 BUY(买入)和 SELL(卖出)信号。 本指标绝不重绘(No Repaint)。 您不仅能够学习如何寻找优质交易机会,还能掌握如何高效管理多个持仓,并利用已有盈利仓位来覆盖潜在亏损交易,实现更专业的资金管理。 本指标专为 M5 时间周期开发和优化,在几乎所有交易品种和货币对上均具有出色表现。同时支持历史回测,可帮助您评估系统在不同市场环境下的表现与适用性。 指标会自动生成清晰的多头(Long)和空头(Short)信号,并基于 ATR 自动计算入场价、止损位(Stop Loss)和止盈位(Take Profit),让风险管理从交易开始就融入系统之中。 多级止盈系统(Multi-TP)设有三个递进式目标位。您可以在 TP1 部分获利了结,在 TP2 进一步锁定利润,并将剩余仓位持
Forex Gump Trend 是一種通用指標,用於高效確定趨勢方向。如果您正確識別趨勢,這就是 95% 的交易成功,因為您將能夠在價格變動的方向上開倉並從中受益。 Forex Gump Trend 指標幫助交易者以高度的效率確定當前趨勢方向,以及趨勢反轉點。趨勢的方向在圖表上用彩色線表示,趨勢反轉點用箭頭表示。該指標有許多設置,允許您在幾乎所有時間框架和所有貨幣對上使用它。 如何與外匯阿甘趨勢交易? 交易策略取決於交易者的交易風格和他所使用的貨幣對。但在全球範圍內,使用該指標的交易策略始終基於趨勢方向的開單。該指標用彩色線條顯示趨勢。因此,當指標畫出藍線時,我們建立買入交易,當指標畫出紅線時,我們建立賣出交易。考慮到大多數交易者使用剝頭皮策略進行交易的事實,我們建議將 TakeProfit 放置在最小距離。大約15-25分。這是由於剝頭皮。在剝頭皮交易中,我們的目標是在短距離內打開許多訂單。止損設置在指標信號線的上方或下方或趨勢發生變化時。我們總是以小批量交易,這使我們能夠減少交易餘額的負擔。我們嘗試每天進行大量交易以平均結果。因此,如果我們開立大量短距離交易,我們會增加盈
Before
Nadiya Mirosh
The Before indicator predicts the most likely short-term price movement based on complex mathematical calculations. Most of the standard indicators commonly used in trading strategies are based on fairly simple calculations. This does not mean that there were no outstanding mathematicians in the world at the time of their creation. It is just that computers did not yet exist in those days, or their power was not enough for the sequential implementation of complex mathematical operations. Nowad
Reback
Yazhou Liu
本指标可回溯历史交易,可以一目了然的看到交易位置,交易类型及盈亏情况,还有统计信息。 showlabel用于是否显示统计信息,summary_from是订单统计的开始时间,该参数以订单开仓时间为准。 回溯历史可以帮助我们纠正曾经错误的交易习惯,对于学习手动交易的新手极为重要。 本指标适用于各个时间周期,通过交易标识和划线能非常明显地看出各个订单的具体交易情况,可作为信号卖家的辅助工具使用。         即使加载到当前图标中也能实时看到当前订单的下单位置及盈亏情况。        即使加载到当前图标中也能实时看到当前订单的下单位置及盈亏情况。 本指标可回溯历史交易,可以一目了然的看到交易位置,交易类型及盈亏情况,还有统计信息。 showlabel用于是否显示统计信息,summary_from是订单统计的开始时间,该参数以订单开仓时间为准。 回溯历史可以帮助我们纠正曾经错误的交易习惯,对于学习手动交易的新手极为重要。 本指标适用于各个时间周期,通过交易标识和划线能非常明显地看出各个订单的具体交易情况,可作为信号卖家的辅助工具使用。
Alpha Trend sign Alpha Trend sign 是我么长期以来非常受欢迎的交易工具,它可以验证我们的交易系统,并且明确的提示交易信号,并且信号不会漂移。 主要功能: •  根据市场显示活跃区域,根据指标可以很直观的判断当前行情是属于趋势行情,还是震荡行情。    并根据指标的指示箭头切入市场,绿色箭头提示买入,红色箭头提示卖出。 •  建议使用5分钟以上的时间周期进行交易,避免因为小周期波动出现频繁的交易信号。 •  您也可以开启信号提示,以免错过最佳的交易时机。 •  本指标不但可以很好的预测趋势行情,也可以在宽幅震荡行情中获利。 •  本指标本着大道至简的原则,适合不同阶段的交易者使用。 注意事项: •  Alpha Trend sign 有明确的进出场信号,不建议逆势操作,以免造成损失。 •  Alpha Trend sign 是特别成熟的指标,我们团队人手一个,使用它可以实现稳定盈利。     
Nomen Magic Candle
Noomen Ben Khadimallah Khadimallah
Nomen Magic Candle – Put an End to Chart Chaos! No Repaint MT4 Indicator The wait is finally over. It is time for a revolution on your screen. Welcome to the "Magic Chart." Use the cleanly plotted lines as a high-precision trading strategy, backed by advanced, algorithmic market analysis that precisely decodes hidden liquidity zones—giving you the decisive, invisible edge over the crowd. Do you also feel overwhelmed? By endless analysis, overloaded charts, and indicators that constantly contr
Forex Relative Performance indicator This indicator calculates the relative strength of major currencies against the US dollar. The basic idea behind this indicator is "to buy strong currency and to sell weak currency". This indicator allows you to quickly identify the best forex pair to trade according to your trading style (Intraday, Scalping, Swing, or Long Term) For demo testing please use MT5 version, because MT4 does not support Multicurrency Testing https://www.mql5.com/en/market/product/
Divergence Matrix Pro for MetaTrader 4 Divergence Matrix Pro is a confirmed multi-oscillator divergence indicator for MetaTrader 4. It detects regular and hidden divergence between price and selected oscillators, then presents the confirmed structure through divergence lines, pivot labels, action markers, an optional current-timeframe Matrix Panel and optional alerts. The indicator is an analysis and confirmation tool. It does not open or close trades, and the signal score is not a win rate or a
ShinZuka
Muhammad Asyraf Bin Mohamad
Using MACD value for direction. Using RSI as reversal indicator. Using open trading hour. (Recommend Hour 10,11,15 & 19 : MT4-Time) Counter trade if signal failed. Cutloss trade if signal failed. Auto lot calculate based on target profit & takeprofit. Able to set counter trade value. Suitable for commodities & currency.  Timeframe H1. Able to set limit lot open. Able to select day to trade.
DMAX pro
Danny Teoh Kok Keong
DMAX SIGNAL IS VERY POWERFUL TOOL TO HELP YOU ENTRY,ITS CAN DETECT OVERSOLD AND OVERBOUGHT IN FOREX MARKET. ITS CAN TRADE 24 FOREX PAIR IN MARKET, 80% ACCURATE RESULT. MANY TRADER FAIL BECAUSE OF ENTRY POINT AND EXIT POINT , SIGNAL OF DMAX WILL GIVE VERY GOOD SIGNAL TO LET YOU KNOW WHERE TO ENTRY AND EXIT.  RISK MANAGEMENT IS VERY IMPORTANT IN TRADING FOREX, PLEASE DONT RISK OVER 5% PER TRADE IS FORE MARKET
MACD Divergence
Sergey Deev
2.5 (2)
The indicator detects divergence signals - the divergences between the price peaks and the MACD oscillator values. The signals are displayed as arrows in the additional window and are maintained by the messages in a pop-up window, e-mails and push-notifications. The conditions which formed the signal are displayed by lines on the chart and in the indicator window. Indicator Parameters MacdFast - fast MACD line period MacdSlow - slow MACD line period MacdSignal - MACD signal line period MacdPric
AI TRADING SYSTEM for MT4 - 您的终极AI驱动利润机器! 通过 AI TRADING SYSTEM 解锁交易的未来,这是一款尖端的专家顾问(EA),使用强大的AI驱动策略来最大化所有货币对的利润。虽然它是为通用性而设计的,但它在 主要货币对 如EUR/USD、GBP/USD和USD/JPY上表现 出色 ,帮助您领先市场。 AI TRADING SYSTEM 具有 两种不同的交易模式 ,可适应您的交易风格和利润目标: BACIS模式 - 对于稳健、可靠的收益和最低风险,非常适合寻求平衡方法的交易者。 TURBO模式 - 对于那些希望通过积极的高回报策略来提高利润的人来说,非常适合捕捉市场动量。 主要特点: 可定制设置 : 调整止盈(TP)、止损(SL)、手数和马丁格尔选项,以根据您的风险承受能力和交易偏好定制系统。 所有时间框架兼容 : EA可在所有时间框架上无缝运行,**H1(1小时)**提供最佳结果,以最大化回报。 所有货币对 : 无论您是交易奇异货币对还是主要货币对,AI系统都能适应并蓬勃发展, 主要货币对 产生最高的利润潜力。 通过 AI TRADING
Trading System Double Trend - 个由多个指标组成的独立交易系统。它能够判断总体趋势,并发出价格变动方向的信号。 可用于剥头皮交易、日内交易或周内交易。 功能 适用于任何时间框架和交易工具(外汇、加密货币、贵金属、股票、指数)。 信息直观易读,无需加载图表 指标不会重绘,也不会完成信号 仅在 K 线收盘时生效 提供多种信号提醒类型 直观易懂,只需将其附加到图表上并遵循信号的简单建议即可。 系统中每个趋势的输入参数均可配置。 General trend - 判断总体趋势 Signal trend - 发出入场和出场信号。 Play sound / Display pop-up message / Send push notification / Send email - 出现信号箭头和止损时使用提醒。 Sound for signals - 信号声音文件。 使用方法 General trend - 浅绿色线,如果高于价格 - 趋势为下行;如果低于价格 - 趋势为上行。当趋势发生变化时,会出现信号箭头。 Signal trend - 跟随价格走势的
Copyright(c) 2019 Superfarabi EA Is the Scalping Forex Expert Advisor for MT4 Working on Timeframes (M5) Best Pair Recomended is EU/UChf=0.4 Calculation is based of Envelopes indicator ===========Rakyat +62 =========== Hak Cipta (c) 2019 Superfarabi EA Merupakan Scalping Forex Expert Advisor untuk MT4 Berjalan pada Time Frame Kecil (M5) Pair Rekomendasi adalah EU / UChf = 0,4 Perhitungan didasarkan pada indikator Envelopes
供求区关键价指标 背景 系统自动搜索 K 线中的供求区域,并画出实时的关键价格线,交易者可以根据价格交易线进行交易。 主要特点 系统是自动搜索 K 线中的供求区域的,系统同时会画出实时的关键价格线,交易者可以根据价格交易线进行交易。所以使用供求区策略的交易员无需再耗费时间去寻找标识供求区域,而可以关注在价格对供求区域以及关键价格的反应,制定适合自己的交易策略。 然而供求区策略本身就是一个在震荡时期更加有效的策略,所以当市场呈现强大趋势的时候,应当小心使用,或者按顺应趋势的方向使用指标提供的建议。   范围 ShowZones :是否显示供求区域 DrawLines: 是否显示关键价格 SupplyZoneLineColor: 供给区价格线颜色 DemandZoneLineColor: 需求区价格线颜色 PenatratedLineColor: 被击穿价格线颜色   执行 只需将指标附加到图表上即可。 请给我您宝贵的意见,让我改进指标。 如有问题,联系微信 imlizard
Chart Patterns Detect 15 patterns (Ascending Triangle, Descending Triangle, Rising Wedge, Falling Wedge, Bullish Flag, Bearish Flag, Bullish Rectangle, Bearish Rectangle Symmetrical triangle, Head and Shoulders, Inverted Head and Shoulders, Triple top, Triple Bottom, Double Top, Double Bottom) Use historical data to calculate the probability of each pattern to succeed (possibility to filter notification according to the chance of success) gives graphic indication about the invalidation level and
Desbot
Luke Joel Desmaris
Join our Newsletter to also get a copy of our Optimization Settings: https://desbot.ai/#Newsletter  Input Parameters Below are all the input options (aka: Parameters) for Desbot and how to use them. You can find the best Parameters through optimization. RiskPercentage: Enter the number that represents the percent of your account balance you want Desbot to risk per trade. For example, entering 1.5 would risk 1.5% of your Account Balance. SLTicks: Enter the number of ticks you want for your stop
The trader’s task is to find a pattern and make money on it. Classic trading uses patterns in the form of graphical analysis - candlestick patterns, levels, trend lines, graphic figures, etc. Their main difficulty is that they are not unambiguous. Each trader sees everything differently. Against the backdrop of this ambiguity, a bunch of other problems arise: psychology is the most common reason for losing a deposit, attracting transactions “by the ears” in places where there is none, the time
该产品的买家也购买
Miraculous 指标 – 100% 不重绘的外汇和二元期权工具,基于江恩九方图 这个视频介绍的 Miraculous 指标 是一款专为外汇和二元期权交易者开发的高精度、强大交易工具。该指标的独特之处在于它建立在传奇的 江恩九方图 和 江恩振动法则 之上,使其成为现代交易中可用的最精确预测工具之一。 Miraculous 指标 完全不重绘 ,这意味着它的信号在 K 线收盘后不会改变或消失——你看到的就是你得到的。这为交易者提供了可靠且一致的基础,让他们能够自信地进出场交易。 主要特点: 基于江恩九方图和江恩理论构建 100% 不重绘的信号系统 适用于所有时间周期(M1、M5、H1、H4、日线、周线) 适用于外汇和二元期权交易 清晰的买卖信号,准确率高 可用于剥头皮、日内交易或波段交易 兼容大多数 MT4 平台 这款工具旨在帮助初学者和专业交易者做出更好、更明智的决策。无论您是交易货币、指数还是二元期权,Miraculous 指标都将为您在市场中提供所需的优势。
TrendMaestro
Stefano Frisetti
4 (4)
Attention: beware of SCAMS, TRENDMAESTRO is only ditributed throught MQL5.com market place. note: this indicator is for METATRADER4, if you want the version for METATRADER5 this is the link:  https://www.mql5.com/it/market/product/108106 TRENDMAESTRO ver 2.5 TRENDMAESTRO recognizes a new TREND from the start, he never makes mistakes. The certainty of identifying a new TREND is priceless. DESCRIPTION TRENDMAESTRO identifies a new TREND in the bud, this indicator examines the volatility, volumes a
Breakout Arrows Mt4
Michael Oko Oboh
5 (1)
Trend Breakout Arrows Indicator The Trend Breakout Arrows Indicator is a momentum-based signal tool designed to identify potential bullish and bearish breakout opportunities. It displays clear arrow signals directly on the price chart, helping traders quickly recognize possible trend changes and continuation setups. Up Arrow (Buy Signal) A magenta up arrow appears below a candle when bullish momentum begins to strengthen. This signal indicates that buying pressure may be overtaking selling press
TRADING STRATEGY GUIDE DELIVERY The full Trading Strategy Guide will be sent directly to you after purchase. Just message me on MQL5 and ask for it — you'll receive it instantly, along with priority support and setup help. Powered Market Scanner for Smart Trading Decisions keypad support resistance logic 1  is a next-generation MT4 trading system built for serious traders who demand precision, reliability, and clarity. It combines advanced smart filters with real-time price structure logic to
CountSig
Yin Zhou Luo
一款信号统计指标(MT4)——实现基于当前图表周期下的单线MA转向和双线MA金叉/死叉统计 . 转向定义:前一K向下或走平,当前K向上,视为转向向上;反之,转向向下。 金死叉定义:前一K快线在慢线下方,当前K快线在慢线上方,为金叉;反之,死叉。 参数及使用说明: 1、可指定统计K线数。 2、可指定4个不同的日内时间段,格式如"03:00-07:59",4个时间段可交叉任意输入。 3、可配置ABC三个浮盈区间段点值。如:分界区间统计小点值设为500,即当某转向信 号出现后到下一反向信号止浮盈<=此点值,计入A区间; 若大于此点值<大分界点值时,计入B区间;若大于“大分界点值”计入C区间。 4、最大/最小浮盈统计。显示所有统计区间内的最大浮盈点值和最小浮盈点值(亏损点值)。 5、输出完整信号,按信号出现顺序排列,如“ACCBCA”之类。 6、综合预测。使用概率、周期、趋势、马尔可夫链等综合概算输出预测该信号出现的归类概率值。 7、加载指定MA线。在当前图表自动载入相应设置的MA线。 8、自适应列宽。以完整显示统计信号数。 9、用法:点击相应统计按钮即输出相应的统计表格.
WanaScalper MT4
Isaac Wanasolo
1 (1)
A scalping indicator based on mathematical patterns, which on average gives signals with relatively small SL, and also occasionally helps to catch big moves in the markets (more information in the video) This indicator has three main types of notifications: The first type warns of a possible/upcoming signal on the next bar The second type indicates the presence of a ready signal to enter the market/open a position The third type is for SL and TP levels - you will be notified every time price re
FFx Engulfing Setup Alerter gives trade suggestions with Entry, Target 1, Target 2 and StopLoss. Below are the different options available: Entry suggestion - pips to be added over the break for the entry 3 different options to calculate the SL - by pips, by ATR multiplier or at the pattern High/Low 3 different options to calculate the 2 TPs - by pips, by ATR multiplier or at Risk/Reward Offset the dashboard - any place on the chart Remove the suggestion once the price reached the SL line Lines
FFx InsideBar Setup Alerter gives trade suggestions with Entry, Target 1, Target 2 and StopLoss. Below are the different options available: Entry suggestion - pips to be added over the break for the entry Minimum candle size - to avoid too close buy/sell entry suggestions 3 different options to calculate the SL - by pips, by ATR multiplier or at the pattern High/Low 3 different options to calculate the 2 TPs - by pips, by ATR multiplier or at Risk/Reward Offset the dashboard - any place on the c
FFx OutsideBar Setup Alerter gives trade suggestions with Entry, Target 1, Target 2 and StopLoss. Below are the different options available: Entry suggestion - pips to be added over the break for the entry. 3 different options to calculate the SL - by pips, by ATR multiplier or at the pattern High/Low. 3 different options to calculate the 2 TPs - by pips, by ATR multiplier or at Risk/Reward. Offset the dashboard - any place on the chart. Remove the suggestion once the price reached the SL line.
FFx PinBar Setup Alerter gives trade suggestions with Entry, Target 1, Target 2 and StopLoss. Below are the different options available: Entry suggestion - pips to be added over the break for the entry Minimum candle size - to avoid too small candles 3 different options to calculate the SL - by pips, by ATR multiplier or at the pattern High/Low 3 different options to calculate the 2 TPs - by pips, by ATR multiplier or at Risk/Reward Offset the dashboard - any place on the chart Remove the sugges
FFx MACD Divergences
Eric Venturi-Bloxs
The purpose of this new version of the MT4 standard indicator provided in your platform is to display in a sub-window multiple timeframes of the same indicator with its divergences. See the example shown in the picture below. But the display isn't like a simple MTF indicator. This is the real display of the indicator on its timeframe. Here's the options available in the FFx divergences indicator: Select the timeframes to be displayed (M1 to Monthly) Define the width (number of bars) for each tim
FFx RSI Divergences
Eric Venturi-Bloxs
The purpose of this new version of the MT4 standard indicator provided in your platform is to display in a sub-window multiple timeframes of the same indicator with its divergences. See the example shown in the picture below. But the display isn't like a simple MTF indicator. This is the real display of the indicator on its timeframe. Here's the options available in the FFx divergences indicator: Select the timeframes to be displayed (M1 to Monthly) Define the width (number of bars) for each tim
FFx CCI Divergences
Eric Venturi-Bloxs
The purpose of this new version of the MT4 standard indicator provided in your platform is to display in a sub-window multiple timeframes of the same indicator with its divergences. See the example shown in the picture below. But the display isn't like a simple MTF indicator. This is the real display of the indicator on its timeframe. Here's the options available in the FFx divergences indicator: Select the timeframes to be displayed (M1 to Monthly). Define the width (number of bars) for each ti
The FFx Dashboard MTF alerter will show you on a single chart all the timeframes (M1 to Monthly) with their own status for the indicator. 2 Alert Options: Single timeframe: each selected timeframe alert separately when a signal occurs Multi timeframes: all selected timeframes must agree for an alert to be triggered Both options have an input to select the timeframes to be used for the alert(s). How to Understand the Status: Green/Red square: histogram above/below 0 line Green square + Red bord
The FFx Dashboard MTF alerter will show you on a single chart all the timeframes (M1 to Monthly) with their own status for the indicator. 2 Alert Options: Single timeframe: each selected timeframe alert separately when a signal occurs Multi timeframes: all selected timeframes must agree for an alert to be triggered Both options have an input to select the timeframes to be used for the alert(s). How to understand the status: Green/Red square: RSI above/below 50 line Green square + Red border: R
The FFx Dashboard MTF alerter will show you on a single chart all the timeframes (M1 to Monthly) with their own status for the indicator. 2 Alert Options: Single timeframe: each selected timeframe alert separately when a signal occurs Multi timeframes: all selected timeframes must agree for an alert to be triggered Both options have an input to select the timeframes to be used for the alert(s). How to understand the status: Green/Red square: Stoch above/below 50 line Green square + Red border:
The FFx Dashboard MTF alerter will show you on a single chart all the timeframes (M1 to Monthly) with their own status for the indicator. 2 Alert Options: Single timeframe: each selected timeframe alert separately when a signal occurs Multi timeframes: all selected timeframes must agree for an alert to be triggered Both options have an input to select the timeframes to be used for the alert(s). How to understand the status: Green/Red square: Price above/below Cloud (Kumo) Green square + Red bo
The FFx Dashboard MTF alerter will show you on a single chart all the timeframes (M1 to Monthly) with their own status for the indicator. 2 Alert Options: Single timeframe: each selected timeframe alert separately when a signal occurs Multi timeframes: all selected timeframes must agree for an alert to be triggered Both options have an input to select the timeframes to be used for the alert(s). How to understand the status: Green/Red square: MA pointing Up/Down Green square + Red border: MA po
The FFx Dashboard MTF alerter will show you on a single chart all the timeframes (M1 to Monthly) with their own status for the indicator. 2 Alert Options: Single timeframe: each selected timeframe alert separately when a signal occurs. Multi timeframes: all selected timeframes must agree for an alert to be triggered. Both options have an input to select the timeframes to be used for the alert(s). How to understand the status: Green square: Price above PSAR Red square: Price below PSAR Options
The FFx Dashboard MTF alerter will show you on a single chart all the timeframes (M1 to Monthly) with their own status for the indicator. 2 Alert Options: Single timeframe: each selected timeframe alert separately when a signal occurs Multi timeframes: all selected timeframes must agree for an alert to be triggered Both options have an input to select the timeframes to be used for the alert(s). How to understand the status: Green/Red square: CCI above/below levels (ie. 100/-100) Grey square: C
The FFx Dashboard MTF alerter will show you on a single chart all the timeframes (M1 to Monthly) with their own status for the indicator. 2 Alert Options: Single timeframe: each selected timeframe alert separately when a signal occurs Multi timeframes: all selected timeframes must agree for an alert to be triggered Both options have an input to select the timeframes to be used for the alert(s). How to understand the status: Green/Red square: ADX above level Grey square: ADX below level Red bor
The FFx Dashboard MTF alerter will show you on a single chart all the timeframes (M1 to Monthly) with their own status. 2 Alert Options: Single timeframe: each selected timeframe alert separately when a signal occurs Multi timeframes: all selected timeframes must agree for an alert to be triggered Both options have an input to select the timeframes to be used for the alert(s). How to understand the status: Green/Red square: bullish/bearish candle Options available in the FFx Dashboard Alerter
The indicator of a Professional Trader is an arrow indicator for predicting the direction of price movement. I have been working on this indicator since 2014. You can use this indicator as your main indicator, use its entry signals, and use it as your only indicator to find entry points. About the product: Recommended TF [H4-D1-W1]   . The indicator predicts the direction of the next candle. Fits a variety of tools; Flexibility in settings for different instruments and intervals through the MO
THE GRAFF III
Charles Harper
The [GRAFF] III manual trading system is based on multiple MetaTrader (MT4) indicators. Together, the entire PACK of GRAFF III indicators makes an advanced trading tool. The system consists of over 20 different custom-built indicators which have been carefully selected and tested in the long term to produce strong and efficient trading signals. The particular indicators are based on different mathematical formulas, so the entire system is calibrated to remove false signals from its own indicator
FFx Universal Strength Meter PRO is more than a basic strength meter. Instead of limiting the calculation to price, it can be based on any of the 19 integrated strength modes + 9 timeframes. With the FFx USM, you are able to define any period for any combination of timeframes. For example, you can set the dashboard for the last 10 candles for M15-H1-H4… Full flexibility! Very easy to interpret... It gives a great idea about which currency is weak and which is strong, so you can find the best pai
Pan PrizMA CD Phase is an analogue of the МetaТrader 5 indicator , and is an option based on the Pan PrizMA indicator. Details . Averaging by a quadric-quartic polynomial increases the smoothness of lines, adds momentum and rhythm. Extrapolation by the sinusoid function near a constant allows adjusting the delay or lead of signals. The value of the phase - wave status parameter (which is close in meaning to the trigonometric phase or the angle of the radius-vector rotation in the trigonometric p
Green Wall Arrows
Daniel Luchinger
1 (1)
The Name Green Wall : Arrows hits a lot of TP, by changing the idea of non using SL as something bad, but instead use Small TP and a lot of free Margin and Patience. Use micro TP and a lot of Free Margin with this indicator on Forex. It also can be used with Binary Options. This strategy is intended to be traded Manually. This Indicator runs on Open Bar, arrows will delete when price are against it. The only Indicator Parameter is Alerts true/false, all the rest is included inside the code. Arro
Golden Monowave
Ahmed Mohamed Ali
Golden Monowave is monowave indicator, the monowave theory is one of Elliott wave approach and one of most complicate and accurate method. Golden Monowave can shortcut many major steps to identify and describe the monowave. It works on any timeframe and with any trading instrument, including currencies, indices, futures, etc. Input Parameters initial_Bars - set the initial number of bars to calculate. wave_color - select the color of the wave. label_color - select the color of labels. temp_labe
作者的更多信息
BollMTFzzz
Guo Sheng Zhao
Bollinger Bands MTF projects Bollinger Bands from multiple timeframes onto the current MT4 chart. It helps traders review volatility boundaries, trend direction, and nearby price confluence across several timeframes from a single workspace. Key features: - Supports M1, M5, M15, M30, H1, and D1 Bollinger Bands. - Independently displays middle, upper, and lower bands, with an option to show only timeframes above the current chart period. - Evaluates middle-band slope and highlights the active t
FREE
左右交易的其实都是情绪,把握情绪才是交易最终能够获得盈利的关键。 所以我这是一个「趋势氛围灯」指标,它能为您的交易图表做三件事: 1. 一眼识别市场状态 深蓝色背景   → 市场处于 强劲多头氛围 深红色背景   → 市场处于 强劲空头氛围 深灰色背景   → 市场处于 震荡平衡状态 2. 提供直观的视觉辅助 将复杂的多空力量对比 转化为最直观的背景色 让您 无需分析数据 就能感受市场情绪 在多个图表间切换时能 瞬间把握每个品种的当前强弱 3. 辅助交易决策 避免在强势多头时逆势做空 避免在强势空头时逆势做多 在震荡行情中提醒您保持观望或采用区间策略 本质上,它就像为您的交易图表安装了一个「情绪指示灯」,用颜色告诉您市场此刻的“性格”是强势上涨、强势下跌还是犹豫不决.
SAMBAisgood
Guo Sheng Zhao
本指标是一款仅保留大周期趋势信号的精简版分析工具,专为识别市场核心趋势顶底而设计,剔除了中小周期的干扰信号,适用于外汇、贵金属等品种的中长线交易分析。 指标加载后,图表会以黄色箭头标注大周期的顶底拐点,同步绘制趋势线、回撤线与目标线,清晰界定趋势方向、关键支撑阻力位及潜在目标区间。用户可通过参数设置调整大周期跨期、止损止赢幅度、箭头样式等,适配不同交易品种与周期的特性。 此外,指标内置报警功能,当价格触碰趋势线或出现顶底信号时,可触发声音提醒;注释显示功能则能回溯历史信号记录,辅助交易者复盘分析。整体而言,该指标以简洁直观的呈现方式,帮助使用者聚焦大周期趋势,过滤短期波动噪音,提升中长线交易决策效率。 适用于贵金属,加密货币等波动比较大的品种。
ADX Dashboard V11.03 是一款专业的 MT4 指标,旨在为交易者提供多周期趋势强度与市场情绪的直观可视化概览。该指标整合了平均趋向指数(ADX)与相对强弱指数(RSI),将关键数据呈现在简洁的面板中,帮助交易者无需复杂分析单个指标图表,即可快速做出明智的交易决策。 首先,安装流程简单便捷。将编译后的 .ex4 文件复制到 MT4 安装目录下的 “Indicators” 文件夹中,重启 MT4 软件后,通过顶部菜单栏的 “插入”→“指标”→“自定义”,找到 “ADX_Dashboard_Final_V11.03” 并添加至当前图表。添加完成后,图表上会出现一个可配置的面板,默认显示在左上角位置。 其次,参数配置可根据个人交易风格灵活调整。“位置参数”(X_Axis 与 Y_Axis)用于调节面板在图表上的摆放位置,避免遮挡关键价格走势。“周期设置” 支持通过下拉菜单选择三个不同的时间周期(从 1 分钟到月线),这一功能至关重要,能让你同时监控短期、中期和长期市场趋势。“指标参数”(ADX_Period 与 RSI_Period)可根据交易策略修改,默认的 14 周期设
Fibopro
Guo Sheng Zhao
FiboPro 2.11 指标使用说明 一、指标概述 FiboPro 2.11 是一款适配 MT4 平台的动态斐波那契支撑阻力指标,通过动态中枢线结合波动率计算多档斐波那契档位线,可直观展示市场趋势(多头 / 空头 / 震荡)、识别价格超涨超跌信号,适用于外汇、期货、股票等各类 K 线交易品种,时间周期建议选择 M15 及以上,避免短周期噪音干扰。 二、安装方法 将指标文件(fiboz.mq4)复制到 MT4 安装目录下的 “MQL4/Indicators” 文件夹; 重启 MT4 客户端,在 “导航栏 - 技术指标” 中找到 “FiboPro 2.11 Final Version”; 将指标拖拽至目标交易品种图表,自动加载并显示 13 条斐波那契档位线及动态背景色。 三、参数设置说明 Central Line Period(中枢周期) :默认 100,调整中枢线计算的 K 线数量,数值越大中枢线越平滑,适合趋势行情;数值越小对价格变化越敏感,适合震荡行情。 Central Line Method(均线类型) :0=SMA(简单均线)、1=EMA(指数均线)、2=SMMA(平滑均线)、
This MT4 Expert Advisor (EA) is a   multi - timeframe trend - based trading assistant   with visualized UI and automated trading logic. Its core functions are as follows: Trend Analysis & Visualization Analyzes market trends by integrating multiple technical indicators including EMA (21/55), ADX (14), MACD (12/26/9), RSI (14) and volume data across different timeframes. Generates Chinese - language trend comments (e.g., "Bullish momentum surges" or "Bearish dominance prevails") and displays the
UltimateSystem
Guo Sheng Zhao
Ultimate_Combined_System_V16.3(简称UCS V16.3)是一款专为MetaTrader 4(MT4)平台设计的专业综合趋势跟踪指标。它融合了MACD、ADX、EMA、动量(Momentum)和唐奇安通道(Donchian Channel)五大核心技术分析因子,能够精准识别趋势方向、判断市场状态,是趋势交易者的核心辅助工具。 该指标的核心是一套 四重因子投票计分体系 ,通过多维度标准评估市场的多头、空头或中性状态:ADX+DI/-DI对比(趋势方向)、ADX强度阈值(趋势有效性)、收盘价与EMA对比(中期价格重心)以及动量指标(价格波动动能)。仅当多空双方得分差超过1时,才会确认明确趋势,可有效过滤震荡行情中的无效信号。 核心功能包括:1)可视化趋势展示(青色线代表多头趋势、红色线代表空头趋势、灰色线代表中性/震荡市场);2)实时20期唐奇安通道,界定价格区间(上轨:20期最高价,下轨:20期最低价,中轨:高低价均值);3)右侧现价标记线(MACD大于0时为绿色,小于0时为品红色),直观反映短期多空强弱。 指标经优化修复(含数组越界、周期校验错误等问题),
GoldAuctionPA
Guo Sheng Zhao
黄金拍卖价格行为交易指标,专为UTC+0服务器时间平台设计,并采用纽约收盘制对日线进行校正,夏令时与冬令时会自动切换重置时间点。指标核心融合了拍卖理论中的成交量分布分析(POC成交密集区、VAH价值区上沿、VAL价值区下沿),用于判断价格当前处于价值区内部、上方还是下方,进而反映买卖双方主动性。同时内置扫损流动性识别逻辑,能够捕捉价格刺破关键高低点后又快速收回的"扫损做多/做空"信号,并结合裸K价格行为形态(针形线、吞没形态)进行确认,避免单纯依赖形态或单纯依赖位置产生虚假信号。指标还提供突破接受判断机制,要求价格在关键位外连续收盘若干根K线才认定为有效突破,减少假突破干扰。关键位来源覆盖前日/前周/前月高低点、当日高低点、亚洲盘区间、H1与H4摆动结构点,以及可选的整数关口。为进一步筛选信号质量,指标内置认知模型过滤器,综合拍卖位置、交易时段活跃度(伦敦盘、纽约盘、重叠时段)以及高周期趋势方向进行评分,仅让分数达标的信号显示或触发提醒。图表上会绘制关键位线条、价值区矩形框、四类信号箭头,并配有一个信息面板,实时展示点差、拍卖状态、当前时段、多空结构、上下方最近流动性位置,以及基于当前
QuietConfluence
Guo Sheng Zhao
Quiet Confluence 是一款用于 MT4 图表的多因素技术分析指标,将布林带趋势、突破评分、MACD 背离、波动状态以及支撑阻力信息整合在同一界面中。它适合希望减少图表切换并从多个角度观察市场环境的交易者。 主要功能: - 显示布林带上轨、下轨及随趋势方向变化的中轨。 - 结合价格穿越、成交量和 MACD 条件计算突破评分。 - 标记看涨与看跌 MACD 背离,可选择传统增强模式或枢轴确认模式。 - 使用布林带宽度识别收缩、扩张及常规波动状态。 - 显示近期支撑阻力及价格标签。 - 支持收盘 K 线信号、弹窗、声音和推送通知等可选设置。 指标参数可用于调整周期、阈值、历史计算范围、颜色和显示组件。Quiet Confluence 是分析辅助工具,不执行交易,也不构成投资建议。历史信号不代表未来结果,使用者应结合自身交易计划和风险管理进行判断。
Bollinger Insight 是一款基于 Tick Volume 的价格分布分析工具,用于在 MT4 主图中显示成交量轮廓、控制点、价值区域和低成交量区域。它可帮助观察指定区间内市场活动在不同价格层级的分布情况。 主要功能: - 按价格区间绘制 Tick Volume Profile。 - 显示控制点 POC,并支持发展中控制点模式。 - 计算并显示 VAH 与 VAL,价值区域比例可调。 - 识别低成交量节点,并将其转换为可视化供需区域。 - 支持固定回看区间、轮廓行数、宽度和水平偏移设置。 - 可优先采用 M1 数据构建轮廓,并在数据不足时回退到当前周期。 - 支持当前 K 线更新、未完成 K 线包含方式及多实例标识。 Tick Volume 表示报价变动次数,并不等同于交易所真实成交量。不同经纪商的数据源可能产生不同结果。本指标仅用于分析,不执行交易,也不构成投资建议。
Market Structure Toolkit 用于在 MT4 图表上识别和标注价格结构、结构突破、市场特征变化、摆动点以及供需区域。它将常用的市场结构观察工具集中在一个可配置指标中。 主要功能: - 支持外部结构和内部结构分析模式。 - 标记 BoS、CHoCH,并可选择显示 CHoT 与流动性扫盘线。 - 识别看涨和看跌订单块、供应区及需求区。 - 可删除已失效区域,或保留、弱化已经缓解的区域。 - 可选 ZigZag、HH、HL、LH、LL 摆动标签及内部变化箭头。 - 支持当前周期或指定信号周期。 - 提供供需、摆动高低点、结构突破和市场变化提醒。 - 可限制历史计算 K 线和图表对象数量,以控制图表负载。 市场结构会随着新价格数据和摆动确认而发展,尚未确认的结构可能发生变化。本工具用于辅助图表分析,不提供自动交易或结果保证。 ---
Squeeze Momentum 将布林带与 Keltner Channel 的相对位置用于识别波动收缩和释放,并通过彩色动量柱显示方向与强弱变化。它适合观察低波动阶段以及随后可能出现的波动扩张。 主要功能: - 识别无挤压、挤压进行中和挤压释放状态。 - 使用四色柱体区分看涨动量增强、看涨动量减弱、看跌动量增强和看跌动量减弱。 - 布林带周期、倍数、Keltner Channel 周期和倍数均可调整。 - Keltner Channel 可选择使用 True Range。 - 支持挤压释放、动量零轴穿越、挤压开始和动量颜色变化提醒。 - 提供弹窗、声音、推送及邮件通知选项。 - 可限制最大计算 K 线数量以减少终端负载。 挤压状态表示波动条件,并不直接代表价格方向或入场信号。动量和波动均可能迅速变化。本指标仅用于技术分析,使用者应独立评估市场风险。
C6MRApro
Guo Sheng Zhao
这个指标通过沉稳、清晰、专业的视野,为复杂多变的以太市场带来更多秩序的观察体验。 无论面对快速波动、方向反复还是节奏模糊的市场环境,该指标均会引发一个紧张、关注、易观察的决策波动。 视觉反馈有助于降低情绪干扰,避免因画面混杂而产生干扰,让用户更耐心等待值得关注的时刻。它既适合盘中快速浏览,也适合复盘时梳理市场状态,使每一次观察市场更有层次,每一次判断更容易,每一次等待更有目的。  在使用贸易中可以进一步发挥交易的机会以及潜在的食品风险。 指标只是交易的一部分,但是我希望你能借助它更好的解读市场,适应市场,紧随市场的趋势;让你在面对行情的时候可以更稳定,更从容,更自信。 z整个指标不追求夸张的颜色对比,也不做过度的解读,只是安静的解释市场发生的事情,提及市场可能存在的风险,让你感受到市场的节奏,从而理性的做出相应的判断。
TradeQA
Guo Sheng Zhao
这款量价结构指标适用于   MetaTrader 4 和 MetaTrader 5   的图表分析指标,集合量价结构、成交量分布、市场情绪、波动提示和关键价格区域表现于一体。指标运行直接于主图窗口,可帮助交易者快速观察市场的重要价格位置与活跃程度。 它采用了动态的POC,可以让你看到市场中价值的迁移过程。同时还有四种成交量K线涂色使你不会在不合适的位置入场。 ni你在图表上可以看到VAH,POC,VAH,以及分布图和右侧的情绪值,这样你能轻松的看到市场的交易情绪从而不陷入狂热中去,冷静的看待交易,看待盈亏。 希望你能通过这个指标清晰的看清市场,明白价格所在,位置所处,找到自己的交易节奏。 z指标只是交易的一部分,只是辅助,所以,你要专注而不执拗,冷静的看待每次交易。加油吧,孤独的交易者。
TradeAQ
Guo Sheng Zhao
这个量价结构指标是一款适用于   MetaTrader 4 和 MetaTrader 5   的图表分析指标,集量价结构、成交量分布、市场情绪、波动提示和关键价格区域展示于一体。指标直接运行在主图窗口,可帮助交易者快速观察市场的重要价格位置与活跃程度。 主要功能 1. 量价结构支撑与阻力 自动标记连续量价结构形成的潜在支撑位和阻力位,辅助识别价格可能出现停顿、反应或突破的位置。 支持两种分析模式: 成交量结构 价格结构 线条颜色、宽度和样式均可自定义。 2. 成交量尖峰提示 当市场成交量显著放大时,在图表中显示醒目标记,帮助发现异常活跃、加速、衰竭或可能发生方向变化的行情。 可选功能包括: 尖峰图标提示 尖峰价格水平线 高点、低点、收盘价或组合价位显示 自定义成交量阈值 3. 高波动行情提示 自动标记波动明显扩张的 K 线,方便交易者及时发现突破、加速和快速行情。 支持: 高波动图标 关键价格水平线 自定义检测周期与敏感度 自定义线条颜色、宽度和样式 4. 成交量分布 在图表右侧显示指定范围内的成交量分布,直观呈现不同价格区域的交易活跃程度。 主要显示内容包括: 高成交量节点 低成交量
筛选:
无评论
回复评论