EMA Designer TSD47

TSD-47 Tactical EMA Designer

Next-Level EMA Structure Engineering for MetaTrader 5

TSD-47 Tactical EMA Designer is not just another moving average indicator.

It is a complete tactical EMA engineering workstation designed for traders who want to visually build, monitor, tune, and export professional EMA/SMA structures directly from the chart.

Built inside the TSD-47 Tactical Systems ecosystem, this indicator combines premium futuristic visuals with real trading functionality — transforming traditional moving averages into an interactive market structure design environment.

WHAT MAKES THIS DIFFERENT?

Most moving average indicators only show:

  • crosses,
  • arrows,
  • alerts.

TSD-47 Tactical EMA Designer goes much further.

This system allows you to:

✔ Design full EMA/SMA stack structures
✔ Tune moving averages live on the chart
✔ Select your own cross-object display system
✔ Monitor stack alignment instantly
✔ Export full strategy configurations
✔ View tactical symbol information instantly
✔ Create repeatable EMA-based trading systems

This is not simply a crossover indicator.

This is a tactical market structure design console.

PREMIUM TSD-47 INTERFACE

Designed with a futuristic tactical command-center layout, the dashboard delivers:

⚡ Compact professional workflow
⚡ High readability
⚡ Fast configuration access
⚡ Live tactical feedback
⚡ Premium branded visual experience

The interface was engineered specifically for:

  • scalpers,
  • trend traders,
  • market structure traders,
  • manual execution traders,
  • strategy designers,
  • EA developers.
LIVE EMA / SMA ENGINEERING

Configure up to 5 moving averages directly from the dashboard.

Each MA can be independently configured as:

✔ EMA
✔ SMA

Each moving average includes:

  • live period tuning,
  • visibility ON/OFF,
  • instant stack updates.

No need to constantly open MT5 input menus.

Everything is engineered for fast tactical workflow.

STACK STATUS ENGINE

Instantly see the current structure condition:

✔ Bull Stack
✔ Bear Stack
✔ Mixed / Tuning

This allows traders to quickly identify:

  • trend strength,
  • transition phases,
  • compression,
  • continuation structure,
  • market imbalance.

Perfect for:

  • trend-following systems,
  • pullback trading,
  • continuation analysis,
  • EMA alignment strategies.
CROSS TUNER SYSTEM

Configure up to 3 independent crossover engines.

Each crossover can use:

  • fast MA,
  • slow MA,
  • independent display settings.

Choose your signal object type:

◆ Arrow
◆ Diamond
◆ Dot

This creates a highly customizable visual signal environment.

PROFESSIONAL EXPORT SYSTEM

One of the most powerful features of the TSD-47 Tactical EMA Designer.

The Export Engine creates a professional TXT configuration report containing:

✔ EMA/SMA structure
✔ Cross settings
✔ Tactical configuration
✔ Symbol information
✔ Strategy blueprint data

This export can be used for:

✔ Strategy documentation
✔ Sharing setups
✔ EA development planning
✔ Trading journals
✔ System archiving

This transforms the indicator into a true strategy engineering tool.

CHART INFO PANEL

Instantly access important symbol information directly from the chart:

✔ Spread information
✔ Point size
✔ Tick size
✔ Tick value
✔ Contract size
✔ Volume information
✔ Practical trading notes

Useful for:

  • scalpers,
  • gold traders,
  • synthetic traders,
  • spread-sensitive systems.
PERFECT FOR

✔ Gold traders (XAUUSD)
✔ Forex traders
✔ Scalpers
✔ Intraday traders
✔ EMA crossover traders
✔ Trend traders
✔ Strategy designers
✔ EA developers
✔ Trading educators

DEFAULT PROFESSIONAL STRUCTURE

The indicator ships with a proven tactical EMA structure:

MA1 → 8 EMA
MA2 → 13 EMA
MA3 → 21 EMA
MA4 → 50 EMA
MA5 → 200 EMA

Default Cross Engines:

  • MA1 × MA2
  • MA2 × MA3
  • MA1 × MA5

Fully customizable.

TSD-47 TACTICAL SYSTEMS DIVISION

This indicator is part of the growing TSD-47 tactical trading ecosystem.

The TSD-47 design philosophy focuses on:

✔ Tactical readability
✔ Professional visual design
✔ Fast workflow
✔ Premium user experience
✔ Advanced trading utility
✔ Non-repaint reliability
✔ Strategy engineering tools

KEY FEATURES

✅ Live EMA/SMA Tuning
✅ Interactive Dashboard
✅ Tactical Stack Analysis
✅ Cross Signal Objects
✅ Professional Export Reports
✅ Chart Information System
✅ Premium TSD-47 Interface
✅ Works on Any Symbol
✅ Works on Any Timeframe
✅ Lightweight Performance
✅ Non-Repaint Plot Objects

IMPORTANT

This indicator is a professional market structure design tool.

It does not guarantee profits and should always be used with proper risk management and trading discipline.

TSD-47 Tactical EMA Designer

Engineer the Market.


推荐产品
概述 Candle Timer Countdown Pro 显示当前K线收盘的平滑、精准倒计时,并配有一个圆形进度弧,让您一眼即可直观了解剩余时间。不同于其他在无新tick时会冻结或时间漂移的计时器,本指标使用服务器时间插值算法,在 M1 至 MN 的所有周期上提供无卡顿的平滑倒计时。 无论您是在1分钟图上进行剥头皮交易,还是在H4进行波段操作,准确知道当前K线何时收盘,有助于把握入场时机、确认K线形态,并避免过早决策。 为什么本计时器与众不同 大多数 MT5 计时器仅依赖 TimeCurrent(),该函数只有在新tick到来时才更新。在低波动或高周期图表中,tick可能间隔数秒,导致计时器冻结后突然跳动。 本指标通过在每次tick到达时锚定服务器时间,并在两次tick之间使用本地毫秒时钟进行插值计算,实现每0.5秒平滑递减,无卡顿、无延迟。同时配备实时圆形进度弧,提供独特的可视化时间提示。 主要功能 精准倒计时 服务器时间插值确保即使在tick稀少时也能平滑倒计时,无冻结、无跳动、无漂移。 圆形进度弧 在倒计时文字旁显示实时圆形进度环。 可选样式: 空心圆环 实心扇形 颜色随多空方
Gold Venamax MT5
Sergei Linskii
3.5 (2)
Gold Venamax - 這是最好的股票技術指標。 此指標演算法分析資產的價格變動並反映波動性和潛在的進入區域。 指標特點: 這是一個帶有 Magic 和兩個趨勢箭頭塊的超級指標,可實現舒適且有利可圖的交易。 圖表上顯示用於切換方塊的紅色按鈕。 Magic 在指標設定中進行設置,以便您可以將指標安裝在顯示不同區塊的兩個圖表上。 Gold Venamax 可以放置在具有不同箭頭緩衝區(GV 和 SD)的兩個圖表上。 為此,您需要在設定中選擇不同的 Magic,例如,一個具有 Magic = 999,另一個具有 Magic = 666。接下來,您可以使用圖表上的紅色按鈕選擇箭頭緩衝區。 指標設定中的每個箭頭緩衝區(GV и SD)都有一個單獨的箭頭過濾器,以實現舒適且有利可圖的交易(UseFiltrGV = true; 和 UseFiltrSD = true;)。 進入的最佳訊號 = 遵循兩個緩衝區的訊號箭頭(GV 和 SD)+ 所有三個 MA 線(紅色或藍色)的方向 + TMA 通道邊界(下或上)。 TMA 通道邊界(下限或上限)也可用於鎖定利潤和/或以較短的停損位進行逆勢風險交
Trend Follower LukaHo
Lukasz Mariusz Holla
TrendFollower(趨勢分析的瑞士軍刀) 告別傳統指標。探索 TrendFollower -五大策略合一! 厭倦了指標在市場早已過頂時發出買進訊號?你的移動平均線落後只能反映上週二的趨勢?讓我們來解決這個問題。 隆重介紹 TrendFollower -一個功能強大的模組化架構(機構級),它從五個不同的角度分析市場結構。無論你是耐心的波段交易者,還是最愛「買入/賣出」按鈕的超短線交易者,你都能在這裡找到適合自己的策略。 ️ 5 種操作模式(可在設定中選擇): ZLSMA(零滯後簡單移動平均線): 我們最喜歡的模式。它是一種速度極快的移動平均線,透過內建的 ATR 指標過濾噪音,並分析斜率角度。它瞬息萬變。延遲只是個細節上的小技巧——我們總是能及時把握。 ADHD 短線交易 :專為坐不住的你打造。閃電般快速、動態的通道,帶有雲圖(上漲/下跌雲圖),旨在捕捉微小波動和強勁的動能。 超級趨勢雲圖: 經典雲圖的現代演繹。基於 ATR 的動態波動雲圖。完美適用於嚴格的追蹤停損。 趨勢交易者: 包含 10
帮助判断这个位置适不适合买。 帮助判断这个位置适不适合卖。 当四个指标同步到底时,重点观察反弹机会。 当四个指标同步处于顶部时,重点观察下跌机会。 该系统依托中国先进算法技术与高阶数学建模体系构建而成。 本人主要使用 XAUUSD M5 周期,实际效果也是这个周期最好。 由于本指标的算法与数学公式较为复杂,测试时可能会出现运行较慢的情况。测试阶段主要观察指标是否重绘、是否滞后即可,正式版使用会更加稳定。 该指标系统绝对不重绘,绝对不使用未来函数,购买前可自行测试观察。 该指标配有完全个性化的警报系统,您可以通过以下链接进行观看。 请在正式使用前,充分阅读完整使用说明。 如有任何问题,请及时与我联系,我会尽快回复。祝您一切顺利。 https://www.mql5.com/zh/users/godofwarguo1
Visual Dolphin Indicator
AL MOOSAWI ABDULLAH JAFFER BAQER
Visual Dolphin Indicator Unlock the rhythm of the market with the Visual Dolphin Indicator, your ultimate tool for identifying and capitalizing on market trends with clarity and confidence. Designed for both novice and experienced traders, this indicator eliminates the noise and guesswork, providing crystal-clear buy and sell signals directly on your chart. The Logic Behind the Waves The core of the Visual Dolphin Indicator is a sophisticated yet intuitive dual-wave system based on moving avera
TheRealPrice v3.0 | Ultimate Spread & Ask Visualizer TheRealPrice is a high-precision utility for MetaTrader 5 designed to expose the hidden cost of every trade: The Spread . While standard charts only display the Bid price, professional traders know that buy orders and short-exits happen at the Ask price. TheRealPrice bridges this gap by drawing a dynamic, real-time horizontal line that tracks the exact Ask level, providing a clear visual representation of the current market spread. Why do you
RSI Currency Strength Meter is a powerful and elegant multi-currency indicator that measures the real-time relative strength of the 8 major currencies using RSI logic. By calculating the smoothed performance of each currency across its major pairs and applying the RSI formula, it delivers clean and responsive strength lines that make it easy to spot which currencies are truly strong or weak at any moment. This indicator is particularly useful for visualizing currency correlations and divergence
RED ZONE Monitor Loss-Cut & Break-Even Risk Monitor for Averaging Traders (MT5) RED ZONE Monitor is a risk management indicator for traders who use averaging, scaling-in, or multiple open positions . It visually displays: The loss-cut (liquidation) risk zone The break-even price Based on current open positions, lots, and margin conditions This indicator does not provide entry signals. It does not promise profits. It shows where your account actually fails if price moves against you. What RED ZO
Connors PercentB
MATTHEW STAN WILLS
Larry Connors TPS – PercentB - (Bollinger Band %) A professional implementation of Larry Connors' Percent B strategy, designed to systematically capture high-probability short-term reversals in equity markets. This system uses the Bollinger Band %b indicator to identify when price has moved to a statistical extreme relative to its recent volatility envelope. When %b drops near zero, price is at or below the lower Bollinger Band — a quantified oversold condition that this EA captures with discipl
VR Grid Mt5
Vladimir Pastushak
3.25 (8)
VR 网格指示器 设计 用于创建具有用户定义设置的图形网格。与 标准网格 不同,VR 网格用于构建 圆形关卡 。根据用户的选择,轮次级别之间的步长可以是任意的。此外,与其他指标和实用程序不同,即使时间段发生变化或终端重新启动,VR Grid 也能保持网格的位置 。 设置、设置文件、演示版本、说明、问题解决,可以从以下位置获取 [博客] 您可以在以下位置阅读或撰写评论 [关联] 版本为 [MetaTrader 4] 垂直级别 基于实际时间间隔并 忽略缺失 或不存在的周期。因此,级别之间的步长严格对应于用户选择的值。 使用 VR 网格指标时,交易者 可以更改任何级别的垂直线和水平线的样式 、颜色和粗细。这使您可以控制金融工具的 回合水平 。 整数位是 以两个或多个零结尾 的价格(例如:1.23500、5.65900、1923.200)。人们相信,这样的水平 经常充当 作为支撑或阻力的强点。 Horizontal line settings Horizontal line step Horizontal line color Horizontal line style Horizonta
FREE
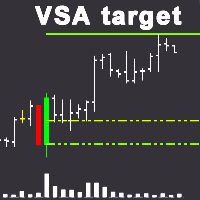
VSA target
Evgenii Bazhenov
VSA目标 该指标使用Vsa(成交量点差分析)系统在图表上识别专业买家或专业卖家,并建立相对于这些柱(烛台)的趋势支撑区,以及目标水平。  特征: 1. 在该指标中,您可以选择一种模式,其中只有专业买家或专业卖家将被确定,并且两个专业参与者将在同一时间被确定。 2. 您可以在符号上设置任何时间帧来确定支持区域和目标水平。 交易时,设置更大的时间框架来确定支撑区域和目标水平,并且交易本身可以在更小的时间框架上进行,以便更准确地进入交易。  3. 在指标设置中,如果使用分时交易量,您可以选择分时交易量,如果使用实际交易量,则可以选择实际交易量。 4. 在确定大型卖家或买家时,您可以手动选择该卷的卷大小和搜索期。 5. 可用于创建专家。 资料描述: 绿色虚线是买方的支持区。 绿色实线(粗线)(TP1,TP2)是您需要平仓的目标价位。 红色虚线是卖家的支持区域。 红色实线(粗线)(TP1,TP2)是您需要平仓的目标价位。 开设购买仓位的建议  在绿色条纹(专业买家)出现后,形成客户支持区。 在此区域中,您可以以最小的风险进行购买交易,前提是销售柱的点差很小。 止损位于买方支持区域下方。 T
Ultimate Candle Patterns
Wojciech Daniel Knoff
Check out my TRADE PLANNER MT5 – strongly recommended to anticipate account scenarios before risking any money. This is a multi-symbol, multi-timeframe, table-based indicator for MetaTrader 5 that identifies 46 types of candlestick formations. Each formation has its own image for easier recognition. The indicator includes popular patterns such as Engulfing, Hammer, Three Line Strike, Piercing, and Doji-like candles. You can check the full list of patterns in the screenshots below. Also you can
Ichimoku Kinko Hyo 的目的-建立在几乎每一个交易市场被成功应用的趋势交易系统。它在许多方面都是独一无二的,但它的主要优势是其使用多个数据点,为交易者提供一个更深入,更全面的价格走势视角。这种深入视角,事实上,Ichimoku 是一款非常优秀的可视系统,能够令交易者从那些高概率中 "一目了然" 地快速识别和过滤低概率的交易设置。 本指标基于标准的 MT5 Ichimoku Kinko Hyo 指标,但我已经将它设计为跟踪其它数值 (RSI, CCI, Momentum, TEMA, ...),且替换至子窗口。 您可以使用它作为其它策略的确认,或者如果您是一个专门的 Ichimoku 用户,您可以将它作为您的 Ichimoku 图表一个梦幻般的辅助。 这是免费版本, 您只能在子窗口里使用 RSI-Ichimoku/原始 Ichimoku。 参看 专业 和 专业多时间帧 版本。
CCI Fixed Dual
Edoardo Centorame
什么是 CCI FIXED DUAL CCI FIXED DUAL 是一个专业级 Trend Direction Filter,旨在精准识别: 市场的主导方向 走势的结构质量 主趋势与加速阶段之间的一致性 它不是一个直接入场指标。 它不是一个传统振荡器。 它是一个市场环境工具,旨在帮助交易者决定何时交易以及何时不交易,从而大幅减少市场噪音和判断错误。 CCI FIXED DUAL 的基本理念 CCI FIXED DUAL 所基于的原则简单但强大: 一个信号只有在与市场结构一致时才有价值。 因此,该指标: 不使用单一数值 不会对价格做出冲动反应 不会刻意寻找反转点 而是建立在以下基础之上,构建出一种层级化的趋势解读: 基于 Typical Price 的 CCI 不同速度的 LWMA 移动平均线 短期 中期 和长期之间的动态比较 因此,其结果是对市场方向的一种稳定 干净 且可靠的表达。 指标的技术结构: CCI FIXED DUAL 由四个主要部分组成,全部显示在独立窗口中。 1 CCI magenta 线 这是指标的信息基础。 衡量典型价格的偏离程度 提供应用平滑处理的原始材料 它并不
Aroon Trend
Adrian Lara Carrasco
Aroon 趋势指标说明 Aroon 趋势指标 —— 完整解读 Aroon 指标是一种强大的趋势分析工具,用于帮助交易者识别市场趋势的形成、强度以及成熟阶段。 它由两条主要线组成: Aroon Up(向上线) 和 Aroon Down(向下线) 。 这两条线根据价格距离最近一次高点或低点所经过的时间来计算,从而帮助交易者判断市场的真实动能。 当 Aroon Up 长时间保持在 100 附近,而 Aroon Down 保持在较低水平时,市场通常被视为处于强劲上升趋势。 相反,如果 Aroon Down 高企而 Aroon Up 较低,则市场可能处于强烈下跌趋势中。 因此,Aroon 指标非常适用于趋势跟随策略、突破策略以及波段交易系统。 通过观察两条线的交叉,交易者可以识别以下信号: 趋势早期反转信号 趋势延续与确认 市场横盘与低波动时期 动能衰竭区域 突破的潜在确认 与传统基于价格波动的指标不同,Aroon 更注重 基于时间的趋势力量 , 因此它往往能提供更早、更准确的趋势预警信号。 Darwinex Zero 专属折扣码 如果你正在使用 Darwinex Zero,这里提供一个 20
FREE
SlopeChannelB MT5
MIKHAIL VINOGRADOV
SlopeChannelB – 一种技术分析工具,构建倾斜的价格运动通道,为评估当前市场状况和寻找交易信号提供独特机会。 指标的主要特点: 倾斜的价格运动通道 : 该指标有助于可视化支持和阻力水平,这些水平可能表明潜在的反转点或趋势持续。 线条颜色多样和背景突出显示 : 倾斜的支持和阻力级别以不同颜色显示,通道本身还通过背景额外突出,简化图表的视觉分析。 三种计算线条的选项 : 指标使用回归分析来构建通道线。您可以选择以下三种方法之一: Robust (默认) – 对异常值具有鲁棒性的方法。 OLS (普通最小二乘法) 。 Median (中位数计算) 。 最优模型选择 : SlopeChannelB根据五个质量标准的分析自动选择最适合的通道线变体。 质量参数直接在图表上显示,帮助您评估结果。您还可以使用按钮手动切换通道构建选项。 双信号系统 : 第一信号 – 当价格达到倾斜的阻力或支持级别时发生。 第二信号 – 记录价格从级别到通道中心的移动。 这些信号有助于寻找反弹的入场点,但始终需要其他工具的确认。 与其他指标联合使用 : 建议将SlopeChannelB与振荡器或趋势
The Scaled Awesome Oscillator (SAO) represents a refined adaptation of the Awesome Oscillator, aimed at establishing consistent benchmarks for identifying market edges. Unlike the standard Awesome Oscillator, which records the variation in pips across different commodities, the only unchanging reference point is the zero line. This limitation hampers investors and traders from pinpointing specific levels for trend reversals or continuations using the traditional Awesome Indicator, a creation of
FREE
The  Kijun-Sen Envelope  is a powerful trend-following indicator based on the  Kijun-Sen  line from the Ichimoku Kinko Hyo system. This tool creates dynamic upper and lower bands around the Kijun-Sen, forming an envelope that helps traders identify market trends, potential reversals, and overbought/oversold conditions. Key Features: • Trend Confirmation – Helps determine whether the market is in a strong uptrend, downtrend, or ranging phase. • Support & Resistance Zones – The envelope acts as
FREE
Please download version 3.0 ! The Fundamental Fast Signal EA is a non-trading signal generator for MT5 , designed to provide traders with high-accuracy buy/sell alerts based on the EMA (9, 21) crossover on the 5-minute timeframe . This indicator empowers traders by offering precise entry signals while keeping full trade execution control in their hands. Key Features: EMA (9, 21) Crossover-Based Signals – Identifies momentum shifts for strategic trade entries. 5-Minute Timeframe Optimization – Id
FREE
IQuantum
Evgeniy Scherbina
The indicator IQuantum shows trading signals for 10 symbols in the daily chart: AUDCAD, AUDUSD, EURUSD, GBPCAD, GBPCHF, GBPUSD, NZDUSD, USDCAD, USDCHF, and USDJPY. Signals of the indicator are produced by 2 neural models which were trained independently from one another. The inputs for the neural models are normalised prices of the symbols, as well as prices of Gold, Silver and markers of the current day. Each neural model was trained in 2 ways. The Ultimate mode is an overfitted neural model
FREE
ROMAN5 时间突破指标自动绘制日线的支撑和阻力突破箱体。它可帮助用户识别何处进行买入、卖出。当新信号出现时,它可发出提示和声音。它还具有发送邮件功能。您的邮件地址和 SMTP 服务器设置应该在 MetaTrader 5 的 "邮箱" 标栏里的设置窗口里指定。 蓝色向上箭头 = 买。 红色向下箭头 = 卖。 您可以使用一款我的移动止损产品,来自动移动止损,并包括设置盈亏平衡。 ROMAN5 分型移动止损   ROMAN5 抛物线SAR 移动止损 ROMAN5 布林带移动止损 ROMAN5 HeikenAshi 移动止损 ROMAN5 均线移动止损 ROMAN5 高级移动止损 如果您希望尝试 EA, 参见 ROMAN5 时间突破 EA 。 版本 1.2: 发送推送通知至移动终端。
FREE
Trade Helper
Pavel Gotkevitch
The Trade Helper indicator is a modification of the Trade Assistant indicator (by Andriy Moraru). The Trade Helper multitimeframe indicator is a good assistant for traders, useful as a filter in most trading strategies. This indicator combines the tactics of Elder's Triple Screen in a single chart, which lies in entering a trade when the same trend is present on three adjacent timeframes. The indicator operation is based on the principle of determining the trend on the three selected timeframes
Correlation Matrix Pro - 多货币相关性分析 实时了解货币对之间的相关性! 一款强大的分析工具,可帮助您同时可视化多达6个货币对之间的统计关系。非常适合投资组合管理、风险分散和对冲策略。 主要功能 - 使用对数收益率的实时皮尔逊相关性 - 同时监控多达6个货币对 - 自动时间框架检测 - 可调回溯周期(5-200根K线) - 自动对冲机会检测 - 简约可折叠面板设计 - 颜色编码矩阵,即时解读 颜色编码 绿色 (+0.70 至 +1.00) = 强正相关 浅绿色 (+0.50 至 +0.69) = 中等正相关 灰色 (-0.49 至 +0.49) = 弱/无相关 橙色 (-0.50 至 -0.69) = 中等负相关 红色 (-0.70 至 -1.00) = 强负相关(对冲) 为什么要关注相关性? 风险管理 避免通过高度相关的头寸使风险加倍。 对冲策略 自动找到具有强负相关性的货币对进行有效对冲。 投资组合多元化 使用低相关性货币对构建多元化投资组合。 相关性突破 检测背离——通常是即将到来的市场变动信号。 输入参数 显示设置: - 面板 X/Y 位置 - 启动时
FREE
VFI Quantum
Nikita Berdnikov
5 (1)
Introducing VFI (Volume Flow Indicator) – a trading indicator that analyzes the relationship between volume and price movement to identify key trading opportunities. The indicator displays the strength and direction of volume flow, providing clear signals about potential entry and exit points. Signals are formed based on zero line crossovers, crossovers between the VFI line and its exponential moving average (EMA), and when the indicator exits overbought and oversold zones. Attention! This stra
FREE
Every indicator has its advantages and disadvantages. Trending ones show good signals during a trend, but lag during a flat. Flat ones thrive in the flat, but die off as soon as a trend comes. All this would not be a problem, if it was easy to predict when a flat changes to a trend and when a trend changes to a flat, but in practice it is an extremely serious task. What if you develop such an algorithm, which could eliminate an indicator's flaws and enhance its strengths? What if such an algorit
TransitBlueOcean
Bonginkosi Innocent Khumalo
5 (1)
TransitBlueOcean is indicator system that uses ocean wave's pattern, to help one to know when to buy and when to sell. The indicator system is very powerful like the ocean waves. Join the mql5 channel for TransitBlueOcean  https://www.mql5.com/en/channels/transitblueocean   How to use: Zoom in so that the Ocean will appear on your chart. Buy when you see the candles, the candle will be above the ocean wave (buying signal). Sell when you can't see the candles, the candles will be inside the wav
该指标建立当前报价,可以与历史报价进行比较,并在此基础上进行价格走势预测。指示器有一个文本字段,用于快速导航到所需日期。 选项: 符号 - 选择指标将显示的符号; SymbolPeriod - 选择指标从中获取数据的时段; IndicatorColor - 指示器颜色; HorisontalShift - 由指标绘制的报价移动指定的柱数; Inverse - true 反转引号,false - 原始视图; ChartVerticalShiftStep - 图表垂直移动(键盘上的向上/向下箭头); 接下来是文本字段的设置,您可以在其中输入日期,您可以通过按“回车”立即跳转到该日期。 接下来是文本字段的设置,您可以在其中输入日期,您可以通过按“回车”立即跳转到该日期。
Smart Boxes
Haolong Liu
**SPECIAL LAUNCH PRICING:** **REGULAR PRICE:** ~~$200~~ **PROMO LAUNCH PRICE:** **$100** **YOU SAVE:** $100 (50% OFF) **PRICE INCREASE WILL INCREASE EVERY 10 SALE :** *$100 increases with every sale!* --- Smart Boxes Indicator: Multi‑Session Breakout, Wick Rejection & Smart Signal System Smart Boxes  is a professional‑grade market structure indicator engineered for traders who rely on precision, session timing, and clean intraday levels. It automatically maps the Opening Range, Yeste
平均方向指数(ADX) 多货币扫描仪 MT5 是一种先进的交易指标,旨在同时分析多个货币对。它为希望通过基于平均方向指数提供实时信号来增强决策过程的交易者带来了好处,从而实现高效的市场趋势分析。 该工具通过简化趋势强度和方向移动的识别,优化了交易体验,使其成为采用 ADX 基础策略的交易者的重要资产。借助实时警报和用户友好的仪表板,交易者可以快速评估市场状况并做出明智的交易选择。 MQL产品安装指南 | 在 MT4/MT5 上更新已购买的MQL产品 | 常见故障排除指南 | 指标设置/指南 主要特点 缓冲区集成:将指标值暴露为可访问的缓冲区,允许 Expert Advisor 使用信号数据进行自动交易。 可视化箭头信号:在信号蜡烛上直接在图表上显示清晰的买入/卖出箭头,便于快速视觉分析。 快速且可回测:基于 MetaTrader 的本地 OnCalculate() 引擎构建,确保快速计算并与历史回测兼容。 弹出警报:在信号事件期间触发 MetaTrader 警报弹出窗口,确保交易者不会错过潜在的交易设置。 推送通知:向移动设备发送即时推送通知,使交易者能够在移动中监控信号。 电子邮件警
Nika Session Spread Intelligence 是一款轻量级图表指标,直接在图表上以简洁的深色面板显示市场开盘时间、距离收盘的剩余时间以及所有交易时段。 与普通时段指标不同,此工具通过 de>SymbolInfoSessionTrade 读取您经纪商的 实际交易时段 ,因此显示的时间始终准确——无论是外汇、指数、商品还是加密货币。 主要功能 > 实时开盘/收盘状态 ,颜色指示(绿色 = 开盘,红色 = 收盘) > 倒计时器 — 距离收盘或下次开盘的剩余时间,每500毫秒更新 > 可视化进度条 — 随时段推进填充,接近收盘时变为橙色 > 当日所有时段列表 (服务器时间),活跃时段高亮显示 > 内置提醒 — 在时段开盘或收盘前X分钟通知(可配置,支持声音) > 缩放功能 — 面板上直接使用 + / - 按钮 > 完全可自定义 — 颜色、字体、位置、刷新率和缩放通过输入参数设置 > 适用于任何品种 — 设置自定义品种或留空使用当前图表品种 输入参数概览 > Symbol — 留空则使用当前图表品种 > X / Y Position — 面板在屏幕上的锚点位置 > Color
FREE
该产品的买家也购买
SignalTech MT5
Yue Wang
5 (26)
SignalTech MT5 is an unique fully rule based trading system for EURUSD, USDCHF, USDJPY, AUDUSD, NZDUSD, EURJPY, AUDJPY, NZDJPY, CADJPY.  All the winning trades with chart setups are published on the comments page. 2026-05 3690 Pips (Until 05-26 NY Closed) 2026-04 2243 Pips 2026-03 2165 Pips 2026-02 2937 Pips 2026-01 2624 Pips 2025-12 1174 Pips It can generate signals with Buy/Sell Arrows and Pop-Up/Sound Alerts. Each signal has clear Entry and Stop Loss levels, which should be automatically flag
Azimuth Pro
Ottaviano De Cicco
5 (7)
Azimuth Pro V2:MT5合成分形结构分析与确认入场 概述 Azimuth Pro 是 Merkava Labs 推出的多层级波段结构指标。四层嵌套波段层级、锚定波段的VWAP、ABC形态识别、三时间框架结构过滤以及收盘确认入场——一个图表,一个从微观波段到宏观周期的完整工作流程。 这不是盲目的信号产品。它是一个以结构为先的工作流程,专为重视位置、背景和时机的交易者打造。 V2上市优惠 — Azimuth Pro V2售价USD 399(接下来的100份)。最终价格:USD 499。 1. V2的变化 合成多时间框架引擎 高时间框架分析从零开始重建,采用与Meridian Pro相同的专有合成架构。更清晰的HTF背景、稳定的实时行为、无经典MTF同步问题。合成引擎还解锁了 固定比率时间框架级联 (x2、x3、x4、x6)——不再在经纪商的固定时间框架之间任意跳转,您可以按图表时间框架的固定倍数分析结构,在每个尺度上保持相同的分形关系。 确认入场箭头 作为稳定且可恢复的执行层而设计的收盘确认箭头。当ABC设置形成且自适应确认逻辑在收盘K线上验证方向时,箭头会写入下一根K线的
首先,值得强调的是,这个交易工具是非重绘、非重画和非滞后的指标,非常适合专业交易。 在线课程,用户手册和演示。 智能价格行动概念指标是一个非常强大的工具,既适用于新手,也适用于经验丰富的交易者。它将超过20个有用的指标合并到一个指标中,结合了高级交易思想,如内圈交易员分析和智能资金概念交易策略。该指标侧重于智能资金概念,提供有关大型机构交易方式的见解,帮助预测它们的动向。 它在流动性分析方面尤其擅长,有助于理解机构的交易方式。它擅长预测市场趋势,并仔细分析价格波动。通过将您的交易与机构策略对齐,您可以更准确地预测市场走向。该指标多才多艺,擅长分析市场结构,识别重要的订单区块,并识别各种模式。 它擅长识别BOS和CHoCH等模式,理解动量的转变,并突出显示供需强劲的关键区域。它还擅长发现强大的不平衡,并分析价格创造更高高点或更低低点的模式。如果您使用斐波那契回撤工具,该指标可以满足您的需求。它还可以识别相等的高点和低点,分析不同的时间框架,并通过仪表板显示数据。 对于使用更高级策略的交易者,该指标提供了工具,如公平价值差指标和优惠和折扣区域的识别。它特别关注高时间框架订单区块,并
ARIPoint
Temirlan Kdyrkhan
1 (1)
ARIPoint is a powerful trading companion designed to generate high-probability entry signals with dynamic TP/SL/DP levels based on volatility. Built-in performance tracking shows win/loss stats, PP1/PP2 hits, and success rates all updated live. Key Features: Buy/Sell signals with adaptive volatility bands Real-time TP/SL/DP levels based on ATR Built-in MA Filter with optional ATR/StdDev volatility Performance stats panel (Success, Profit/Loss, PP1/PP2) Alerts via popup, sound, push, or email Cu
RelicusRoad Pro MT5
Relicus LLC
4.96 (24)
RelicusRoad Pro: 量化市场操作系统 终身访问限时 70% 折扣 - 加入 2,000+ 交易员社区 为什么大多数交易者即使拥有“完美”指标也会失败? 因为他们在真空中交易 单一概念 。没有背景的信号是赌博。要持续获胜,您需要 共振 (CONFLUENCE) 。 RelicusRoad Pro 不是一个简单的箭头指标。它是一个完整的 量化市场生态系统 。它描绘价格运行的“公允价值之路”,区分市场噪音和真实的结构性突破。 停止猜测。开始用机构级“路”逻辑进行交易。 核心引擎:“Road” (路) 算法 系统的核心是 Road Algo ,一个实时适应市场条件的动态波动率通道。它投射出 安全线 (平衡) 和价格可能反转的 扩展水平 。 Simple Road: 典型市场的标准结构映射。 Smooth Road: 针对震荡盘整的降噪计算。 Breakout Road: 专为识别波动率扩张和爆发性走势而调整。 1. 算法动量与确认 我们的“剥头皮箭头”不只是简单的交叉。它们利用 高阶多项式逻辑 过滤噪音,确保信号与主周期一致。我们检测动量、价格行为和 Road 结构汇聚的精确入场
KT Alpha Hunter Arrows MT5
KEENBASE SOFTWARE SOLUTIONS
大多数箭头指标只给你一个信号,然后让你自己去判断剩下的一切。KT Alpha Hunter Arrows 为你提供完整的交易计划。 每一个信号箭头出现时,都会同时绘制一套完整计划:入场线、止损位、四个止盈目标,以及实时优势判断,告诉你当前这个交易品种和时间周期是否值得交易。随附的 Trade Manager EA 会在你手动入场后负责后续执行,让你在市场波动剧烈、情绪干扰明显时也能保持交易纪律。不重绘。仅在K线收盘后确认信号。适用于 Forex、黄金、指数以及任何你在 MT5 上交易的品种。 核心功能 不重绘买入和卖出箭头,只在K线收盘后生成。 每个信号都会显示入场线、结构性止损位和四个止盈目标。 Edge Dashboard 会分别评估当前图表上的买入和卖出机会。 判断系统包括:No Edge、Marginal、Tradeable、Good 或 Strong。 一键 Auto Optimize 按钮可根据当前品种和时间周期自动优化设置。 完整套装包含 Trade Manager EA,并提供五种专为本指标设计的预设交易管理方案。 Prop Firm Risk Panel 可在图表上
MetaTrader 5 智能多层突破与回调探测器 "智能 · 简单 · 快速!" 您是否厌倦了错过高概率的突破入场机会? 您是否花费数小时扫描多张图表,试图将突破与趋势方向和货币动能对齐——却仍然错过了行情? Break Pullback 用一个指标解决所有这些问题。 什么是 Break Pullback? Break Pullback 是一款专业级 MetaTrader 5 指标,专为交易市场结构、突破和趋势延续形态的交易者而设计。 它能实时自动检测多个货币对的突破与回调形态——并通过三层确认过滤每个信号: 结构突破检测——识别图表上的关键突破位 高时间框架日线偏向——将入场与主导日线趋势方向对齐 货币强弱指数——确认配对货币间的动能失衡 结果:更少的虚假信号,更强的信心,更快的执行——无需面对图表过载。 适合哪些交易者? Break Pullback 专为使用以下方法的交易者设计: 突破与回测策略 市场结构分析(BOS、 OB Order Block 、结构位) 聪明钱概念(SMC)或 ICT 风格入场 趋势跟踪与延续形态 跨外汇和黄金(XAUUSD)的多对扫描 日内和波段
The Propfolio Master Suite is the ultimate all-in-one analytical workstation for professional traders. Combining the power of the Beat The Market Maker (BTMM) methodology, Smart Money Concepts (SND/Liquidity), and Advanced Volume Profile, this suite replaces multiple different indicators with one optimized engine. Monitor up to 14 pairs simultaneously from a single chart, instantly identify market cycles, and seamlessly map institutional footprints with the click of a button. The Command Center
ARICoins
Temirlan Kdyrkhan
ARICoin is a powerful trading companion designed to generate high-probability entry signals with dynamic TP/SL/DP levels based on volatility. Built-in performance tracking shows win/loss stats, PP1/PP2 hits, and success rates all updated live. Key Features: Buy/Sell signals with adaptive volatility bands Real-time TP/SL/DP levels based on ATR Built-in MA Filter with optional ATR/StdDev volatility Performance stats panel (Success, Profit/Loss, PP1/PP2) Alerts via popup, sound, push, or email Cust
UZFX {SSS} 短线智能信号 MT5 是一款无重绘的高性能交易指标,专为在快速波动的市场中需要精准、实时信号的短线交易者、日内交易者和波段交易者设计。该指标由 (UZFX-LABS) 开发,融合了价格行为分析、趋势确认和智能过滤技术,可在所有货币对和时间周期内生成高概率的买入和卖出信号。 我推荐*的最佳时间周期:15分钟及以上。 {1小时}是我的首选。效果令人惊叹……! 注意:与{ LTL 164343 }指标结合使用,可提高获胜信号率。 使用 LTL 信号判断趋势,利用 SSS 信号确定入场时机。 这种方法将最大化您的胜率,并有效规避虚假信号。 核心功能 智能信号检测——精准识别强劲的趋势反转与延续形态。 多周期短线交易——在所有时间周期内运行流畅。 可自定义提醒——针对每个信号接收弹出窗口、电子邮件及手机通知(可配置)。 清晰可视箭头——图表上醒目的蓝色(买入)和红色(卖出)箭头。 自适应信号强度——可调节信号强度,适用于短期、中期或长期交易。 用户友好界面——简洁的图表显示,无重绘或信号延迟。 工作原理 UZFX SSS指标通过扫描价格走势来检测: 看涨反转——价格
OmniSync Projection
Antonio-alin Teculescu
5 (1)
Chronos Fractal Engine is an innovative price projection indicator for MetaTrader 5, designed to transform your technical analysis by intelligently identifying and projecting historical price patterns. Built upon an advanced correlation algorithm and the fractal principles of the market, this powerful tool visualizes potential future price movements, giving you a unique edge in your trading decisions. What is Chronos Fractal Engine? At its core, the Chronos Fractal Engine employs a sophisticat
“ Dynamic Scalper System MT5 ”指标专为在趋势波内进行剥头皮交易而设计。 已在主要货币对和黄金上进行测试,并可与其他交易工具兼容。 提供顺势短线建仓信号,并提供额外的价格变动支持。 指标原理: 大箭头决定趋势方向。 在趋势波内,我们采用一种生成小箭头形式的剥头皮交易信号的算法。 红色箭头代表看涨方向,蓝色箭头代表看跌方向。 敏感的价格变动线会沿着趋势方向绘制,并与小箭头信号协同作用。 信号运作方式如下:当线在适当时刻出现时,将形成入场信号;在出现线时,持仓;线完成后,平仓。 建议的操作时间范围为M1 - H4。 箭头在当前K线上方形成,如果下一根K线已开仓,则不会重新绘制上一根K线上方的箭头。 输入参数 Trend Wave Period - 趋势方向(大箭头)的周期,改变趋势波的时间间隔。值 1 表示趋势方向的最长持续时间,参数值越大,持续时间越短。 Scalper Arrows Period - 信号箭头(小箭头)的计算周期,改变入场信号的生成频率。值 3 表示最频繁的生成频率,参数值越大,箭头频率越低,准确度越高。 这些参数可以根据不同
AriX
Temirlan Kdyrkhan
1 (4)
AriX Indicator for MT5 A powerful trend-following and signal-evaluation tool AriX is a custom MT5 indicator that combines Moving Averages and ATR-based risk/reward logic to generate clear buy/sell signals. It visualizes dynamic SL/TP levels, evaluates past trade outcomes, and displays win/loss statistics in a clean on-chart panel. Key features include: Buy/Sell signals based on MA crossovers ATR-based SL/TP1/TP2/TP3 levels with visual lines and labels Signal outcome tracking with real-time stat
Gem SIGNAL
Shengzu Zhong
5 (1)
GEM Signal Pro GEM Signal Pro 是一款適用於 MetaTrader 5 的趨勢跟隨指標,專為希望在圖表上獲得更清晰訊號、更有結構的交易設定,以及更實用風險管理的交易者而設計。 它不僅僅顯示一個簡單的箭頭,GEM Signal Pro 還能以更清晰、更易讀的方式呈現完整的交易思路。當條件確認完成後,指標可在圖表上顯示進場價、止損價與止盈目標,幫助交易者更有效率地評估交易設定。 運作方式 該指標首先根據其內部邏輯識別有效的初始訊號。 當確認條件滿足後,GEM Signal Pro 會在圖表上顯示完整的交易設定。這讓交易者可以更清楚地看到交易結構,並減少手動分析與計算的工作量。 圖表上的交易價位 對於已確認的訊號,GEM Signal Pro 可顯示: 進場價 止損價 止盈 1 止盈 2 止盈 3 風險報酬比 這讓交易設定更容易理解,也有助於讓圖表分析更有條理。 內建風險管理 風險管理是此指標設計的重要部分。 止損位基於近期市場結構,結合附近的擺動高低點與可選的 ATR 緩衝距離。這能讓交易價位更貼近當前市場條件,而不只是依賴固定距離。 圖表資訊面板 GEM Si
CGE Trading Suite
Carl Gustav Johan Ekstrom
5 (2)
Institutional-Grade Analytics for MT5 C GE Trading Suite delivers the analytical edge typically reserved for professional trading desks. The platform integrates a full suite of analytical tools into one seamless workflow: dynamic grid mapping, liquidity behavior analysis, ECM, trend lines, MIDAS, trade cycles, and directional channel projections. Together, these provide a unified view of market structure and momentum. Directional clarity is further enhanced by the capital flow index, which meas
Ziva LSE System
Hassan Abdullah Hassan Al Balushi
ZIVA LSE System A Professional Liquidity & Structure Execution Framework Executive Overview ZIVA LSE System is a professionally engineered analytical framework designed to interpret market behavior through structural logic and liquidity dynamics. It is not positioned as a conventional indicator. Rather, it functions as a structured execution environment that organizes price action into a clear, disciplined decision-making model. The system is built to deliver consistency, clarity, and controlled
Hidden Trend Channel Project 17 Tool SPECIAL NOVEMBER SALE is now finished. Price goes back to normal.  This is an Automated Tool for Multi Timeframe Trend Channel Analysis Visualization with Intelligent Range Market, Trending Market, Reversal, Breakout Detection.  It draws multiple Trend Channels with multiple sub-trendlines levels inside the channel for perfectly give you the trader, the crystal clear Trend channels where price trend direction is moving. This tool is accurately useful for T
The Zone Trading Indicator is a technical analysis tool for MetaTrader 5 that automatically identifies and displays tradable price zones across multiple timeframes to assist with structured market analysis. The indicator plots Monthly, Weekly, Daily, and H4 tradable zones , allowing traders to view higher- and lower-timeframe price areas simultaneously. These zones are designed to support one-candle–based entry approaches by highlighting predefined areas where price interaction may be monitored.
AX Forex Indicator MT5
MQL TOOLS SL
5 (1)
The AX Forex Indicator MT5 is a sophisticated trading tool designed to provide traders with a comprehensive analysis of multiple currency pairs. This   powerful indicator   simplifies the complex nature of the forex market, making it accessible for both novice and experienced traders. AX Forex Indicator uses   advanced algorithms   to detect trends, patterns and is an essential tool for traders aiming to enhance their forex trading performance. With its robust features, ease of use, and reliabl
Scalping Winning Signals Pro SWS
Muhammad Usman Siddique
5 (1)
UZFX SWS {剥头皮盈利信号} Pro v1.0是由Usman Zabir(UZFX实验室)专为剥头皮交易者、日内交易者及波段交易者开发的强力无重绘指标,旨在快速波动市场中提供精准入场信号。特别适合追求可靠实时信号、拒绝延迟或虚假重绘的交易者。 我推荐*的最佳时间周期:30分钟及以上。 {1小时}是我的首选,其效果令人惊叹...! 注意:与{ LTL 164343 }指标结合使用,可提高获胜信号率。 使用 LTL 信号判断趋势,利用 SWS 信号确定入场时机。 这种方法将最大化您的胜率,并有效规避虚假信号。 核心功能包括: 清晰的视觉箭头标示近期及历史信号(可选点状显示过往信号)。 自动计算并绘制交易线:入场点、止损位(基于近期震荡高低点)及多档止盈位(风险回报比1:1、2:1、3.5:1——完全可自定义)。 图表信息面板实时显示最新信号详情、入场价、止损位及止盈位。 全面警报系统:弹窗提示、声音提醒、推送通知及邮件提醒。 图表自定义选项(颜色、背景、K线样式)。 内置许可证过期系统保障安全分发(可通过更新日期续期)。 适用于所有货币对、大宗商品及时间周期,UZFX SWS
Presenting one-of-a-kind Gann Indicator for XAUUSD IQ Gold Gann Levels is a non-repainting, precision tool designed exclusively for XAUUSD/Gold intraday trading. It uses W.D. Gann’s square root method to plot real-time support and resistance levels, helping traders spot high-probability entries with confidence and clarity. William Delbert Gann (W.D. Gann) was an exceptional market analyst whose trading technique was based on a complex blend of mathematics, geometry, astrology, and ancient calcul
MightyPips Sentiment Pro is a market sentiment indicator for MetaTrader 5 designed to help traders analyze buying and selling pressure in the market. The indicator evaluates market behavior to provide a clearer view of trend direction, momentum strength, and overall sentiment conditions. It helps traders understand whether buyers or sellers are currently dominating the market. Features Buyer vs Seller Analysis Displays the balance between buying and selling pressure using real-time market data.
==================================================================== SMC Pro v6.1 APEX AI — XAUUSD Gold Empire MetaTrader 5 Indicator · Smart Money Concepts · Predictive Intelligence Engine ==================================================================== SMC Pro v6.1 APEX AI is a professional Smart Money Concepts indicator system built exclusively for XAUUSD (Gold) on MetaTrader 5. It combines the complete SMC framework — Order Blocks, Liquidity sweeps, Fair Value Gaps, Break of Structure,
Meravith MT5
Ivan Stefanov
5 (1)
做市商工具。 Meravith 将: 分析所有时间周期并显示当前正在运行的趋势。 标注流动性区域(成交量均衡区),即多头与空头成交量相等的位置。 在您的图表上直接显示来自不同时间周期的所有流动性水平。 生成并展示基于文本的市场分析供您参考。 根据当前趋势计算目标位、支撑位和止损位。 计算交易的风险回报比。 根据您的账户余额计算仓位大小,并估算潜在利润。 在市场出现重大变化时,Meravith 还会发出警告。 指标的主要线条: 多头/空头成交量衰竭线 —— 作为目标位使用。 趋势线 —— 指示市场趋势方向。根据市场是多头还是空头而改变颜色,并作为趋势支撑。其颜色主要反映市场情绪。 成交量均衡线(Eq)—— Eq(Volume Equilibrium)是系统的核心。它表示买卖双方成交量的平衡点,即市场流动性所在位置。向上突破 Eq 表示多头倾向,向下突破 Eq 表示空头倾向。突破后,应等待回调——当价格回到相反趋势的偏离线或衰竭线附近时。 使用方法:只需将其添加到图表中。 Meravith 可以分析一切——趋势和回调。 趋势线与某条成交量衰竭线之间的距离越大,说明该方向的成交量越高。 趋势
Big Player Range
Thalles Nascimento De Carvalho
5 (3)
BigPlayerRange — 适用于沪深300和美元人民币的最佳MT5指标 探索 BigPlayerRange 的强大功能,它被认为是用于 沪深300、上证指数、USD/CNH 等资产的 MetaTrader 5 最佳指标 。该工具能精准识别机构主力的关键区域,帮助交易者进行高精度的技术分析。 指标工作原理: BigPlayerRange 绘制两个水平区域,通过成交量分析反映市场能量: 绿色区域 :买方防守位置,支撑价格。 红色区域 :卖方压制位置,形成阻力。 使用策略: 收盘价突破绿色区域上方 :可能开启上涨趋势,目标为上方区间。 收盘价跌破红色区域下方 :暗示下跌压力增强,目标为下方支撑。 价格停留在区间内 :行情震荡,等待突破信号。 核心优势: 机构活动区域识别 :提前发现主力进出场信号。 自动计算的目标价格 :提供两个明确的止盈位置。 回调概率分析 :优化风险控制,提升稳定性。 参数个性化设置: 自定义交易时间与成交量类型(Tick或真实成交量)。 使用机构逻辑提升日内交易效率。 推荐搭配
Assembler
Darko Licardo
5 (1)
Introducing Assembler:  The best value for money,  Designed for advanced traders and professionals, yet accessible for ambitious beginners ready to elevate their trading game. Great for ICT, SMC, TREND and breakout traders . Combining advanced analytics, a sleek graphical interface, and highly customizable features, Assembler empowers you to trade with precision, clarity, and confidence. Key Features of Assembler 1. Dynamic Graphical User Interface (GUI): A fully draggable, customizable interf
TPA True Price Action indicator reveals the true price action of the market makers through 100% non-repainting signals strictly at the close of a candle! TPA shows entries and re-entries, every time the bulls are definitely stronger than the bears and vice versa. Not to confuse with red/green candles. The shift of power gets confirmed at the earliest stage and is ONE exit strategy of several. There are available now two free parts of the TPA User Guide for our customers. The first "The Basics"
Gold Xausd Hunter
Metin Erkamoglu
5 (1)
MATADOR GOLD XAUUSD M5 Scalp Signals for MT5 MATADOR GOLD is a decision-support indicator for MetaTrader 5, designed for traders who analyze short-term Gold movement on the M5 timeframe. The indicator does not open, close, or manage trades automatically. It provides buy and sell signal guidance so the user can make their own trading decisions according to their risk plan, broker conditions, and trade management rules. Main purpose MATADOR GOLD is built to help traders avoid noisy signal flow and
QuasarEdge
Yuki Miyake
【SPECIAL INTRODUCTORY PRICE】 Release Celebration Sale! We are currently offering Quasar Edge at a special early-bird price to celebrate its official launch. This offer is limited to a specific number of copies or a limited timeframe, after which the price will increase to the standard retail value. Don't miss this opportunity to acquire a professional-grade trading environment at its lowest price. Quasar Edge & Dual Dashboard — Transform Market Chaos into Trading Confidence: The Ultimate M
作者的更多信息
TSD-47 Tactical Candle Matrix Tactical Multi-Timeframe Candle Intelligence Dashboard TSD-47 Tactical Candle Matrix is a professional compact tactical dashboard designed to provide traders with instant multi-timeframe candle structure awareness in a clean, lightweight command-style interface. The indicator displays live candle direction, structure, and momentum across multiple timeframes simultaneously, allowing traders to quickly identify bullish and bearish pressure, timeframe alignment, and ov
FREE
RSI Matrix TSD47
Stephanus Mollentze
TSD-47 RSI Matrix TSD47 RSI Matrix is a tactical multi-timeframe momentum dashboard designed to provide instant RSI and trend-strength awareness across multiple market structures. The indicator combines: 1 Minute RSI 5 Minute RSI 15 Minute RSI ADX Trend Strength Analysis inside a compact tactical dashboard interface built for modern traders. The goal of the dashboard is to simplify momentum analysis and help traders quickly identify: bullish pressure, bearish pressure, momentum alignment, and o
FREE
TSD-47 Hologram Dancer – Little FanieLizer Bring your charts to life with a futuristic holographic companion for MetaTrader 5. Animated hologram dancer Beat-aware sound system ️ Voice-enabled feedback Smart symbol & timeframe awareness Lightweight and fun to use TSD-47 futuristic interface styling Little FanieLizer is not just another indicator — it’s a holographic MT5 experience designed to add personality, immersion, and sci-fi vibes to your trading environment. The assist
FREE
Tactical Candles TSD47
Stephanus Mollentze
TSD-47 Tactical Timeframes Advanced Multi-Timeframe Market Analysis System for MetaTrader 5 TSD-47 Tactical Timeframes is a professional-grade multi-timeframe trading indicator designed for traders who need fast, clear, and tactical market awareness directly inside MetaTrader 5. Built with the FanieLizer Systems tactical design philosophy, this indicator provides real-time multi-timeframe trend analysis, market structure visualization, directional bias monitoring, and rapid decision-support too
H1 Market Structure
Stephanus Mollentze
FanieLizer TSD-47 — H1 Market Structure Tactical Market Intelligence Dashboard for MetaTrader 5 Transform the way you read the market. The FanieLizer TSD-47 H1 Market Structure indicator is a premium tactical market structure dashboard designed for traders who want faster market interpretation, cleaner higher-timeframe awareness, and a professional trading environment directly inside MetaTrader 5. This is not a simple buy/sell indicator. H1 Market Structure is a tactical market intelligence syst
筛选:
无评论
回复评论