Dragon Trend System v3

Dragon Trend System v3 — 10-Factor Trend Scoring with Built-In Entry Signals

Stop relying on a single indicator to judge the trend. The Dragon Trend System scores 10 independent market dimensions and only generates entry signals when the combined score crosses your chosen threshold. Every signal includes DiNapoli Fibonacci TP targets and automatic SL placement.

Version 3 is a complete rebuild — one self-contained indicator replaces the old two-indicator setup. No more running separate Trend and Entry files. Everything runs from a single chart.

THE 10 SCORING COMPONENTS

Each component measures a different dimension of the market. No two components use the same data source — every point in the score is earned independently.

  1. EMA TREND (max 15 pts) Fast EMA vs Slow EMA position plus price location relative to the EMAs. Full points when price is above both EMAs in a bullish stack, partial when EMAs are aligned but price hasn't confirmed.
  2. ADX STRENGTH (max 10 pts) How strong the trend is — tiered from 2 pts (ADX 20) up to 10 pts (ADX 50+). Weak trends get low scores regardless of direction.
  3. MARKET STRUCTURE (max 12 pts) Break of structure — price closing beyond a recent swing high or swing low. This confirms the trend is making progress, not just oscillating.
  4. SWING PATTERN (max 10 pts) Higher highs and higher lows in an uptrend, lower highs and lower lows in a downtrend. The classic trend confirmation that most traders check manually — automated here.
  5. VOLUME CONFIRMATION (max 10 pts) Directional volume — a high-volume bullish candle in an uptrend scores full points. A high-volume bar against the trend scores nothing. Volume must support the move.
  6. CANDLE QUALITY (max 8 pts) Pin bars, engulfing patterns, and strong directional bodies — properly detected with ATR-normalized sizing. Not just body percentage like basic candle indicators.
  7. RSI HEALTH (max 10 pts) RSI in the healthy zone for the trend direction. Includes a penalty system: overbought in an uptrend or oversold in a downtrend subtracts points, preventing entries at exhaustion points.
  8. MACD ALIGNMENT (max 12 pts) MACD position relative to signal line and zero line, plus direction. Strong bull = above signal, above zero, and rising. Tiered scoring rewards stronger alignment.
  9. MOMENTUM (max 8 pts) ATR-normalized rate of change over 5 bars. Not a raw percentage — normalized by volatility so the score means the same thing on EURUSD as it does on Volatility 75.
  10. MULTI-TIMEFRAME (max 5 pts) Higher timeframe EMA alignment confirms the trend on a larger scale. When H1 and H4 agree (or M15 and H1), you get the extra confirmation points.

TOTAL: 100 points maximum. Every component is independent — no overlap, no double-counting.

SIGNAL LEVELS

70+ = GOOD — Trend is confirmed across most dimensions. Reliable entry opportunity. 85+ = EXCELLENT — Nearly all components align. Highest probability setup.

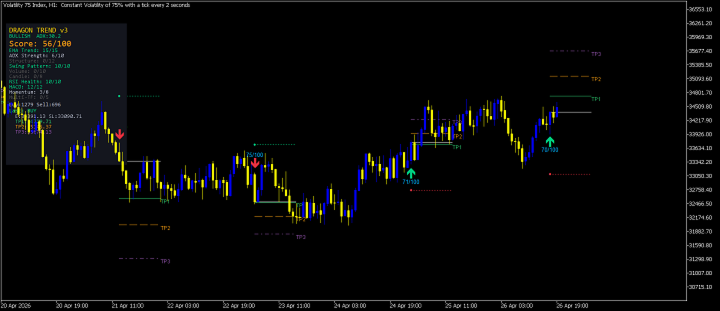
Each signal arrow shows its exact score (e.g. "82/100") so you can see precisely how strong the setup is. Gold labels = Excellent. Blue labels = Good.

Set your minimum threshold in settings: default is 70 (Good). Raise to 85 for fewer but higher-quality signals.

DINIPOLI FIBONACCI TP TARGETS

Every signal comes with three take-profit levels drawn directly on chart:

TP1 (green solid) — 1.0 Fibonacci extension. The conservative target for quick profit. TP2 (orange dashed) — 1.272 extension. The natural swing target. TP3 (purple dashdot) — 1.618 extension. The extended target for strong trends.

Strategy: Take 50% at TP1, move SL to breakeven, take 30% at TP2, let 20% run to TP3.

Stop-loss is placed automatically at the recent swing low (for buys) or swing high (for sells) with an ATR buffer.

100% NON-REPAINTING

All signals are calculated on closed bars only. Bar 0 is never processed. Once a signal arrow appears with its score, it stays exactly where it is — forever. What you see in the Strategy Tester is what you get live.

HOW TO USE IT

STEP 1 — Attach Dragon Trend System v3 to your chart (recommended: H1 or H4).

STEP 2 — The dashboard panel shows all 10 components updating in real time. Watch the total score build as the trend develops.

STEP 3 — When the score crosses 70+ (or 85+ if you set Excellent mode), a signal arrow appears with the score label and three TP levels.

STEP 4 — Enter at the close of the signal bar. SL is already marked. Manage your exit using the 3-tier TP system.

STEP 5 — Use the dashboard to monitor whether the trend is strengthening or weakening. If individual components start dropping (especially Structure and Momentum), consider tightening your stop.

THE DASHBOARD

The on-chart panel shows in real time:

  • Current trend direction and ADX value
  • Total score out of 100 with color coding
  • All 10 individual component scores (so you can see exactly what is contributing and what is holding the score back)
  • Signal count (total buys and sells)
  • Last signal details including entry, SL, TP1, TP2, and TP3 levels

This transparency is rare among trading indicators. Most just show "BUY" or "SELL" without explaining why. Dragon shows you the full reasoning behind every signal.

ONE INDICATOR, COMPLETE SYSTEM

Version 3 merges the old Dragon Trend Analyzer and Dragon Entry System into a single indicator file. No more running two indicators on two timeframes and relying on GlobalVariable communication. Everything runs from one chart, one file, one setup.

The multi-timeframe component reads the higher timeframe internally — you set your preferred HTF in settings (default: H4 when trading on H1).

SIGNAL COOLDOWN

Minimum 5 bars between signals in the same direction (configurable). This prevents signal clusters during strong momentum phases and keeps your chart clean.

INSTRUMENTS TESTED ON

  • Forex: EURUSD, GBPUSD, USDJPY, AUDUSD, and all major/minor/cross pairs
  • Gold: XAUUSD, XAGUSD
  • Indices: US30, NAS100, SPX500, GER40
  • Synthetic Indices: Step Index 200, Volatility 10-100, Range Break, Crash/Boom
  • Crypto: BTCUSD, ETHUSD (on supported brokers)

Default settings are optimized for Forex and Gold on H1. For synthetic indices, consider adjusting the ADX threshold and Volume multiplier.

FULL SETTINGS LIST

Core: Signal level (Good 70+ or Excellent 85+), cooldown bars, ATR period. EMA Trend: Fast and Slow EMA periods. ADX: Period and minimum threshold. Structure: Swing detection lookback. RSI: Period, overbought/oversold levels. MACD: Fast, slow, and signal periods. Volume: MA period and minimum multiplier. Multi-TF: Higher timeframe selection. DiNapoli TPs: TP1, TP2, TP3 extension ratios (fully adjustable). Stop Loss: ATR buffer fraction. Visual: Toggle dashboard, TP lines, score labels, alerts, push notifications. Panel position adjustable.

WHAT YOU GET

  • Dragon_Trend_System_v3.ex5 — single compiled indicator file
  • Works on unlimited demo and live accounts
  • Free updates for life
  • Direct developer support via MQL5 messages

PRICING

Launch price: $99 — increases after the first 20 purchases. Monthly rental available from $30/month — try it risk-free.

WHY 10 FACTORS?

Most trend indicators use 1-2 methods — an EMA cross or an RSI reading. They give you a direction but no confidence level. Is this a strong trend or a weak one about to reverse?

The Dragon scores every trade-relevant dimension independently. A score of 92/100 means almost everything aligns — EMA stack, ADX strength, market structure, swing pattern, volume, candle quality, RSI, MACD, momentum, and higher timeframe. A score of 71/100 means several components disagree — proceed with caution and smaller position size.

This is the difference between "the trend is up" and "the trend is up with 92% confidence across 10 independent measurements."

CHANGELOG

v3.0 (April 2026):

  • Complete rebuild as single self-contained indicator
  • Merged Trend Analyzer and Entry System into one file
  • Eliminated scoring overlap (old components 1, 2, 7 all measured EMA+ADX)
  • Added Volume Confirmation component (replaced overlapping Market Phase)
  • Added Multi-Timeframe component (replaced weak N-Bar Reversal)
  • Improved Candle Quality scoring (pin bars, engulfing, not just body %)
  • Improved Momentum scoring (ATR-normalized, not raw percentage)
  • Added DiNapoli TP1/TP2/TP3 on every signal
  • Added signal cooldown system
  • Added score labels on signal arrows
  • Dashboard now shows all 10 individual component scores

v2.0 (March 2026):

  • Added RSI and MACD components
  • ZigZag swing dots

v1.0 (February 2026):

  • Initial release (8-component scoring)

QUESTIONS?

Message me directly on MQL5 — I respond within 24 hours. Happy to help with settings, instrument optimization, or strategy questions.

推荐产品
指标MTF Qristalium箭头是一个半自动交易系统。 它适用于所有货币对。  该指标使用三条规则:1)我们只交易趋势,2)"当每个人都卖出卖出,当每个人都买入卖出",3)价格总是违背人群。  指标MTF使用内置指标在多个时间范围内使用Qristalium箭头过滤规则。 如果趋势与所选时间间隔匹配,则指标将显示一个进入市场的箭头。 然后你自己做决定。 买-绿箭,卖-红箭头。 在指标中,您可以更改批次,设置EA的交易时间和关闭时间。 您还可以更改工作时间段和时间筛选器。 有一个蜂鸣声。  建议的工作周期D1。 滤波器H1和H4。  设置: TF-工作期间(建议D1) CCI_Period CCI等级提升 CCI级别Dn CCI价格 SAR步骤 SAR最大值 TF Filter1-(推荐H1) TF Filter2-(推荐H4) 工作时间  声音使用 MaxBars 
Currency Strength Monitor is a professional multi-currency strength indicator for MetaTrader 5 that analyzes and displays the relative strength of 8 major currencies (USD, EUR, GBP, AUD, NZD, JPY, CHF, CAD) in real-time. The indicator calculates strength values by aggregating price movements across 28 currency pairs and normalizing them using ATR, providing traders with a clear visual representation of which currencies are strengthening or weakening. Key Features: Multi-Currency Analysis — Monit
介绍 Moving Average Multicurrency Scanner MT5,这是一款尖端指标,旨在通过监控多个货币对在不同时间框架下来增强您的交易体验。此工具非常适合依赖移动平均线来识别趋势并做出明智交易决策的交易者。 使用 Moving Average Multicurrency Scanner MT5,您可以轻松分析市场动态并及时接收信号,让您能够实时把握交易机会。想象一下,您可以通过无缝对接多个时间框架和货币对来定制您的交易策略。 MQL产品安装指南 | 在 MT4/MT5 上更新已购买的MQL产品 | 常见故障排除指南 | 指标设置 / 指南 主要特点 缓冲区集成:将指标值暴露为可访问的缓冲区,允许 Expert Advisor 使用基于信号的交易策略。 可视箭头信号:Plots 在信号蜡烛上直接在图表上清晰显示买入/卖出箭头,便于视觉阅读。 快速且可回测:基于 MetaTrader 的本地 OnCalculate() 引擎构建,确保快速计算并与策略测试器兼容进行历史回测。 弹出警报:在信号事件上生成 MetaTrader 弹出警报,确保您不会错过潜在的交易设置。
RSI / TDI 警報儀表板允許您一次監控您交易的每個主要貨幣對的 RSI(由您選擇)。 您可以通過兩種方式使用它: 1. 選擇多個時間框架,當有多個時間框架超出正常交易條件時,破折號會顯示給您。一個很好的指標,表明價格最近在推高,因為它在多個時間框架內達到了超買或超賣水平,因此很快就會出現回調或逆轉。 2. 使用一個時間框架(您最喜歡的交易)和多個 RSI 水平向您展示該時間框架內 RSI 擴展的強度。當價格在一個方向上非常強烈地推動太長時間並且市場應該出現獲利了結時,這是一種進行均值回歸交易的好策略。在示例屏幕截圖中,您可以看到 H4 RSI 在 25 水平之上擴展了 2 對,這比典型的價格行為要遠得多,因此是做多的好機會。 當蠟燭在所選時間範圍內收盤時,儀表板將提醒您選擇水平的擴展條件(超買和超賣)。您可以同時監控 6 個單獨的 RSI。您可以獨立選擇每個時間範圍、類型以及超買和超賣水平。 此處提供 MT4 版本: https://www.mql5.com/en/market/product/62698 您可以立即查看任何貨幣對的狀況,並選擇那些準備好回調或反轉
EMA MTF Plus v5.0 – Advanced Multi-Timeframe EMA Dashboard One Glance. Seven Timeframes. Complete Trend Analysis. EA-Ready. EMA MTF Plus v5.0   transforms your chart into a professional multi-timeframe command centre. No more switching between timeframes or guessing alignment. See every EMA direction PLUS trend health, distance metrics, streak analysis, and actionable insights – all on one ultra-clean, CPU-optimized display. What It Answers in Seconds Question How It Answers Is TimeFrame trend b
亲爱的外汇交易者, 我很高兴向您介绍GoldenCeres指标,这是我们过去一年交易旅程中的重要工具。我最亲密的朋友和我一直在使用这个指标成功地导航外汇市场,现在我们迫不及待地想与MQL5社区分享它。 GoldenCeres是一个直观且用户友好的指标,专为有一些外汇交易经验的交易者设计。它直接在图表上提供清晰的买入或卖出信号,简化决策过程,没有任何延迟。此外,它提供了一个推荐的TakeProfit水平,以图表上的小紫线表示。可以使用我们命名为“风险水平”的输入变量来自定义此推荐水平的准确性。 “风险水平”变量的范围从1到20。1的值表示保守策略,击中TakeProfit水平的概率很高,但奖励相对较小。10的值表明平衡的方法,有很好的机会击中TakeProfit水平并获得体面的奖励。20的值代表了一种激进的策略,击中TakeProfit水平的可能性较低,但潜在的奖励显著增大。 GoldenCeres专为XAUUSD 30分钟图表设计,尽管它可以应用于其他XAU图表。请注意,由于它针对30分钟的XAUUSD图表进行了优化,因此其在不同时间框架上的性能可能会有所不同。 我们致力于持续改进,
Mattrix Risk Meter A risk sentiment indicator that visualizes the Risk-On / Risk-Off sentiment in the Forex market by comparing two synthetic currency baskets. Designed for traders who want to understand the broader market mood beyond individual pair movements. WHAT IT SHOWS: The indicator plots two normalized lines in a separate window:   RON  (white line)  — Risk-On basket of 8 high-beta currency pairs   ROFF (red line)    — Risk-Off basket of 8 safe-haven pairs (inverted) When the lines mov
Apex Gold Chaser v1 is a premium, high-frequency algorithmic trading system engineered specifically for fast-moving, high-liquidity financial instruments like XAUUSD (Gold) and major currency pairs. Operating at the frontier of micro-trend exploitation, this EA is strictly optimized for the 1-Minute (M1) timeframe, where it captures rapid price expansions, velocity spikes, and immediate market structural shifts. Unlike traditional grid or passive cost-averaging systems that hold trades open fo
Smart Div Pro
Ignacio Agustin Mene Franco
Smart Div Pro v2.00 The most comprehensive and visual MACD divergence indicator on the market Smart Div Pro is an advanced MACD divergence indicator designed for traders seeking a clear technical edge by combining three powerful tools: MACD Divergences, Fibonacci Retracements, and a real-time Information Panel. Main Features: Automatic Divergence Detection Regular Divergences (bullish and bearish) Hidden Divergences (optional) Precise Pivot Detection using a robust algorithm with configurable
TitaniumTrend
Krzysztof Sitko
5 (1)
TitaniumTrend - Ultimate Multi-Timeframe Trend Analyzer TitaniumTrend is a next-generation indicator designed to provide traders with a definitive edge by analyzing market trends across 21 different timeframes simultaneously. Featuring a stunning, custom-built "Glass Reflection" visual layer and a highly accurate sentiment dashboard, this tool eliminates market noise and reveals the true directional bias of any asset. Key Features 21-Timeframe Analytics: The built-in dashboard continuously s
FREE
BW Indicators
Sergei Gurov
A tool for creating Bill Williams indicators Our tool provides the ability to set Bill Williams indicators on a chart with a mouse click. - The Awesome Oscillator (AO) indicator helps to assess the driving force of the trend. - Alligator indicator — determines the current state of the trend and possible entry and exit points. - Fractals indicator — helps to identify significant levels  - Accelerator Oscillator (AC) indicator — shows the change in trend acceleration. - Market Facilitation Index
FREE
通过 Pip Movement Alert MT5 领先市场动能,这是一款多币种指标,专为跟踪和提醒交易者多个符号的精确点数移动而设计,适用于外汇、股票、加密货币和商品交易。在 Forex Factory 和 Reddit 的 r/Forex 等交易社区中备受赞誉,并在 Investopedia 和 TradingView 的讨论中因其检测突发市场变化的能力而受到关注,该指标是希望利用快速价格变化的交易者的必备工具。用户报告称,识别基于点数的重大移动(例如,10点增量)的可靠性高达95%,许多人指出通过利用实时警报捕捉波动性激增,交易时机提高了20-30%。主要优势包括多币种监控、可定制的点数阈值以及轻量级设计,无需持续分析图表即可简化跟踪,非常适合剥头皮、日内交易和波段交易者。 Pip Movement Alert MT5 监控用户定义的符号(默认:EURUSD、GBPUSD、USDJPY、USDCHF),并在价格移动指定点数值(默认:10点)时触发警报,检测绝对价格水平(例如,1.178500、1.178600)。它使用实时计算来识别上升或下降移动,通过弹出窗口、推送通知和电子邮件
FREE
Gamma Volatility Levels
Carlos Pascual Perez Maturano
Gamma & Volatility Levels Pro [XAUUSD Edition] – The indicator used by professional gold traders in 2025 Fully automatic indicator developed exclusively for XAUUSD (Gold). Displays in real time the most powerful institutional levels that move gold price every single day: • HVL (High Volatility Level) – Orange dashed line Dynamic extreme volatility level (20-period SMA + 1 standard deviation). Gold bounces or breaks this level 87 % of sessions with moves of +$40 to +$120. • CALL RESISTANCE – Blue
VR Grid Mt5
Vladimir Pastushak
3.25 (8)
VR 网格指示器 设计 用于创建具有用户定义设置的图形网格。与 标准网格 不同,VR 网格用于构建 圆形关卡 。根据用户的选择,轮次级别之间的步长可以是任意的。此外,与其他指标和实用程序不同,即使时间段发生变化或终端重新启动,VR Grid 也能保持网格的位置 。 设置、设置文件、演示版本、说明、问题解决,可以从以下位置获取 [博客] 您可以在以下位置阅读或撰写评论 [关联] 版本为 [MetaTrader 4] 垂直级别 基于实际时间间隔并 忽略缺失 或不存在的周期。因此,级别之间的步长严格对应于用户选择的值。 使用 VR 网格指标时,交易者 可以更改任何级别的垂直线和水平线的样式 、颜色和粗细。这使您可以控制金融工具的 回合水平 。 整数位是 以两个或多个零结尾 的价格(例如:1.23500、5.65900、1923.200)。人们相信,这样的水平 经常充当 作为支撑或阻力的强点。 Horizontal line settings Horizontal line step Horizontal line color Horizontal line style Horizonta
FREE
Gdcr Ai Smart Trader
Mohamed Magdy Abdelrazek Ibrahim
Gdcr Ai Smart Trader Trade Smarter. Trade With Intelligence. Gdcr Ai Smart Trader is a next-generation Expert Advisor designed to deliver high-precision trading using a combination of Smart Money logic, Gann digital analysis, and AI-inspired decision systems . Unlike traditional robots that rely on lagging indicators, this EA evaluates market behavior in real time and executes trades based on high-probability conditions. Intelligent Trading Engine The EA uses an adaptive scoring system th
Blahtech Supply Demand MT5
Blahtech Limited
4.54 (13)
Was: $299  Now: $99  Supply Demand uses previous price action to identify potential imbalances between buyers and sellers. The key is to identify the better odds zones, not just the untouched ones. Blahtech Supply Demand indicator delivers functionality previously unavailable on any trading platform. This 4-in-1 indicator not only highlights the higher probability zones using a multi-criteria strength engine, but also combines it with multi-timeframe trend analysis, previously confirmed swings a
Swing Failure Hunter
Shingidzano Lesetedi
SFP Hunter — Swing Failure Pattern SFP Hunter is a MetaTrader 5 indicator that automatically detects Swing Failure Patterns (SFP) on any symbol and timeframe. The indicator identifies single-candle stop-hunt reversals where price wicks beyond a prior swing high or low and closes back inside on the same candle, signalling a potential reversal from that level. How the Pattern Works A Swing Failure Pattern occurs when price briefly breaches a prior swing high or swing low — triggering the stop orde
RFX5 Forex Strength Meter
Rasoul Mojtahedzadeh
5 (1)
RFX Forex Strength Meter is a powerful tool to trade 8 major currencies in the Forex market, U.S. Dollar ( USD ) European Euro ( EUR ) British Pound ( GBP ) Swiss Franc ( CHF ) Japanese Yen ( JPY ) Australian Dollar ( AUD ) Canadian Dollar ( CAD ) New Zealand Dollar ( NZD ) The indicator calculates the strength of each major currency using a unique and accurate formula starting at the beginning of each trading day of your broker. Any trading strategy in the Forex market can be greatly improved b
Overview TriParity AfterShock PRO Scanner 是一款用于 MetaTrader 5 的自主判断型仪表盘指标。在本说明中,triad 指三组货币对或三种交易品种之间的关系。Scanner 可在一个面板中查看多个 triad 和多个时间周期,并帮助交易者以更有条理的方式整理观察列表。其目的是减少图表过载、并排比较候选机会,并突出显示值得进一步关注的市场状态。 本产品并不执行三角套利。真正的三角套利需要几乎同时完成三条腿的执行、极低的延迟以及极低的交易成本。Scanner 旨在用于自主判断临时性偏离状态,这些偏离可能会在平价调整之后暂时保留下来。 Functions Scanner 会在多个时间周期上分析所选 triad,并通过 NOWCAST 显示当前状态。NOWCAST 会将形态评级为 A、B、C 或 NG。在这里,NG 表示当前状态并不适合。这些评级表示关注优先级,而不是最终的买入或卖出决定。最终确认应在 Catcher 或执行图表中进行。 7.0 版本为 MTF 单元格增加了更多信息。除评级外,面板还可以显示方向偏向、已接受信号标记、如 MR、T
Gold Venamax MT5
Sergei Linskii
3.5 (2)
Gold Venamax - 這是最好的股票技術指標。 此指標演算法分析資產的價格變動並反映波動性和潛在的進入區域。 指標特點: 這是一個帶有 Magic 和兩個趨勢箭頭塊的超級指標,可實現舒適且有利可圖的交易。 圖表上顯示用於切換方塊的紅色按鈕。 Magic 在指標設定中進行設置,以便您可以將指標安裝在顯示不同區塊的兩個圖表上。 Gold Venamax 可以放置在具有不同箭頭緩衝區(GV 和 SD)的兩個圖表上。 為此,您需要在設定中選擇不同的 Magic,例如,一個具有 Magic = 999,另一個具有 Magic = 666。接下來,您可以使用圖表上的紅色按鈕選擇箭頭緩衝區。 指標設定中的每個箭頭緩衝區(GV и SD)都有一個單獨的箭頭過濾器,以實現舒適且有利可圖的交易(UseFiltrGV = true; 和 UseFiltrSD = true;)。 進入的最佳訊號 = 遵循兩個緩衝區的訊號箭頭(GV 和 SD)+ 所有三個 MA 線(紅色或藍色)的方向 + TMA 通道邊界(下或上)。 TMA 通道邊界(下限或上限)也可用於鎖定利潤和/或以較短的停損位進行逆勢風險交
Momentum BigMove v8
Pamela Ese Ogono
Momentum BigMove v8 Overview Momentum BigMove v8 is a technical indicator designed to analyze price momentum and volatility. It is intended for use on liquid assets such as Gold (XAUUSD), major equity indices, and primary currency pairs. The tool utilizes an ATR-scaled sensitivity calculation combined with an EMA filter to identify periods of significant price movement. Core Features Momentum Analysis:   Identifies directional price changes based on user-defined sensitivity levels. Non-Repaint
Order Block FVG Box
Usiola Oluwadamilol Olagundoye
Next Arrival : Flip or Die Trading Arena. Flip a trading account:  https://flipordie.com/chapter-1-thirteen-doublings-double-a-trading-account/ The Order Block FVG Box indicator for MetaTrader 5 is a powerful tool designed for discerning traders looking to identify and capitalize on high-probability trading opportunities. This indicator excels at pinpointing valid Order Blocks that are immediately followed by Fair Value Gaps (FVG), enhancing your trading strategy with precise visual cues. Key Fe
FREE
Anan Smart Pro
Mohammed Anan
Anan Smart Flow Pro is a premium MT5 signal indicator designed for traders who prefer structured entries, clean visual execution zones, and confirmed closed-candle signals. The indicator combines smart trend-following logic with ATR-based dynamic TP/SL levels to provide professional BUY and SELL opportunities directly on the chart. Signals are confirmed only after candle close and do not repaint on closed candles. Main Features: • Non-repainting closed-candle signals • Smart BUY / SELL entr
该指标建立当前报价,可以与历史报价进行比较,并在此基础上进行价格走势预测。指示器有一个文本字段,用于快速导航到所需日期。 选项: 符号 - 选择指标将显示的符号; SymbolPeriod - 选择指标从中获取数据的时段; IndicatorColor - 指示器颜色; HorisontalShift - 由指标绘制的报价移动指定的柱数; Inverse - true 反转引号,false - 原始视图; ChartVerticalShiftStep - 图表垂直移动(键盘上的向上/向下箭头); 接下来是文本字段的设置,您可以在其中输入日期,您可以通过按“回车”立即跳转到该日期。 接下来是文本字段的设置,您可以在其中输入日期,您可以通过按“回车”立即跳转到该日期。
RQL Trend Board – Description RQL Trend Board is a simple but powerful multi-timeframe trend dashboard. It shows the current market bias across several timeframes at the same time, using an internal trend-classification method. Each timeframe is displayed as a colored box: Green – bullish bias → look for long setups Yellow – ranging / unclear → no trade zone Red – bearish bias → look for short setups The indicator gives a clear overall picture of where the market wants to go, instead o
FREE
Knowledge of the strength and weakness of each currency is vital for every forex trader. Our   Currency Strength Meter indicator   measures the strength of eight major currencies (USD, EUR, GBP, CHF, JPY, CAD, AUD, NZD) by using the Relative Strength Index indicator, also known as RSI. The Currency Strength Meter indicator shows you, simply and quickly, when a currency is oversold, overbought, or in "normal area". This way, you can identify which currency is the strongest and the weakest. Our
Volume flow Profile
Israr Hussain Shah
大师版是一款专业级的分析工具,旨在通过成交量和资金流向的视角来可视化市场结构。与标准的成交量指标不同,该工具直接在图表上显示每日成交量分布,让您准确看到价格发现发生的位置以及“聪明钱”的定位。 此大师版专为清晰度和速度而设计,具有独特的自动主题同步系统,加载后即刻美化您的图表布局。 主要特点: 真实资金流向计算: 超越标准的跳动量。启用“Use Money Flow”时,成交量按价格加权,揭示了特定价格水平的实际资金投入。 价值区域 (VA) 可视化: 自动计算价值区域(默认为成交量的70%)。 VA填充: 为价值区域背景着色,以便即时识别控制区域。 关键水平: 清晰标记控制点 (POC)、价值区域高点 (VAH) 和价值区域低点 (VAL)。 专业标记系统: 扫描概况结构以识别关键交易区域: HVN (高成交量节点): 接受和盘整区域(支撑/阻力)。 LVN (低成交量节点): 拒绝区域或“快速通过”区域。 所有标记均向右绘制延长线,便于监控。 Delta 背离(左侧直方图): 左侧直方图可视化每个级别的买卖压力对比。这有助于识别隐藏的背离——即价格可能上涨,但卖家在这些水平上激进打
Currency Strength Meter Heatmap Currency Strength Meter Heatmap is a real-time analysis tool that measures the relative strength of all eight major currencies and displays the results in two complementary formats: a color-coded heatmap matrix and a live strength line chart. Instead of watching individual pairs in isolation, traders can see at a glance which currencies are gaining momentum and which are losing it, across USD, EUR, GBP, JPY, AUD, NZD, CAD, and CHF simultaneously. The indicator cal
Quant Ladder Pro
VALU VENTURES LTD
Ladder Quant EA - Multi-Session Expert Advisor The Ladder Quant EA is an advanced Expert Advisor for MetaTrader 5, designed to optimize forex trading across major market sessions. It integrates multiple strategies, including breakout, reversal, and range-bound trading, into a robust system. Tailored for major currency pairs, it combines sophisticated risk management with customizable settings. Professional Multi-Session Forex Trading Robot Version:   1.06 - Enhanced Edition Category:   Expert A

FREE
Has rsi signal
Evgenii Savinov
HAS RSI Signal — 带有止损/止盈计算的专业趋势指标 HAS RSI Signal 是一款强大的交易工具,结合了经典指标与现代噪声过滤算法。该指标通过 Heiken Ashi Smoothed (HAS) 平滑蜡烛图和 RSI 震荡指标进行市场分析,在趋势反转或价格退出超买/超卖区域时,为交易者提供清晰的人场信号。 主要优势: 双重过滤: 使用 Heiken Ashi Smoothed 算法消除市场“噪音”,同时通过 RSI 确认动能强度。 自动计算点位: 指标不仅提供信号,还会根据当前市场波动率 (ATR) 自动计算 止损 (Stop Loss) 和 止盈 (Take Profit) 点位。 视觉直观: 信号以彩色蜡烛图的形式直接显示在主图表上,保持交易界面的整洁有序。 多维度通知: 内置终端弹窗警报、声音提示以及手机推送通知 (Push),确保您不会错过任何交易机会。 核心原理: 指标持续监控 RSI 的极端区域。当价格离开临界区且 HAS 算法确认方向转变时,即生成交易信号。ATR 参数允许止损和止盈根据市场当前的波动性进行动态调整。 核心参数设置: InpPeri
该产品的买家也购买
Neuro Poseidon MT5
Daria Rezueva
4.8 (54)
Neuro Poseidon is a new indicator by Daria Rezueva. It combines precise trading signals with adaptive TP/SL levels - creating best possible trades as a result! Message me and get  Neuro Poseidon Assistant  as a gift to automize your trading process! What makes it stand out? 1. Proven profitability on all assets and timeframes 2. Only confirmed BUY and SELL signals present on the chart 3. Adaptive TP & SL levels generated by the software for each trade 4. Easy to understand - suitable for al

Trend Sniper X
Sarvarbek Abduvoxobov
5 (6)
Trend Sniper X 是一款适用于 MetaTrader 5 的多时间周期趋势跟踪指标,帮助交易者以清晰、精确的方式识别趋势方向和潜在的反转点。 价格信息: 当前价格为促销价,随着未来更新和新功能的发布,价格可能会有所变动。 Code2Profit 频道 通过多时间框架分析掌握市场! 技术规格 平台 MetaTrader 5 指标类型 多时间周期趋势指标 运行时间周期 任何图表时间周期,可独立选择更高的时间周期 (M1–MN1) 主要交易品种 外汇、黄金 (XAUUSD) 及其他差价合约 (CFD) 推荐账户 任何账户类型 可视化 彩色趋势蜡烛 (买入/卖出/微弱/变化) + 买入/卖出箭头 附加模块 交易时段方框 (悉尼、东京、伦敦、纽约) 主要功能 多时间周期趋势分析: 直接在当前图表上投射更高时间周期的趋势方向,提供清晰的宏观视角。 弱势/不确定柱检测: 高亮显示趋势条件不明朗的柱线,让交易者避开震荡区域。 买入/卖出信号箭头: 在确认趋势变化后的柱线上自动绘制箭头,支持警报、推送和电子邮件通知。 一键开启/关闭面板: 图表上的按钮可切换指标,下拉菜单可立即切换分析时间周
M1 Quantum MT5
Hamed Dehgani
4.56 (9)
使用 M1 Quantum 的实盘交易信号 : 信号 (交易由 Quantum Trade Assistant 自动 执行,并作为本产品 免费 提供。) 价格计划: 当前价格: $169 (早期用户优惠) 下一阶段计划价格: $189 计划零售价: $299 开发者提示: 购买后请联系我,以获取 最新推荐的参数设置文件(Set File) 、交易建议,以及加入 VIP 支持群组 ,与其他 M1 Quantum 用户交流经验。 常见问题 - 设置文件 - 安装指南 M1 Quantum 是一款专业的 M1 交易系统,提供快速且精准的交易信号,并内置止损(Stop Loss)、止盈(Take Profit)以及智能资金管理功能。 M1 Quantum 包含专业的资金管理系统,通过专注于 连续盈利交易 ,帮助交易者更快地增长账户资金。 M1 Quantum 指标 的主要特点 专为 M1 时间周期 和所有 主要货币对 设计 所有交易均配备止损和止盈 内置 资金管理功能 ,并指导交易者轻松执行交易计划 高胜率,高比例的 连续盈利交易 无重绘,无延迟 适合各种类型的交易者,简单易懂 要使用 M
M1 Sniper MT5
Oleg Rodin
5 (4)
M1 SNIPER   是一款易于使用的交易指标系统。它是一个专为 M1 时间框架设计的箭头指标。该指标可以作为独立的系统在 M1 时间框架下进行剥头皮交易,也可以作为您现有交易系统的一部分使用。虽然该交易系统专为 M1 时间框架交易而设计,但它也可以用于其他时间框架。我最初设计此方法是为了交易 XAUUSD 和 BTCUSD。但我发现这种方法在其他市场交易中也同样有用。 指标信号既可以顺势交易,也可以逆势交易。我教授一种特殊的交易技巧,帮助您利用指标信号进行双向交易。该方法基于使用特殊的动态支撑位和阻力位区域。 购买后,您可以立即下载 M1 SNIPER 箭头指标。此外,我还为所有 M1 SNIPER 工具用户免费提供下方屏幕截图所示的 Apollo Dynamic SR 指标!这两个指标的组合可以帮助您更轻松、更准确地利用 M1 时间框架进行交易。 购买后请联系我,免费获取交易提示和奖励指标! 祝您交易成功!
Divergence Bomber
Ihor Otkydach
4.9 (92)
购买该指标的每位用户将额外免费获得以下内容: 原创工具“Bomber Utility”,该工具会自动跟踪每一笔交易,设置止损和止盈点,并根据策略规则自动平仓; 适用于不同交易品种的指标设置文件(Set 文件); 三种不同风险模式下的 Bomber Utility 设置文件:“最低风险”、“平衡风险” 和 “观望策略”; 一套详细的 视频操作手册,帮助您快速完成安装、配置并开始使用本交易系统。 注意: 要获取以上所有赠品,请通过 MQL5 的私人消息系统联系卖家。 我为您介绍原创的自定义指标 “Divergence Bomber”(背离轰炸机),它是一套基于 MACD 背离交易策略 的“全功能”交易系统。 该技术指标的主要任务是识别 价格与 MACD 指标之间的背离,并发出交易信号(包括推送通知),指示未来价格可能的运动方向。平均而言,这些信号的准确率超过 98%。有关该指标如何工作的详细说明,请观看本页面上的视频演示。 该系统使用 止损订单 和 动态回撤平仓机制 来管理交易。 Divergence Bomber 指标的主要特点: 支持交易的品种: AUDCAD、AUDCHF、AUDSG
ARIPoint
Temirlan Kdyrkhan
1 (1)
ARIPoint is a powerful trading companion designed to generate high-probability entry signals with dynamic TP/SL/DP levels based on volatility. Built-in performance tracking shows win/loss stats, PP1/PP2 hits, and success rates all updated live. Key Features: Buy/Sell signals with adaptive volatility bands Real-time TP/SL/DP levels based on ATR Built-in MA Filter with optional ATR/StdDev volatility Performance stats panel (Success, Profit/Loss, PP1/PP2) Alerts via popup, sound, push, or email Cu
货币强度向导是一个非常强大的指标,为您提供成功交易的一体化解决方案。该指标使用多个时间范围内所有货币的数据来计算这个或那个外汇对的力量。此数据以易于使用的货币指数和货币电力线的形式表示,您可以使用它们来查看这种或那种货币的力量。 您所需要的只是将指标附加到您要交易的图表上,该指标将向您显示您交易的货币的真实强度。该指标还向您显示买卖量压力的极值,您可以在顺势交易时利用这些压力。该指标还显示了基于斐波那契的可能目标。该指标可用于各种交易时间范围。该指标支持各种货币对的交易。   该指标为您提供所有类型的警报,包括推送通知。 购买后请联系我。我将与您分享我的交易技巧,并免费为您提供丰厚的红利指标! 祝您交易愉快,获利丰厚!
Quantum TrendPulse
Bogdan Ion Puscasu
5 (25)
介绍 Quantum TrendPulse   ,这是一款终极交易工具,它将 SuperTrend   、   RSI 和 Stochastic 的强大功能整合到一个综合指标中,以最大限度地发挥您的交易潜力。该指标专为追求精准和效率的交易者而设计,可帮助您自信地识别市场趋势、动量变化以及最佳进入和退出点。 主要特点: 超级趋势整合: 轻松跟随当前的市场趋势并乘上盈利浪潮。 RSI 精度: 检测超买和超卖水平,非常适合把握市场逆转时机,可用作 SuperTrend 的过滤器 随机精度: 利用随机振荡在波动的市场中寻找隐藏的机会, 用作超级趋势的过滤器 多时间范围分析: 从 M5 到 H1 或 H4,在不同时间范围内关注市场动态。 可定制的警报: 当您的自定义交易条件得到满足时收到通知,这样您就不会错过任何交易。 无论您是新手还是经验丰富的交易员,   Quantum TrendPulse 都能为您提供所需的优势,帮助您增强策略并自信地进行交易。借助这一强大的指标,将洞察力转化为利润 — 掌控您的交易! ***购买 Quantum TrendPulse,即可免费获得 Quantum Tr
Quant Direction MT5
Georgios Kalomoiropoulos
Quant Direction 是一款三维市场分析工具。它通过同时计算多个维度上的精确百分比偏差,提供完全客观的、基于算法的市场分析视角。该算法采用先进的人工智能建模工具开发,并经过全面测试,旨在以独特的精准度解读市场。它可以分析您平台上的任何货币对或金融工具。 无论您是短线 交易者、日内 交易者还是波段交易者,Quant Direction 都是您的理想之选。 交易者的真正优势 Quant Direction 的真正优势在于彻底消除情绪、屏幕疲劳和过度思考。它无需手动点击十几个图表来寻找方向并反复质疑自己的偏好,引擎即可在几毫秒内即时处理 8 个时间周期(从 5 个月到月线)。它能准确告诉你任何时刻谁在掌控市场,确保你始终朝着概率最高的方向进行交易。 市场分析的三个维度 该算法将市场分为三个不同的交易维度,为您提供完整的宏观和微观视角: 超短线交易分析: 捕捉即时、快速的动量变化和较低时间框架的执行点。 日内分析: 识别真实的、潜在的每日方向性偏差。 波动分析: 专注于宏观趋势,确保您不会与大盘机构的走势背道而驰。 独家评分引擎 Quant Direction 的底层采用了一套
UZFX {SSS} 超短线智能信号 v4.0 MT5 是一款无重绘的高性能交易指标,专为在快速波动的市场中需要精准、实时信号的超短线交易者、日内交易者和波段交易者设计。该指标由 (UZFX-LABS) 开发,融合了价格行为分析、趋势确认和智能过滤技术,可在所有货币对和时间周期内生成高概率的买卖信号、预警信号以及趋势延续机会。 别再对交易犹豫不决了,开始遵循这一专为追求清晰、精准和纪律性市场执行的交易者设计的结构化信号系统吧。 我的建议* 最佳时间周期:15分钟及以上。 {H1} 是我的最爱。而且效果令人惊叹……!! 更新后的主要功能 • 自动买入和卖出信号检测 • 先进的反转识别逻辑 • 潜在市场反转前的早期预警信号 • 趋势延续确认信号 • 内置风险管理功能,包含入场点、止损点、TP1、TP2和TP3水平 • 完全可自定义的风险回报比 • 实时警报、声音提醒和移动端推送通知 • 带交易建议的专业信息面板 • 适用于所有MT5交易品种和时间周期 • 界面简洁、轻量且用户友好 为什么交易者选择 UZFX SSS? 大多数交易者亏损的原因在于入场过晚、平仓过早,或者缺乏明确的交
Transaction Speed MT5
Ivan Stefanov
5 (4)
当然,以下是翻译成中文(简体)的版本: 该指标标出市场中显现出 交易兴趣 的区域,并随后显示 订单积累区域 。它的工作方式类似于大规模的订单簿。 这是为 大资金 打造的指标,性能卓越。市场中有任何兴趣,你都能通过它清晰看到。 (这是一个 完全重写的自动化版本 —— 不再需要手动分析。) 交易速度 是一个全新的概念指标,它显示了市场上大订单 何时 、 何地 聚集,并揭示了其背后的意义。它可以在 非常早期 就检测到趋势的变化。 在外汇市场,所谓的“交易量”实际上是误导性的,因为那指的是价格在单位时间内的变化,因此真正的名称应是“交易速度”。 一切都取决于我们如何思考、如何行动、如何分析。 改变分析范式至关重要。 该指标完全重构了外汇市场上“交易量”的概念,用逻辑方式重新定义并应用,从而成为一个 独特而精准的工具 。 使用方法: 默认情况下,指标处于 自动模式 ,可独立用于任何时间周期。如果你希望切换到手动模式,只需点击 Auto / Manual Mode 按钮即可。 在 手动模式 下,所有计算从 2025年1月1日 开始。你可以根据需要更改该日期,以查看不同的分析结果。 最优数据周期
介绍     Quantum Breakout PRO   ,突破性的 MQL5 指标,正在改变您交易突破区域的方式!由拥有超过13年交易经验的资深交易员团队开发,     量子突破 PRO     旨在通过其创新和动态的突破区域策略将您的交易之旅推向新的高度。 量子突破指标将为您提供带有 5 个利润目标区域的突破区域的信号箭头,以及基于突破框的止损建议。 它既适合新手交易者,也适合专业交易者。 量子 EA 通道:       点击这里 重要的!购买后请私信我领取安装手册。 建议: 时间范围:M15 货币对:GBPJPY、EURJPY、USDJPY、NZDUSD、XAUUSD 账户类型:ECN、Raw 或 Razor,点差极低 经纪商时间:GMT +3 经纪商:IC Markets、Pepperstone with Raw 和 Razor 的点差最低 规格: 不重漆! 最多 5 个建议利润目标区域 建议止损水平 可定制的盒子。您可以设置自己的 Box Time Start 和 Box Time End。 接触 如果您有任何疑问或需要帮助,请通过私人消息与我联系。
The Oracle Pro
Ottaviano De Cicco
5 (1)
The Oracle Pro:用于 MT5 的合成多周期偏向引擎 ️ 夏季上市优惠 — 早期买家可以 199 USD 获得 The Oracle Pro。价格将随关注度上升;最终价格 399 USD。 The Oracle Pro 是一款面向高要求与专业交易者的 MetaTrader 5 高级多周期 偏向引擎 。它以纪律回答一个问题:当前每个周期的方向偏向是什么、强度如何、各周期之间的一致程度如何?一切仅在已收盘的 K 线上计算——绝不重绘。 The Oracle Pro 是一套多因子共识系统。它将专有指标与优化算法整合为单一而精密的共识向量,并在单个指标实例内,跨当前周期与更高周期的堆栈进行读取——而不是在多个图表上堆叠互不相关的工具。 它是 Oracle 共识方法的专业进化版:完整重建为高级操作控制台,面向希望在一个纪律化工作流中获得深度、多周期背景与背离洞察的交易者。 是偏向引擎,而非信号生成器 The Oracle Pro 明确自身定位。它是一款提供纪律化方向背景的 多周期多因子偏向指标 。它 不是 信号生成器:不承诺入场、出场或盈利。偏向是背景——你在其方向上交易自己的设置
可以说,这是您可以为MetaTrader平台找到的最完整的谐波价格形成自动识别指标。它检测19种不同的模式,像您一样认真对待斐波那契投影,显示潜在的反转区域(PRZ),并找到合适的止损和获利水平。 [ 安装指南 | 更新指南 | 故障排除 | 常见问题 | 所有产品 ] 它检测19种不同的谐波价格形态 它绘制了主要,衍生和互补的斐波那契投影(PRZ) 它评估过去的价格走势并显示每个过去的形态 该指标分析其自身的质量和性能 它显示合适的止损和获利水平 它使用突破来表明合适的交易 它在图表上绘制所有样式比率 它实现了电子邮件/声音/视觉警报 受斯科特·M·卡尼(Scott M. Carney)的书的启发,该指标旨在满足最纯粹和最熟练的交易者的需求。但是,它采取了一种使交易更容易的方式:在向交易发出信号之前,它会等待Donchian朝正确方向突破,从而使交易信号非常可靠。 斐波那契投影与向量无关 它实现了电子邮件/声音/推送警报 它绘制了ABCD投影 重要提示: 为了符合 Scott M. Carney先生 的商标申诉,某些图案名称已重命名为不言自明的替代方式, Scott M.
Gem SIGNAL
Shengzu Zhong
5 (1)
GEM Signal Pro GEM Signal Pro 是一款適用於 MetaTrader 5 的趨勢跟隨指標,專為希望在圖表上獲得更清晰訊號、更有結構的交易設定,以及更實用風險管理的交易者而設計。 它不僅僅顯示一個簡單的箭頭,GEM Signal Pro 還能以更清晰、更易讀的方式呈現完整的交易思路。當條件確認完成後,指標可在圖表上顯示進場價、止損價與止盈目標,幫助交易者更有效率地評估交易設定。 運作方式 該指標首先根據其內部邏輯識別有效的初始訊號。 當確認條件滿足後,GEM Signal Pro 會在圖表上顯示完整的交易設定。這讓交易者可以更清楚地看到交易結構,並減少手動分析與計算的工作量。 圖表上的交易價位 對於已確認的訊號,GEM Signal Pro 可顯示: 進場價 止損價 止盈 1 止盈 2 止盈 3 風險報酬比 這讓交易設定更容易理解,也有助於讓圖表分析更有條理。 內建風險管理 風險管理是此指標設計的重要部分。 止損位基於近期市場結構,結合附近的擺動高低點與可選的 ATR 緩衝距離。這能讓交易價位更貼近當前市場條件,而不只是依賴固定距離。 圖表資訊面板 GEM Si
CISD Levels Pro automatically draws CISD Buy and Sell levels directly on your chart. It highlights pending levels while they are forming, then marks confirmed levels after the confirmation candle closes. Optional confirmation arrows help you spot the signal quickly. This tool is designed for traders who want clean, simple CISD level visualization without extra indicators or clutter. Key Features Draws Bullish (BUY) CISD levels and Bearish (SELL) CISD levels Shows Pending levels (dashed) and
PrimeScalping
Temirlan Kdyrkhan
PrimeScalping is a powerful trading companion designed to generate high-probability entry signals with dynamic TP/SL/DP levels based on volatility. Built-in performance tracking shows win/loss stats, PP1/PP2 hits, and success rates — all updated live. Key Features: Buy/Sell signals with adaptive volatility bands Real-time TP/SL/DP levels based on ATR Built-in MA Filter with optional ATR/StdDev volatility Performance stats panel (Success, Profit/Loss, PP1/PP2) Alerts via popup, sound, push, or e
Meta Trend PRO MT5
Roman Podpora
5 (1)
元趋势专业版     — 是一款趋势跟踪工具,它能消除交易中的猜测成分,并显示市场已经做出决定的位置。该指标能够识别趋势、趋势线和结构发生变化的关键点,并突出显示价格回升的区域,以便主要参与者进行建仓。 您不仅能看到价格走势,还能理解其背后的逻辑。所有信号均在K线收盘后记录,不会重绘,并保存在图表上,让您能够自信地分析形势并做出决策。交易目标(止盈)也会显示出来。 为了确保您对该指标的有效性完全有信心,我们为您提供自动统计数据。 每次方向改变后,该指标还会显示止损位及其智能渐进移动(Move SL),这至关重要。     减少   风险   按位置。 止损/止盈/风险回收 右侧内置面板显示当前全球趋势方向的市场入场点,并显示这些信号的历史数据。 任何时间范围/工具 该指标适用于所有时间间隔 -     从 M1 到 MN,也适用于所有仪器。 全球趋势统计 这有助于更好地理解。     最有利可图的机会究竟在哪里形成   以及如何根据真实的历史数据提取更多收入。 信号强度水平 并非所有反转信号都具有相同的强度,该指标充分考虑了这一点。这使您能够立即了解走势的强度并过滤掉微弱的信号。 SH
Azimuth Pro
Ottaviano De Cicco
5 (7)
Azimuth Pro V2:MT5合成分形结构分析与确认入场 概述 Azimuth Pro 是 Merkava Labs 推出的多层级波段结构指标。四层嵌套波段层级、锚定波段的VWAP、ABC形态识别、三时间框架结构过滤以及收盘确认入场——一个图表,一个从微观波段到宏观周期的完整工作流程。 这不是盲目的信号产品。它是一个以结构为先的工作流程,专为重视位置、背景和时机的交易者打造。 ️ 夏季促销 — 庆祝夏至与 The Oracle Pro 上市:Azimuth Pro 七折优惠,现价 279 美元(原价 399 美元)。限时夏季优惠。 1. V2的变化 合成多时间框架引擎 高时间框架分析从零开始重建,采用与Meridian Pro相同的专有合成架构。更清晰的HTF背景、稳定的实时行为、无经典MTF同步问题。合成引擎还解锁了 固定比率时间框架级联 (x2、x3、x4、x6)——不再在经纪商的固定时间框架之间任意跳转,您可以按图表时间框架的固定倍数分析结构,在每个尺度上保持相同的分形关系。 确认入场箭头 作为稳定且可恢复的执行层而设计的收盘确认箭头。当ABC设置形成且自适应确认逻辑
Btmm state engine pro
Garry James Goodchild
5 (4)
BTMM State Engine Pro is a MetaTrader 5 indicator for traders who use the Beat The Market Maker approach: Asian session context, kill zone timing, level progression, peak formation detection, and a multi-pair scanner from a single chart. It combines cycle state logic with a built-in scanner dashboard so you do not need the same tool on many charts at once. What it does Draws the Asian session range; session times can follow broker server offset or be set in inputs. Tracks level progression (L
Zain v4 With artificial intelligence
Haitham Gamal Abdelnaser Mohamed
### **Zain Gold V4 - AI-Powered Trading Dashboard** **Overview:** Zain Gold V4 is the ultimate evolution in our series of professional technical analysis indicators for the MetaTrader 5 platform. Engineered specifically to navigate the complexities of the XAUUSD (Gold) market and major currency pairs, this version introduces a sophisticated AI-powered dashboard. Our goal is to empower traders with precise, data-driven insights that translate market noise into clear, actionable trading opportun
Chimera Volume
Marko Milenkovic
适用于 MetaTrader 5 的 Chimera Volume 高级成交量分析与市场活跃度可视化 Chimera Volume 是一款为 MetaTrader 5 设计的自定义指标,旨在通过动态视觉框架分析标准化成交量活跃度,并展示市场参与度的变化。 该指标利用自适应标准化算法处理 Tick 成交量数据,生成关于成交量强度、累积阶段以及不同市场条件下活跃度变化的结构化表达。 与显示原始成交量数值的标准成交量指标不同,Chimera Volume 应用了额外的计算方法,以突出市场活动的相对变化并提高图表的可读性。 主要功能 根意图直方图 (Root Intent Histogram): 一种动态直方图,用于可视化标准化成交量强度和市场参与度。该直方图使用自适应颜色过渡,以区分活跃度增加时期与参与度减弱时期。 惯性线 (Inertia Line): 一条由标准化成交量计算得出的平滑分析线。旨在帮助交易者观察成交量动能的变化,并监控扩张期与收缩期之间的转换。 信号线 (Signal Line): 一个用于比较短期和长期成交量表现的次级计算层,在评估市场状况时可作为辅助参考。 自适应成交量
A2SR MT5 版 指标:自动化实际供需 (S/R)。 + 交易工具。 Product description in English here. --   Guidance   : -- at   https://www.mql5.com/en/blogs/post/734748/page4#comment_16532516 -- and  https://www.mql5.com/en/users/yohana/blog 强大、真实、省时,助您做出更明智的交易决策。 + 兼容 EA 的对象。 主要优势 领先的实际 SR 水平(不滞后,不重绘) 自 2014 年以来,A2SR 在 MT4 平台上经过多年的可靠性验证 ,现已面向 MetaTrader 5 平台推出。 它凭借领先的、不重绘的指标,为交易者带来卓越的优势,帮助他们在价格触及支撑位和阻力位之前识别实际支撑位和阻力位。 A2SR 提前计算支撑位和阻力位——在价格触及支撑位和阻力位之前——让交易者能够自信地规划交易。 独一无二、真正意义上的理念。 A2SR 建立在一种从未在任何媒体上发布或分享过的独特方法之上, 重
Trend Forecaster
Alexey Minkov
5 (8)
Trend Forecaster 是一款 MetaTrader 5 指标,可将突破信号、潜在反转区域分析、市场波动区间数据和可视化统计面板整合到同一个图表工作区中。 它可以显示 Buy 和 Sell 信号,跟踪 Average Range 和 Current Range,并且可以根据当前交易品种和时间周期自动调整 Sensitivity。也支持手动设置 Sensitivity。 该指标可用于外汇货币对、金属、股票、指数和加密货币。支持不同时间周期,M5 可以作为一个实用的起点。 主要功能 突破和反转区域分析 Trend Forecaster 会分析已识别区域附近的价格行为,并在内部突破条件满足时显示 Buy 或 Sell 信号。该指标可用于研究趋势延续和潜在反转区域。 多过滤器信号逻辑 该指标将多个内部过滤器整合为一个简单的工作流程。用户在开始分析前不需要配置大量技术参数。 Auto-Tune Sensitivity 该指标可以根据近期历史数据,自动为当前交易品种和时间周期计算 Sensitivity。这有助于在切换不同交易品种时减少手动设置。 手动设置模式 如果你更喜欢固定设置,或
KURAMA GOLD SIGNAL PRO(MT5)— 7层过滤 · 自动止盈止损 · 质量评分 · 信号历史保存 | 完整的XAUUSD交易系统 实时不重绘。信号出现的瞬间,箭头、入场、止盈、止损当场锁定,之后绝不移动。你交易的就是这个实时信号。而且在v7.20中,每一个真正发出的信号都会自动保存,并在重启后精确还原。 购买者专属赠品 购买永久授权,即可免费获得 AI Zone Radar(价值$59)+ 完整PDF手册。在产品价格之外,额外附赠价值$59的赠品。购买后在MQL5上给我留言即可。 AI Zone Radar: https://www.mql5.com/en/market/product/175834 在黄金交易者社区中被实际使用,因精度与易用性而广受好评。 你的难题 —— 以及解决方案 黄金一天波动$30–$50。你知道机会就在那里。但这些情况是否似曾相识: - 入场太早,价格逆行$10后才朝你的方向
Meravith Scanner
Ivan Stefanov
5 (2)
MERAVITH SCANNER 是一款适用于 MetaTrader 5 的专业金融市场指标,将多种分析工具整合为一个统一的系统。它基于专有的成交量加权平均价格(VWAP)方法自动完成所有计算,完全消除主观判断。 该指标适用于所有资产类别(外汇、股票、指数、大宗商品、加密货币)以及从 M1 到 Monthly 的所有时间周期。其核心原理是价格跟随成交量。MERAVITH 识别机构资金成交量的集中区域,并从该集中区域中推导出数学上精确的价格水平。它不预测,不推测。它只计算。 使用 MERAVITH SCANNER,您可以在 2–3 分钟内扫描全部 28 个主要外汇货币对的所有时间周期。您也可以扫描任何您选择的市场——例如,大约 100 只股票约需 10 分钟。 该指标计算耗尽水平、平衡线、偏差、统计水平以及目标投射。 图表元素 Origin Point 标记所有计算的起始位置。指标会自动将其放置在最佳位置。红色标签(TOP)表示市场高点并带有看跌倾向。绿色标签(BOTTOM)表示市场低点并带有看涨倾向。 Sentiment Line 是一条动态曲线,反映基于成交量加权计算得出的市场情绪。
ACB Breakout Arrows MT5
KEENBASE SOFTWARE SOLUTIONS
3.5 (2)
ACB Breakout Arrows 指标通过检测特殊的突破形态,提供市场中的关键入场信号。该指标持续扫描图表中的价格动量,在价格出现重大变动前,提前提供精确的入场信号。 点击此处获取多品种多周期扫描器 - ACB Breakout Arrows MT5 扫描器 主要特点 指标自动提供止损和止盈价格。 内置多周期扫描仪仪表盘,可追踪所有时间周期的突破信号。 适用于日内交易者、波段交易者和剥头皮交易者。 优化算法提升信号精度。 特别设置的快速盈利线用于无亏损移动或短线目标。 支持胜率、盈亏比、平均利润等绩效分析指标。 无重绘,信号可靠。 交易确认 - 可使用 ACB Trade Filter 指标 来过滤低概率的交易信号。 强烈买入: 向上箭头 + 绿色柱状图 + 多头趋势。 强烈卖出: 向下箭头 + 红色柱状图 + 空头趋势。 当柱状图为灰色且趋势为震荡时,应避免交易。 (可选) -  使用  KT 支撑阻力水平指标  避免在重要支撑/阻力位附近入场。这类交易可能迅速变成亏损。 “一个成功交易者的目标是做出最好的交易。金钱只是附属。” —— 亚历山大·埃尔德 输入参数 历史
Advanced Supply Demand MT5
Bernhard Schweigert
4.53 (15)
任何新手或专业交易者的最佳解决方案! 该指标是一款独特、高质量、且价格合理的交易工具,因为我们已经整合了许多专有功能和新公式。 依据此更新,您将能够显示双重时间帧区域。 您不仅可以显示一个较高的时间帧,还可以同时显示图表时间帧,加上更高的时间帧:显示嵌套时区。 供需双方所有交易者都会喜欢它。 :) 重要信息披露 高级供需的最大潜力,请访问 https://www.mql5.com/zh/blogs/post/720245   想象您的交易如何得以改善,是因为您能够精准定位入场或目标位吗? 构建于新的底层算法,它可以更轻松地识别出买卖双方之间的潜在失衡。 这是因为它以图形方式展示供需最强劲区域,及其过去的表现(显示旧区域)。 这些功能旨在帮助您更轻松地发现最佳入场区域和价位。 现在您可以针对您的交易品种和时间帧来优化和编辑区域强度! 高级供需指标适用于所有产品和时间帧。 它是一个新的公式,非常新的功能是两个区域强度函数可由用户输入进行调整! 这在交易中是一大优势。 当您学习如何使用专有功能,例如带有价格游离最小 X 因子的区域强度时,您能够判断该区域强劲与否。 供需区域用作警报触发器。
Quantum Spike Indicator
Lorenzo Edward Beukes
Quantum Spike Indicator is an indicator for MetaTrader 5 that identifies market spikes, reversal zones, and momentum-based entry points, combined with a trend filter. It analyzes momentum, trend strength, volatility, and SuperTrend conditions together, and displays BUY and SELL signals directly on the chart. Symbols Weltrade: Pain and Gain Indices Deriv: Boom and Crash Indices Main Features Spike Detection Identifies market moves and potential reversal zones based on momentum and volatility
Berma Bands
Muhammad Elbermawi
5 (10)
Berma 波段 (BBs) 指标对于寻求识别和利用市场趋势的交易者来说是一种有价值的工具。通过分析价格与 BBs 之间的关系,交易者可以辨别市场是处于趋势阶段还是区间波动阶段。 访问[ Berma Home Blog ] 了解更多信息。 Berma 带由三条不同的线组成:上 Berma 带、中 Berma 带和下 Berma 带。这些线围绕价格绘制,直观地表示价格相对于整体趋势的变动。这些带之间的距离可以洞察波动性和潜在的趋势逆转。 当 Berma Bands 线相互分离时,通常表明市场正在进入横盘或区间波动时期。这表明缺乏明确的方向性。交易者可能会发现在这些时期内很难识别趋势,因此可能需要等待更清晰的趋势出现。 当 Berma Bands 线汇聚成一条线时,通常表示趋势环境强劲。这种汇聚表明存在明显的方向性偏差,因为价格波动性足以随趋势而变化。交易者可能会发现在这些时期更容易识别潜在的入场点和出场点,因为趋势的势头可以提供有利的交易机会。然而,重要的是要注意整体趋势中的潜在回调或修正。 Berma 带根据价格蜡烛图与上带和下带的相互作用提供明确的买入和卖出信号。当价格蜡烛图首
作者的更多信息
DESCRIPTION: Position Size Calculator — On-Chart Risk Management Tool Never risk too much on a single trade again. This calculator displays real-time position sizing for 3 risk levels simultaneously, calculated from your live account balance and current ATR-based stop loss distance. DISPLAYS 3 RISK SCENARIOS AT ONCE: Risk Level 1 (1%): Risk amount in dollars + Lot size Risk Level 2 (2%): Risk amount in dollars + Lot size Risk Level 3 (3%): Risk amount in dollars + Lot size All lot sizes are dyna
FREE
Market Pulse Scanner
Olurotimi Olugbenga Awolade
Market Pulse Scanner v2 — 6-Factor Market Analysis Dashboard Before you take a trade, you need to know: Is there a trend? How strong is it? Is the market structure supporting it? Is volume confirming? Is volatility right for trading? The Market Pulse Scanner answers all of these questions in a single on-chart dashboard. Six independent analysis components score the market from 0 to 6. Strong signals only fire when most components agree. THE 6 COMPONENTS TREND DIRECTION EMA stack (20/50) with AD
DiNapoli Target Oscillator
Olurotimi Olugbenga Awolade
DiNapoli Target Oscillator v2 — See Where Price Sits Inside the Fibonacci Structure Most oscillators show you overbought or oversold. This one shows you exactly where price sits between the last swing low (0) and swing high (100) — mapped to the Fibonacci levels that institutional traders use for entries and exits. When the oscillator reads 38.2, price is at the golden pullback zone. When it reads 61.8, price has reached the first take-profit extension. At 100, it has fully retraced the swing. Y
Precision Reversal Engine
Olurotimi Olugbenga Awolade
Precision Reversal Engine v2 — Multi-Confluence Reversal Detection with 3-Tier Take Profit Reversals are the highest-reward trades in the market — but only if you enter at the right time and exit at the right level. The Precision Reversal Engine v2 combines five independent detection modules, an ADX trend filter, and a 3-tier Fibonacci TP system to give you the clearest, most actionable reversal signals available on MetaTrader 5. Version 2.0 is a major upgrade — smarter signal filtering, dramat
筛选:
无评论
回复评论