Dragon Trend System v3

Dragon Trend System v3 — 10-Factor Trend Scoring with Built-In Entry Signals

Stop relying on a single indicator to judge the trend. The Dragon Trend System scores 10 independent market dimensions and only generates entry signals when the combined score crosses your chosen threshold. Every signal includes DiNapoli Fibonacci TP targets and automatic SL placement.

Version 3 is a complete rebuild — one self-contained indicator replaces the old two-indicator setup. No more running separate Trend and Entry files. Everything runs from a single chart.

THE 10 SCORING COMPONENTS

Each component measures a different dimension of the market. No two components use the same data source — every point in the score is earned independently.

  1. EMA TREND (max 15 pts) Fast EMA vs Slow EMA position plus price location relative to the EMAs. Full points when price is above both EMAs in a bullish stack, partial when EMAs are aligned but price hasn't confirmed.
  2. ADX STRENGTH (max 10 pts) How strong the trend is — tiered from 2 pts (ADX 20) up to 10 pts (ADX 50+). Weak trends get low scores regardless of direction.
  3. MARKET STRUCTURE (max 12 pts) Break of structure — price closing beyond a recent swing high or swing low. This confirms the trend is making progress, not just oscillating.
  4. SWING PATTERN (max 10 pts) Higher highs and higher lows in an uptrend, lower highs and lower lows in a downtrend. The classic trend confirmation that most traders check manually — automated here.
  5. VOLUME CONFIRMATION (max 10 pts) Directional volume — a high-volume bullish candle in an uptrend scores full points. A high-volume bar against the trend scores nothing. Volume must support the move.
  6. CANDLE QUALITY (max 8 pts) Pin bars, engulfing patterns, and strong directional bodies — properly detected with ATR-normalized sizing. Not just body percentage like basic candle indicators.
  7. RSI HEALTH (max 10 pts) RSI in the healthy zone for the trend direction. Includes a penalty system: overbought in an uptrend or oversold in a downtrend subtracts points, preventing entries at exhaustion points.
  8. MACD ALIGNMENT (max 12 pts) MACD position relative to signal line and zero line, plus direction. Strong bull = above signal, above zero, and rising. Tiered scoring rewards stronger alignment.
  9. MOMENTUM (max 8 pts) ATR-normalized rate of change over 5 bars. Not a raw percentage — normalized by volatility so the score means the same thing on EURUSD as it does on Volatility 75.
  10. MULTI-TIMEFRAME (max 5 pts) Higher timeframe EMA alignment confirms the trend on a larger scale. When H1 and H4 agree (or M15 and H1), you get the extra confirmation points.

TOTAL: 100 points maximum. Every component is independent — no overlap, no double-counting.

SIGNAL LEVELS

70+ = GOOD — Trend is confirmed across most dimensions. Reliable entry opportunity. 85+ = EXCELLENT — Nearly all components align. Highest probability setup.

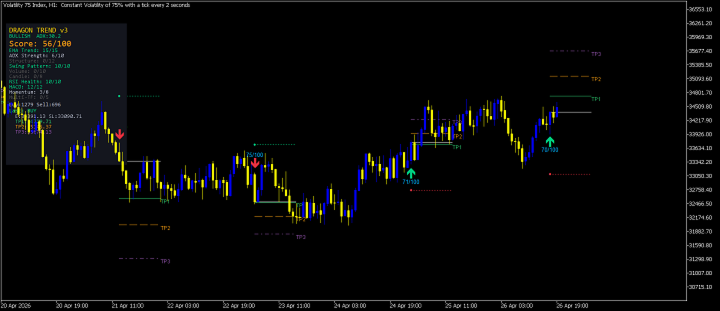
Each signal arrow shows its exact score (e.g. "82/100") so you can see precisely how strong the setup is. Gold labels = Excellent. Blue labels = Good.

Set your minimum threshold in settings: default is 70 (Good). Raise to 85 for fewer but higher-quality signals.

DINIPOLI FIBONACCI TP TARGETS

Every signal comes with three take-profit levels drawn directly on chart:

TP1 (green solid) — 1.0 Fibonacci extension. The conservative target for quick profit. TP2 (orange dashed) — 1.272 extension. The natural swing target. TP3 (purple dashdot) — 1.618 extension. The extended target for strong trends.

Strategy: Take 50% at TP1, move SL to breakeven, take 30% at TP2, let 20% run to TP3.

Stop-loss is placed automatically at the recent swing low (for buys) or swing high (for sells) with an ATR buffer.

100% NON-REPAINTING

All signals are calculated on closed bars only. Bar 0 is never processed. Once a signal arrow appears with its score, it stays exactly where it is — forever. What you see in the Strategy Tester is what you get live.

HOW TO USE IT

STEP 1 — Attach Dragon Trend System v3 to your chart (recommended: H1 or H4).

STEP 2 — The dashboard panel shows all 10 components updating in real time. Watch the total score build as the trend develops.

STEP 3 — When the score crosses 70+ (or 85+ if you set Excellent mode), a signal arrow appears with the score label and three TP levels.

STEP 4 — Enter at the close of the signal bar. SL is already marked. Manage your exit using the 3-tier TP system.

STEP 5 — Use the dashboard to monitor whether the trend is strengthening or weakening. If individual components start dropping (especially Structure and Momentum), consider tightening your stop.

THE DASHBOARD

The on-chart panel shows in real time:

  • Current trend direction and ADX value
  • Total score out of 100 with color coding
  • All 10 individual component scores (so you can see exactly what is contributing and what is holding the score back)
  • Signal count (total buys and sells)
  • Last signal details including entry, SL, TP1, TP2, and TP3 levels

This transparency is rare among trading indicators. Most just show "BUY" or "SELL" without explaining why. Dragon shows you the full reasoning behind every signal.

ONE INDICATOR, COMPLETE SYSTEM

Version 3 merges the old Dragon Trend Analyzer and Dragon Entry System into a single indicator file. No more running two indicators on two timeframes and relying on GlobalVariable communication. Everything runs from one chart, one file, one setup.

The multi-timeframe component reads the higher timeframe internally — you set your preferred HTF in settings (default: H4 when trading on H1).

SIGNAL COOLDOWN

Minimum 5 bars between signals in the same direction (configurable). This prevents signal clusters during strong momentum phases and keeps your chart clean.

INSTRUMENTS TESTED ON

  • Forex: EURUSD, GBPUSD, USDJPY, AUDUSD, and all major/minor/cross pairs
  • Gold: XAUUSD, XAGUSD
  • Indices: US30, NAS100, SPX500, GER40
  • Synthetic Indices: Step Index 200, Volatility 10-100, Range Break, Crash/Boom
  • Crypto: BTCUSD, ETHUSD (on supported brokers)

Default settings are optimized for Forex and Gold on H1. For synthetic indices, consider adjusting the ADX threshold and Volume multiplier.

FULL SETTINGS LIST

Core: Signal level (Good 70+ or Excellent 85+), cooldown bars, ATR period. EMA Trend: Fast and Slow EMA periods. ADX: Period and minimum threshold. Structure: Swing detection lookback. RSI: Period, overbought/oversold levels. MACD: Fast, slow, and signal periods. Volume: MA period and minimum multiplier. Multi-TF: Higher timeframe selection. DiNapoli TPs: TP1, TP2, TP3 extension ratios (fully adjustable). Stop Loss: ATR buffer fraction. Visual: Toggle dashboard, TP lines, score labels, alerts, push notifications. Panel position adjustable.

WHAT YOU GET

  • Dragon_Trend_System_v3.ex5 — single compiled indicator file
  • Works on unlimited demo and live accounts
  • Free updates for life
  • Direct developer support via MQL5 messages

PRICING

Launch price: $99 — increases after the first 20 purchases. Monthly rental available from $30/month — try it risk-free.

WHY 10 FACTORS?

Most trend indicators use 1-2 methods — an EMA cross or an RSI reading. They give you a direction but no confidence level. Is this a strong trend or a weak one about to reverse?

The Dragon scores every trade-relevant dimension independently. A score of 92/100 means almost everything aligns — EMA stack, ADX strength, market structure, swing pattern, volume, candle quality, RSI, MACD, momentum, and higher timeframe. A score of 71/100 means several components disagree — proceed with caution and smaller position size.

This is the difference between "the trend is up" and "the trend is up with 92% confidence across 10 independent measurements."

CHANGELOG

v3.0 (April 2026):

  • Complete rebuild as single self-contained indicator
  • Merged Trend Analyzer and Entry System into one file
  • Eliminated scoring overlap (old components 1, 2, 7 all measured EMA+ADX)
  • Added Volume Confirmation component (replaced overlapping Market Phase)
  • Added Multi-Timeframe component (replaced weak N-Bar Reversal)
  • Improved Candle Quality scoring (pin bars, engulfing, not just body %)
  • Improved Momentum scoring (ATR-normalized, not raw percentage)
  • Added DiNapoli TP1/TP2/TP3 on every signal
  • Added signal cooldown system
  • Added score labels on signal arrows
  • Dashboard now shows all 10 individual component scores

v2.0 (March 2026):

  • Added RSI and MACD components
  • ZigZag swing dots

v1.0 (February 2026):

  • Initial release (8-component scoring)

QUESTIONS?

Message me directly on MQL5 — I respond within 24 hours. Happy to help with settings, instrument optimization, or strategy questions.


추천 제품
Indicator MTF Qristalium Arrows is a semi - automatic trading system. It works on all currency pairs.  The indicator uses three rules: 1) we trade only on the trend, 2)"buy when everyone sells and sell when everyone buys", 3) the Price always goes against the crowd.  Indicator MTF Arrows Qristalium filter rules across multiple time frames using the built-in indicators. If the trend matches on the selected time intervals, the indicator will give an arrow to enter the market. Then you make you
Currency Strength Monitor is a professional multi-currency strength indicator for MetaTrader 5 that analyzes and displays the relative strength of 8 major currencies (USD, EUR, GBP, AUD, NZD, JPY, CHF, CAD) in real-time. The indicator calculates strength values by aggregating price movements across 28 currency pairs and normalizing them using ATR, providing traders with a clear visual representation of which currencies are strengthening or weakening. Key Features: Multi-Currency Analysis — Monit
Moving Average Multicurrency Scanner MT5을 소개합니다. 이 최첨단 지표는 다양한 시간대에서 여러 통화 쌍을 모니터링하여 거래 경험을 향상시키도록 설계되었습니다. 이 도구는 이동 평균을 사용하여 추세를 식별하고 정보에 기반한 거래 결정을 내리는 트레이더에게 이상적입니다. Moving Average Multicurrency Scanner MT5을 사용하면 시장 움직임을 손쉽게 분석하고 적시에 신호를 받아 실시간으로 거래 기회를 활용할 수 있습니다. 여러 시간대와 통화 쌍을 원활하게 조정하여 거래 전략을 사용자 정의할 수 있는 능력을 상상해 보세요. MQL 제품 설치 가이드 | MT4/MT5에서 구매한 MQL 제품 업데이트 | 일반 문제 해결 가이드 | 지표 설정 / 가이드 주요 기능 버퍼 통합: 신호 기반 거래 전략을 활용할 수 있도록 지표 값을 접근 가능한 버퍼로 노출합니다. 시각적 화살표 신호: 신호 캔들에서 차트에 직접 Plots 명확한 매수/매도
RSI / TDI 알림 대시보드를 사용하면 거래하는 모든 주요 쌍에서 RSI를 한 번에(귀하가 선택 가능) 모니터링할 수 있습니다. 두 가지 방법으로 사용할 수 있습니다. 1. 여러 시간 프레임을 선택하면 일반적인 거래 조건을 넘어 확장된 여러 시간 프레임이 있을 때 대시가 표시됩니다. 가격이 여러 기간에 걸쳐 과매수 또는 과매도 수준에 도달하여 최근에 가격이 크게 밀리고 있으므로 곧 철회 또는 반전이 예정되어 있음을 나타내는 훌륭한 지표입니다. 2. 하나의 기간(당신이 가장 선호하는 거래)과 여러 RSI 수준을 사용하여 해당 기간에 RSI 확장의 강도를 보여줍니다. 이것은 가격이 너무 오랫동안 한 방향으로 매우 세게 밀렸고 시장이 차익실현을 해야 할 때 평균 회귀 거래를 취하기 위한 훌륭한 전략입니다. 예시 스크린샷에서 H4 RSI가 25레벨을 넘어 2쌍으로 확장된 것을 볼 수 있습니다. 이는 일반적인 가격 조치보다 훨씬 더 멀리 있기 때문에 매수할 좋은 기회입니다. 대
CCI Fixed Dual
Edoardo Centorame
CCI FIXED DUAL이란 무엇인가 CCI FIXED DUAL은 전문적인 Trend Direction Filter로서, 다음 요소를 정확하게 식별하도록 설계되었습니다. 시장의 지배적인 방향 움직임의 구조적 품질 주요 추세와 가속 구간 사이의 일관성 이것은 직접적인 진입 지표가 아닙니다. 이것은 전통적인 오실레이터가 아닙니다. 이것은 컨텍스트 도구로서, 트레이더가 언제 거래해야 하고 언제 거래하지 말아야 하는지를 결정하도록 돕기 위해 설계되었으며, 시장의 노이즈와 해석 오류를 크게 줄여줍니다. CCI FIXED DUAL의 기본 철학 CCI FIXED DUAL이 기반으로 하는 원칙은 단순하지만 강력합니다. 신호는 시장 구조와 일치할 때만 가치가 있습니다. 이러한 이유로 이 지표는 단일 값을 사용하지 않습니다 가격에 충동적으로 반응하지 않습니다 억지 반전 지점을 찾지 않습니다 대신 다음 요소를 기반으로 계층적인 추세 해석을 구축합니다. Typical Price 기반 CCI 서로 다른
친애하는 외환 트레이더 여러분, 저는 지난 1년 동안 우리의 거래 여정에서 중요한 역할을 한 GoldenCeres 인디케이터를 소개하게 되어 기쁩니다. 제 가장 친한 친구와 저는 이 인디케이터를 사용하여 외환 시장을 성공적으로 탐색해 왔으며, 이제 MQL5 커뮤니티와 공유하고자 합니다. GoldenCeres는 외환 거래에 다소 경험이 있는 트레이더를 위해 설계된 직관적이고 사용자 친화적인 인디케이터입니다. 이는 차트에 직접적으로 명확한 매수 또는 매도 신호를 제공하여 의사결정 과정을 단순화하며, 지연 없이 작동합니다. 또한, 차트에 작은 보라색 선으로 표시된 권장 TakeProfit 레벨을 제공합니다. 이 권장 레벨의 정확성은 'Risk Level’이라고 이름 붙인 입력 변수를 사용하여 사용자 정의할 수 있습니다. ‘Risk Level’ 변수는 1에서 20의 범위입니다. 값이 1인 경우, TakeProfit 레벨을 높은 확률로 달성하지만 상대적으로 작은 보상을 나타내는 보수적 전략을
Smart Div Pro
Ignacio Agustin Mene Franco
Smart Div Pro v2.00 The most comprehensive and visual MACD divergence indicator on the market Smart Div Pro is an advanced MACD divergence indicator designed for traders seeking a clear technical edge by combining three powerful tools: MACD Divergences, Fibonacci Retracements, and a real-time Information Panel. Main Features: Automatic Divergence Detection Regular Divergences (bullish and bearish) Hidden Divergences (optional) Precise Pivot Detection using a robust algorithm with configurable
Hi Traders, I coded a free analysis tool for you to use for your trading accounts, because there is nothing more important than tracking and understanding results.  Trade Statistics Dashboard Pro is a real-time on-chart performance analytics panel that gives you instant visibility into your trading results. Built with an institutional-grade dark interface, it displays every critical metric a serious trader needs — without leaving the chart. Whether you are running Expert Advisors, trading man
FREE
BW Indicators
Sergei Gurov
A tool for creating Bill Williams indicators Our tool provides the ability to set Bill Williams indicators on a chart with a mouse click. - The Awesome Oscillator (AO) indicator helps to assess the driving force of the trend. - Alligator indicator — determines the current state of the trend and possible entry and exit points. - Fractals indicator — helps to identify significant levels  - Accelerator Oscillator (AC) indicator — shows the change in trend acceleration. - Market Facilitation Index
FREE
Pip Movement Alert MT5로 시장 모멘텀을 앞서 나가세요. 이 다목적 다중 통화 인디케이터는 여러 심볼에서 정확한 핍 움직임을 추적하고 트레이더에게 알리기 위해 설계되었으며, 외환, 주식, 암호화폐, 상품 거래에 이상적입니다. Forex Factory와 Reddit의 r/Forex와 같은 거래 커뮤니티에서 찬사를 받고 있으며, Investopedia와 TradingView의 논의에서도 갑작스러운 시장 변화를 감지하는 능력으로 주목받고 있어, 빠른 가격 움직임을 활용하려는 트레이더에게 필수적인 도구입니다. 사용자들은 핍 기반의 중요한 움직임(예: 10핍 단위)을 최대 95%의 신뢰도로 식별하며, 실시간 알림을 활용하여 변동성 급등을 포착함으로써 거래 타이밍이 20-30% 개선되었다고 보고합니다. 주요 이점에는 다중 통화 모니터링, 사용자 정의 가능한 핍 임계값, 지속적인 차트 분석 없이 추적을 단순화하는 경량 디자인이 포함되어 스캘퍼, 데이 트레이더, 스윙 트레이더에게
FREE
Gamma Volatility Levels
Carlos Pascual Perez Maturano
Gamma & Volatility Levels Pro [XAUUSD Edition] – The indicator used by professional gold traders in 2025 Fully automatic indicator developed exclusively for XAUUSD (Gold). Displays in real time the most powerful institutional levels that move gold price every single day: • HVL (High Volatility Level) – Orange dashed line Dynamic extreme volatility level (20-period SMA + 1 standard deviation). Gold bounces or breaks this level 87 % of sessions with moves of +$40 to +$120. • CALL RESISTANCE – Blue
VR Grid Mt5
Vladimir Pastushak
3.25 (8)
VR 그리드 표시기는 사용자 정의 설정으로 그래픽 그리드를 생성하도록 설계 되었습니다. 표준 그리드 와 달리 VR 그리드는 원형 레벨 을 구축하는 데 사용됩니다. 사용자의 선택에 따라 라운드 수준 사이의 단계는 임의적일 수 있습니다. 또한 VR Grid는 다른 인디케이터나 유틸리티와는 달리 기간이 바뀌거나 단말기를 재부팅해도 그리드의 위치 를 유지합니다. 설정, 세트 파일, 데모 버전, 지침, 문제 해결 등은 다음에서 얻을 수 있습니다. [블로그] 다음에서 리뷰를 읽거나 작성할 수 있습니다. [링크] 버전 [MetaTrader 4] 수직 수준 은 실제 시간 간격을 기준으로 하며 누락 또는 존재하지 않는 기간은 무시 합니다. 따라서 레벨 사이의 단계는 사용자가 선택한 값과 엄격하게 일치합니다. VR 그리드 표시기를 사용할 때 트레이더는 모든 수준에서 스타일 , 수직선 및 수평선의 색상 및 두께를 변경할 수 있습니다. 이를 통해 금융 상품의 라운드 수준 을 제어할 수 있습니다. 라운
FREE
Gdcr Ai Smart Trader
Mohamed Magdy Abdelrazek Ibrahim
Gdcr Ai Smart Trader Trade Smarter. Trade With Intelligence. Gdcr Ai Smart Trader is a next-generation Expert Advisor designed to deliver high-precision trading using a combination of Smart Money logic, Gann digital analysis, and AI-inspired decision systems . Unlike traditional robots that rely on lagging indicators, this EA evaluates market behavior in real time and executes trades based on high-probability conditions. Intelligent Trading Engine The EA uses an adaptive scoring system th
Blahtech Supply Demand MT5
Blahtech Limited
4.54 (13)
Was: $299  Now: $99  Supply Demand uses previous price action to identify potential imbalances between buyers and sellers. The key is to identify the better odds zones, not just the untouched ones. Blahtech Supply Demand indicator delivers functionality previously unavailable on any trading platform. This 4-in-1 indicator not only highlights the higher probability zones using a multi-criteria strength engine, but also combines it with multi-timeframe trend analysis, previously confirmed swings a
Visual Trend Flux Analyzer Indicator
AL MOOSAWI ABDULLAH JAFFER BAQER
Visual Trend Flux Analyzer: Your Ultimate Guide to Market Momentum Unlock a clearer, more intuitive way to view market trends and momentum with the Visual Trend Flux Analyzer. This powerful indicator for MetaTrader 5 is designed to cut through market noise and provide you with a clean, visual representation of trend strength and potential reversals. Stop guessing the market's direction and start making informed decisions based on a sophisticated, multi-layered analysis. For just $30, you can eq
Summary Signal Line
Evgeniy Kornilov
SummarySignalLine   is an intelligent multi-indicator for MetaTrader 5 that combines signals from five classical technical indicators into a single smoothed signal line. The indicator visualizes overall market sentiment in a simple, intuitive format with color coding. Key Features Composite Analysis   — combines MA, RSI, Bollinger Bands, Stochastic, and ATR Smoothed Signal   — reduces market noise with configurable smoothing Visual Clarity   — color gradient from green (bullish) to red (bearish)
FREE
GDS Renko Entry Helper Pro GDS Renko Entry Helper Pro HOW THE SYSTEM WORKS This tool is part of the Golden Delta Renko trading system. The system is designed to guide you step by step: 1.   Renko Zones       → shows where key levels are   2.   Entry Helper      → highlights where to focus   3.   Entry Helper PRO      → shows setup quality and context   4.   Trade Desk Panel      → executes trades with full control  
RFX5 Forex Strength Meter
Rasoul Mojtahedzadeh
5 (1)
RFX Forex Strength Meter is a powerful tool to trade 8 major currencies in the Forex market, U.S. Dollar ( USD ) European Euro ( EUR ) British Pound ( GBP ) Swiss Franc ( CHF ) Japanese Yen ( JPY ) Australian Dollar ( AUD ) Canadian Dollar ( CAD ) New Zealand Dollar ( NZD ) The indicator calculates the strength of each major currency using a unique and accurate formula starting at the beginning of each trading day of your broker. Any trading strategy in the Forex market can be greatly improved b
Overview TriParity AfterShock PRO Scanner는 MetaTrader 5용 재량형 대시보드 인디케이터입니다. 본 설명에서 triad는 세 개의 통화쌍 또는 종목 간의 관계를 의미합니다. Scanner는 여러 triad와 여러 시간 주기를 하나의 패널에서 검토하며, 트레이더가 관찰 목록을 보다 구조적으로 정리할 수 있도록 돕습니다. 그 목적은 차트 과부하를 줄이고, 후보를 나란히 비교하며, 더 자세히 검토할 가치가 있는 조건을 강조하는 것입니다. 이 제품은 삼각 차익거래를 실행하지 않습니다. 진정한 삼각 차익거래는 세 개의 레그를 거의 동시에 실행해야 하며, 매우 낮은 지연 시간과 매우 작은 거래 비용이 필요합니다. Scanner는 패리티 조정 이후에도 일시적으로 남아 있을 수 있는 왜곡 상태를 재량적으로 검토하기 위해 설계되었습니다. Functions Scanner는 선택된 triad를 여러 시간 주기에 걸쳐 분석하고 NOWCAST를 통해 현재 상태를 표시
Gold Venamax MT5
Sergei Linskii
3.5 (2)
Gold Venamax - 이것은 최고의 주식 기술 지표입니다. 지표 알고리즘은 자산의 가격 변동을 분석하고 변동성과 잠재적 진입 영역을 반영합니다. 표시기 기능: 이것은 편안하고 수익성 있는 거래를 위한 매직과 두 개의 추세 화살표 블록을 갖춘 슈퍼 지표입니다. 블록 전환을 위한 빨간색 버튼이 차트에 표시됩니다. 매직은 표시기 설정에서 설정되므로 서로 다른 블록을 표시하는 두 개의 차트에 표시기를 설치할 수 있습니다. Gold Venamax는 서로 다른 화살표 버퍼(GV 및 SD)를 사용하여 두 개의 차트에 배치할 수 있습니다. 이렇게 하려면 설정에서 다른 Magic을 선택해야 합니다. 예를 들어 하나는 Magic = 999이고 다른 하나는 Magic = 666입니다. 다음으로 차트의 빨간색 버튼으로 화살표 버퍼를 선택할 수 있습니다. 지표 설정의 각 화살표 버퍼(GV 및 SD)에는 편안하고 수익성 있는 거래를 위한 별도의 화살표 필터가 있습니다(UseFiltrGV = true;
Momentum BigMove v8
Pamela Ese Ogono
Momentum BigMove v8 Overview Momentum BigMove v8 is a technical indicator designed to analyze price momentum and volatility. It is intended for use on liquid assets such as Gold (XAUUSD), major equity indices, and primary currency pairs. The tool utilizes an ATR-scaled sensitivity calculation combined with an EMA filter to identify periods of significant price movement. Core Features Momentum Analysis:   Identifies directional price changes based on user-defined sensitivity levels. Non-Repaint
Order Block FVG Box
Usiola Oluwadamilol Olagundoye
Next Arrival : Flip or Die Trading Arena. Flip a trading account:  https://flipordie.com/chapter-1-thirteen-doublings-double-a-trading-account/ The Order Block FVG Box indicator for MetaTrader 5 is a powerful tool designed for discerning traders looking to identify and capitalize on high-probability trading opportunities. This indicator excels at pinpointing valid Order Blocks that are immediately followed by Fair Value Gaps (FVG), enhancing your trading strategy with precise visual cues. Key Fe
FREE
Anan Smart Pro
Mohammed Anan
Anan Smart Flow Pro is a premium MT5 signal indicator designed for traders who prefer structured entries, clean visual execution zones, and confirmed closed-candle signals. The indicator combines smart trend-following logic with ATR-based dynamic TP/SL levels to provide professional BUY and SELL opportunities directly on the chart. Signals are confirmed only after candle close and do not repaint on closed candles. Main Features: • Non-repainting closed-candle signals • Smart BUY / SELL entr
표시기는 현재 시세를 작성하여 과거 시세와 비교할 수 있으며 이를 바탕으로 가격 변동을 예측합니다. 표시기에는 원하는 날짜로 빠르게 이동할 수 있는 텍스트 필드가 있습니다. 옵션: 기호 - 표시기가 표시할 기호 선택. SymbolPeriod - 지표가 데이터를 가져올 기간 선택. IndicatorColor - 표시기 색상. HorisontalShift - 지시자가 그린 따옴표를 지정된 막대 수만큼 이동합니다. Inverse - true는 인용 부호를 반대로, false - 원래 보기를 반전합니다. ChartVerticalShiftStep - 차트를 수직으로 이동합니다(키보드의 위/아래 화살표). 다음은 날짜를 입력할 수 있는 텍스트 필드의 설정으로, '엔터'를 누르면 즉시 이동할 수 있습니다.
RQL Trend Board – Description RQL Trend Board is a simple but powerful multi-timeframe trend dashboard. It shows the current market bias across several timeframes at the same time, using an internal trend-classification method. Each timeframe is displayed as a colored box: Green – bullish bias → look for long setups Yellow – ranging / unclear → no trade zone Red – bearish bias → look for short setups The indicator gives a clear overall picture of where the market wants to go, instead o
FREE
Knowledge of the strength and weakness of each currency is vital for every forex trader. Our   Currency Strength Meter indicator   measures the strength of eight major currencies (USD, EUR, GBP, CHF, JPY, CAD, AUD, NZD) by using the Relative Strength Index indicator, also known as RSI. The Currency Strength Meter indicator shows you, simply and quickly, when a currency is oversold, overbought, or in "normal area". This way, you can identify which currency is the strongest and the weakest. Our
Quant Ladder Pro
VALU VENTURES LTD
Ladder Quant EA - Multi-Session Expert Advisor The Ladder Quant EA is an advanced Expert Advisor for MetaTrader 5, designed to optimize forex trading across major market sessions. It integrates multiple strategies, including breakout, reversal, and range-bound trading, into a robust system. Tailored for major currency pairs, it combines sophisticated risk management with customizable settings. Professional Multi-Session Forex Trading Robot Version:   1.06 - Enhanced Edition Category:   Expert A
FREE
Has rsi signal
Evgenii Savinov
HAS RSI Signal — SL/TP 자동 계산 기능이 포함된 전문 트렌드 지표 HAS RSI Signal 은 검증된 클래식 지표와 현대적인 노이즈 필터링 알고리즘을 결합한 강력한 트레이딩 도구입니다. 이 지표는 Heiken Ashi Smoothed (HAS) 캔들과 RSI 오실레이터를 통해 시장을 분석하며, 추세 반전이나 과매수/과매도 구간 이탈 시 트레이더에게 명확한 진입 신호를 제공합니다. 주요 장점: 이중 필터링: Heiken Ashi Smoothed를 사용하여 시장의 '노이즈'를 제거하고, RSI를 통해 모멘텀의 강도를 확인합니다. 자동 레벨 계산: 단순히 신호만 주는 것이 아니라, 변동성( ATR )을 기반으로 최적의 손절매(Stop Loss) 및 이익 실현(Take Profit) 레벨을 자동으로 계산합니다. 시각적 편의성: 신호가 차트 위에 컬러 캔들 형태로 직접 표시되어 복잡하지 않고 직관적으로 추세를 파악할 수 있습니다. 알림 시스템: 터미널 알람, 사운드, 스마
N/B:  All our product purchase comes with our free ‘’DAILY  SCALPER EA’’ Whatsapp Developer for yours after successful purchase   Overview This indicator is an advanced multi-timeframe trading indicator that combines machine learning-based volatility clustering with traditional SuperTrend methodology. The indicator features real-time market scanning, order block detection, pivot level analysis, and a comprehensive dashboard for signal monitoring.   Core Features 1. Adaptive SuperTrend with
Candlestick Pattern Alerts
Usiola Oluwadamilol Olagundoye
Next Arrival : Flip or Die Trading Arena. Flip a trading account:  https://flipordie.com/chapter-1-thirteen-doublings-double-a-trading-account/ NOTE: Turn Pattern Scan ON This indicator identifies 11 candlestick patterns, filters them to generate trading signals which do not repaint. This signal are supposed to be high probability setups. It also comes with Alerts & Mobile notifications so that you do not miss any trades. It can be used on all trading instruments and on all timeframes. The non-
FREE
이 제품의 구매자들이 또한 구매함
ARIPoint
Temirlan Kdyrkhan
ARIPoint is a powerful trading companion designed to generate high-probability entry signals with dynamic TP/SL/DP levels based on volatility. Built-in performance tracking shows win/loss stats, PP1/PP2 hits, and success rates all updated live. Key Features: Buy/Sell signals with adaptive volatility bands Real-time TP/SL/DP levels based on ATR Built-in MA Filter with optional ATR/StdDev volatility Performance stats panel (Success, Profit/Loss, PP1/PP2) Alerts via popup, sound, push, or email Cu
Divergence Bomber
Ihor Otkydach
4.9 (88)
이 지표를 구매하신 분께는 다음과 같은 혜택이 무료로 제공됩니다: 각 거래를 자동으로 관리하고, 손절/익절 수준을 설정하며, 전략 규칙에 따라 거래를 종료하는 전용 도우미 툴 "Bomber Utility" 다양한 자산에 맞게 지표를 설정할 수 있는 셋업 파일(Set Files) "최소 위험", "균형 잡힌 위험", "관망 전략" 모드로 설정 가능한 Bomber Utility의 셋업 파일 이 전략을 빠르게 설치, 설정, 시작할 수 있도록 돕는 단계별 영상 매뉴얼 주의: 위의 모든 보너스를 받기 위해서는 MQL5 개인 메시지 시스템을 통해 판매자에게 연락해 주세요. 독창적인 커스텀 지표인 “Divergence Bomber(다이버전스 봄버)”를 소개합니다. 이 지표는 MACD 다이버전스(괴리) 전략을 기반으로 한 올인원(All-in-One) 거래 시스템입니다. 이 기술 지표의 주요 목적은 가격과 MACD 지표 간의 다이버전스를 감지하고, **향후 가격이 어느 방향으로 움직일지를 알려주는
SignalTech MT5
Yue Wang
5 (21)
SignalTech MT5 is a fully rule based trading system for EURUSD, USDCHF, USDJPY, AUDUSD, NZDUSD, EURJPY, AUDJPY, NZDJPY, CADJPY.  All the winning trades with chart setups are published on the comments page. 2025-12 1174 Pips 2026-01 2624 Pips 2026-02 2937 Pips 2026-03 2165 Pips 2026-04 2243 Pips It can generate signals with Buy/Sell Arrows and Pop-Up/Sound Alerts. Each signal has clear Entry and Stop Loss levels, which should be automatically flagged on the chart, as well as potential Targets 1,
소개       Quantum Breakout PRO   , 브레이크아웃 존 거래 방식을 변화시키는 획기적인 MQL5 지표! 13년 이상의 거래 경험을 가진 숙련된 트레이더 팀이 개발한       퀀텀 브레이크아웃 PRO       혁신적이고 역동적인 브레이크아웃 존 전략으로 거래 여정을 새로운 차원으로 끌어올리도록 설계되었습니다. Quantum Breakout Indicator는 5개의 이익 목표 영역이 있는 브레이크아웃 영역의 신호 화살표와 브레이크아웃 상자를 기반으로 한 손절 제안을 제공합니다. 초보자 거래자와 전문 거래자 모두에게 적합합니다. Quantum EA 채널:       여기를 클릭하세요 중요한! 구매 후 설치 매뉴얼을 받으려면 개인 메시지를 보내주십시오. 추천: 기간: M15 통화쌍: GBPJPY, EURJPY, USDJPY,NZDUSD, XAUUSD 계정 유형: 스프레드가 매우 낮은 ECN, Raw 또는 Razor 브로커 시간: GMT +3 중개인 :
Azimuth Pro
Ottaviano De Cicco
5 (7)
Azimuth Pro V2: Synthetic Fractal Structure and Confirmed Entries for MT5 Overview Azimuth Pro is a multi-level swing structure indicator by Merkava Labs . Four nested swing layers, swing-anchored VWAP, ABC pattern detection, three-timeframe structural filtering, and closed-bar confirmed entries — one chart, one workflow from micro-swings to macro-cycles. This is not a blind signal product. It is a structure-first workflow for traders who care about location, context, and timing. V2 Launch Offe
RelicusRoad Pro MT5
Relicus LLC
4.96 (24)
RelicusRoad Pro: 퀀트 시장 운영 체제 70% 할인 평생 이용권 (한정 시간) - 2,000명 이상의 트레이더와 함께하세요 왜 대부분의 트레이더는 "완벽한" 지표를 가지고도 실패할까요? 진공 상태에서 단일 개념 만으로 거래하기 때문입니다. 문맥 없는 신호는 도박입니다. 지속적인 승리를 위해서는 컨플루언스(중첩) 가 필요합니다. RelicusRoad Pro는 단순한 화살표 지표가 아닙니다. 완전한 퀀트 시장 생태계 입니다. 독점적인 변동성 모델링을 사용하여 가격이 이동하는 "공정 가치 로드"를 매핑하고, 단순 노이즈와 실제 구조적 돌파를 구분합니다. 추측은 그만두세요. 기관급 로드 로직으로 거래를 시작하세요. 핵심 엔진: "Road" 알고리즘 시스템의 중심에는 시장 상황에 실시간으로 적응하는 동적 변동성 채널인 Road Algo 가 있습니다. 세이프 라인(평형) 과 가격이 수학적으로 반전될 가능성이 높은 확장 레벨 을 투영합니다. Simple Road: 일반적인 시장을 위
MetaTrader 5용 스마트 다층 브레이크아웃 및 풀백 탐지기 "스마트하고, 간단하고, 빠르게!" 고확률 브레이크아웃 진입을 놓치는 것에 지치셨나요? 여러 차트를 몇 시간씩 스캔하면서 브레이크아웃을 추세 방향과 통화 모멘텀에 맞추려고 하지만 — 결국 움직임을 놓치고 마나요? Break Pullback은 하나의 지표로 이 모든 문제를 해결합니다. Break Pullback이란 무엇인가요? Break Pullback은 시장 구조, 브레이크아웃, 추세 지속 설정을 거래하는 트레이더를 위해 특별히 설계된 전문가급 MetaTrader 5 지표입니다. 실시간으로 여러 통화 쌍에 걸쳐 Break와 Pullback 형성을 자동으로 감지하고 — 세 가지 확인 레이어를 통해 모든 신호를 필터링합니다: 구조적 브레이크아웃 탐지 — 차트의 주요 브레이크 레벨 식별 HTF 일봉 바이어스 — 진입을 지배적인 일봉 추세 방향에 맞춤 통화 강도 지수 — 쌍을 이룬 통화 간의 모멘텀 불균형 확인 결과: 오
Quantum TrendPulse
Bogdan Ion Puscasu
5 (25)
SuperTrend   ,   RSI   ,   Stochastic   의 힘을 하나의 포괄적인 지표로 결합하여 트레이딩 잠재력을 극대화하는 궁극의 트레이딩 도구   인 Quantum TrendPulse를   소개합니다. 정밀성과 효율성을 추구하는 트레이더를 위해 설계된 이 지표는 시장 추세, 모멘텀 변화, 최적의 진입 및 종료 지점을 자신 있게 식별하는 데 도움이 됩니다. 주요 특징: SuperTrend 통합:   주요 시장 추세를 쉽게 따라가고 수익성의 물결을 타세요. RSI 정밀도:   매수 과다 및 매도 과다 수준을 감지하여 시장 반전 시점을 파악하는 데 적합하며 SuperTrend 필터로 사용 가능 확률적 정확도:   변동성이 큰 시장에서 숨겨진 기회를 찾기 위해 확률적 진동   을 활용하고 SuperTrend의 필터로 사용 다중 시간대 분석:   M5부터 H1 또는 H4까지 다양한 시간대에 걸쳐 시장을 최신 상태로 유지하세요. 맞춤형 알림:   맞춤형 거래 조건이 충족되면
Btmm state engine pro
Garry James Goodchild
5 (4)
BTMM State Engine Pro is a MetaTrader 5 indicator for traders who use the Beat The Market Maker approach: Asian session context, kill zone timing, level progression, peak formation detection, and a multi-pair scanner from a single chart. It combines cycle state logic with a built-in scanner dashboard so you do not need the same tool on many charts at once. What it does Draws the Asian session range; session times can follow broker server offset or be set in inputs. Tracks level progression (L
우선적으로, 이 거래 도구는 전문적인 거래에 이상적인 비-다시 그리기 및 지연되지 않는 지표입니다.  온라인 강좌, 사용자 매뉴얼 및 데모. 스마트 가격 액션 컨셉트 인디케이터는 신규 및 경험 많은 트레이더 모두에게 매우 강력한 도구입니다. Inner Circle Trader Analysis 및 Smart Money Concepts Trading Strategies와 같은 고급 거래 아이디어를 결합하여 20가지 이상의 유용한 지표를 하나로 결합합니다. 이 인디케이터는 스마트 머니 컨셉트에 중점을 두어 대형 기관의 거래 방식을 제공하고 이동을 예측하는 데 도움을 줍니다.  특히 유동성 분석에 뛰어나 기관이 어떻게 거래하는지 이해하는 데 도움을 줍니다. 시장 트렌드를 예측하고 가격 변동을 신중하게 분석하는 데 탁월합니다. 귀하의 거래를 기관 전략에 맞추어 시장의 동향에 대해 더 정확한 예측을 할 수 있습니다. 이 인디케이터는 시장 구조를 분석하고 중요한 주문 블록을 식별하고 다양
OrderFlux | MetaTrader 5용 풋프린트 오더플로우 버전 2.0 – 액티브 트레이더를 위한 실시간 Bid/Ask 시각화 OrderFlux는 MT5를 위한 풋프린트 및 오더플로우 지표입니다. 가격이 어디로 이동했는지뿐만 아니라, 그 움직임 내부에서 어떤 일이 발생하고 있는지(가격 수준별 Bid/Ask 거래량, 델타, 임밸런스, 거래량 분포)를 보여줍니다. 많은 차트가 캔들의 최종 결과만 보여줍니다. OrderFlux는 그곳에 도달하기까지의 과정을 보여줍니다. 이것이 바로 캔들 모양뿐만 아니라 시장 참여자들의 동향을 읽고자 할 때 정확히 도움이 되는 부분입니다. 라이브 차트에서 OrderFlux는 주로 다음 세 가지 질문에 답합니다: 현재 어디에서 공격적인 매수 또는 매도 압력이 시장에 진입하고 있는가? 어떤 가격 수준에서 거래량이 흡수되거나 거부되고 있는가? 현재의 움직임이 세션 컨텍스트(배경)에 어떻게 부합하는가? 인터페이스에서 제공되는 기능 메인 차트는 Canvas
Grabber System MT5
Ihor Otkydach
4.83 (23)
탁월한 기술적 지표인 Grabber를 소개합니다. 이 도구는 즉시 사용 가능한 “올인원(All-Inclusive)” 트레이딩 전략으로 작동합니다. 하나의 코드 안에 강력한 시장 기술 분석 도구, 매매 신호(화살표), 알림 기능, 푸시 알림이 통합되어 있습니다. 이 인디케이터를 구매하신 모든 분들께는 다음의 항목이 무료로 제공됩니다: Grabber 유틸리티: 오픈 포지션을 자동으로 관리하는 도구 단계별 영상 매뉴얼: 설치, 설정, 그리고 실제 거래 방법을 안내 맞춤형 세트 파일: 인디케이터를 빠르게 자동 설정하여 최고의 성과를 낼 수 있도록 도와줍니다 다른 전략은 이제 잊어버리세요! Grabber만이 여러분을 새로운 트레이딩의 정점으로 이끌어 줄 수 있습니다. Grabber 전략의 주요 특징: 거래 시간 프레임: M5부터 H4까지 거래 가능한 자산: 어떤 자산이든 사용 가능하지만, 제가 직접 테스트한 종목들을 추천드립니다 (GBPUSD, GBPCAD, GBPCHF, AUDCAD, AU
" Dynamic Scalper System MT5 " 지표는 추세 파동 내에서 스캘핑 방식으로 거래하도록 설계되었습니다. 주요 통화쌍 및 금에서 테스트되었으며, 다른 거래 상품과의 호환성이 가능합니다. 추가적인 가격 변동 지원을 통해 추세에 따라 단기 포지션 진입 신호를 제공합니다. 지표의 원리 큰 화살표는 추세 방향을 결정합니다. 작은 화살표 형태의 스캘핑 신호를 생성하는 알고리즘은 추세 파동 내에서 작동합니다. 빨간색 화살표는 상승 방향을, 파란색 화살표는 하락 방향을 나타냅니다. 민감한 가격 변동선은 추세 방향으로 그려지며, 작은 화살표의 신호와 함께 작용합니다. 신호는 다음과 같이 작동합니다. 적절한 시점에 선이 나타나면 진입 신호가 형성되고, 선이 있는 동안 미결제 포지션을 유지하며, 완료되면 거래를 종료합니다. 권장되는 작업 시간대는 M1~H4입니다. 화살표는 현재 캔들에 형성되며, 다음 캔들이 이미 시작되었더라도 이전 캔들의 화살표는 다시 그려지지 않습니다. 입
Meridian Pro
Ottaviano De Cicco
5 (2)
Meridian Pro 2.00: Professional Multi-Timeframe Trend Matrix for MT5 Meridian Pro 2.00 is a professional adaptive trend matrix for MetaTrader 5. It combines the original Meridian trend engine, a clean chart ribbon, closed-bar signal arrows, an 8-timeframe dashboard, Fuel momentum, weighted consensus, synthetic HTF processing and chart-native higher-timeframe context lines. The goal is simple: read current trend, multi-timeframe structure, strength, momentum and EA-ready state from one discipline
OmniSync Projection
Antonio-alin Teculescu
5 (1)
Chronos Fractal Engine is an innovative price projection indicator for MetaTrader 5, designed to transform your technical analysis by intelligently identifying and projecting historical price patterns. Built upon an advanced correlation algorithm and the fractal principles of the market, this powerful tool visualizes potential future price movements, giving you a unique edge in your trading decisions. What is Chronos Fractal Engine? At its core, the Chronos Fractal Engine employs a sophisticat
Trend Lines PRO MT5
Roman Podpora
5 (1)
트렌드 라인즈 프로       이 지표는 시장이 실제로 어떤 방향으로 전환되는지 파악하는 데 도움이 됩니다. 실제 추세 반전 지점과 주요 시장 참여자들이 다시 진입하는 지점을 보여줍니다. 보시다시피       BOS 라인       복잡한 설정이나 불필요한 노이즈 없이 더 높은 시간대의 추세 변화와 주요 레벨을 확인할 수 있습니다. 신호는 차트에 다시 그려지지 않고 캔들이 마감된 후에도 계속 표시됩니다. MT4 버전   -   RFI LEVELS PRO   표시기   와 결합 시 최대 잠재력을 발휘합니다. 지표가 보여주는 내용: 실제 변화       추세(BOS 라인) 한 번 신호가 나타나면 그 신호는 계속 유효합니다! 이는 신호를 발생시킨 후 변경될 수 있는 리페인팅 방식의 지표와 중요한 차이점입니다. 리페인팅 방식의 지표는 잠재적으로 자금 손실로 이어질 수 있습니다. 이제 더욱 높은 확률과 정확도로 시장에 진입할 수 있습니다. 또한 화살표가 나타난 후 목표가(익절)에 도달하거나
The Zone Trading Indicator is a technical analysis tool for MetaTrader 5 that automatically identifies and displays tradable price zones across multiple timeframes to assist with structured market analysis. The indicator plots Monthly, Weekly, Daily, and H4 tradable zones , allowing traders to view higher- and lower-timeframe price areas simultaneously. These zones are designed to support one-candle–based entry approaches by highlighting predefined areas where price interaction may be monitored.
RFI levels PRO MT5
Roman Podpora
3.67 (3)
이 지표는 추세 반전 지점과 가격 반등 영역을 정확하게 보여줍니다.       주요 투자자들   . 새로운 트렌드가 형성되는 곳을 파악하고 최대한 정확하게 의사결정을 내리며 모든 거래를 완벽하게 통제합니다. TREND LINES PRO   지표와 함께 사용할 때 최대의 잠재력을 발휘합니다.  VERSION MT4 지표가 보여주는 내용: 새로운 추세의 시작 시 활성화되는 반전 구조 및 반전 수준. 최소한의 위험 대비 수익률을 갖는 이익 실현   (TAKE PROFIT)   및   손절매(STOP LOSS)   레벨 표시       RR 1:2   . 지능형 손실 감소 로직이 적용된 손절매 기능. 지정된 지표에서 두 가지 추세 유형에 대한 반전 패턴을 표시합니다. 지표: 트렌드를 따라   트렌드 라인 프로   (글로벌 트렌드 변화) 트렌드 프로   (빠른 트렌드 변화) 간단하고 효과적입니다       스캐너       실시간 추세 (신규). 다중 시간 프레임 도구 필터링. 표시하다  
PZ Day Trading MT5
PZ TRADING SLU
2.83 (6)
Effortless trading: non-repainting indicator for accurate price reversals This indicator detects price reversals in a zig-zag fashion, using only price action analysis and a donchian channel. It has been specifically designed for short-term trading, without repainting or backpainting at all. It is a fantastic tool for shrewd traders aiming to increase the timing of their operations. [ Installation Guide | Update Guide | Troubleshooting | FAQ | All Products ] Amazingly easy to trade It provides
Volume flow Profile
Israr Hussain Shah
Master Edition은 거래량과 자금 흐름의 관점을 통해 시장 구조를 시각화하도록 설계된 전문가급 분석 도구입니다. 표준 거래량 지표와 달리, 이 도구는 차트에 일일 거래량 프로필을 직접 표시하여 가격 발견이 발생한 위치와 "스마트 머니"가 위치한 곳을 정확하게 볼 수 있게 합니다. 이 Master Edition은 명확성과 속도를 위해 설계되었으며, 로드 시 차트 레이아웃을 즉시 아름답게 만드는 독특한 자동 테마 동기화 시스템을 특징으로 합니다. 주요 기능: 진정한 자금 흐름 계산: 표준 틱 거래량을 넘어섭니다. "Use Money Flow"를 활성화하면 거래량이 가격에 따라 가중치가 부여되어 특정 가격 수준에서의 실제 자본 투입을 드러냅니다. 가치 영역(VA) 시각화: 가치 영역(기본값: 거래량의 70%)을 자동으로 계산합니다. VA Fill: 통제 구역을 즉시 식별하기 위해 가치 영역 배경을 음영 처리합니다. 주요 수준: 통제점(POC), 가치 영역 고점(VAH), 가치 영
Entry Points Pro for MT5
Yury Orlov
4.48 (138)
다시 색을 칠하지 않고 거래에 진입할 수 있는 정확한 신호를 제공하는 MT5용 지표입니다. 외환, 암호화폐, 금속, 주식, 지수 등 모든 금융 자산에 적용할 수 있습니다. 매우 정확한 추정값을 제공하고 매수와 매도의 가장 좋은 시점을 알려줍니다. 하나의 시그널로 수익을 내는 지표의 예와 함께 비디오 (6:22)시청하십시오! 대부분의 거래자는 Entry Points Pro 지표의 도움으로 첫 거래 주 동안 트레이딩 결과를 개선합니다. 저희의   Telegram Group 을 구독하세요! Entry Points Pro 지표의 좋은점. 재도색이 없는 진입 신호 신호가 나타나고 확인되면(시그널 캔들이 완성된 경우) 신호는 더 이상 사라지지 않습니다. 여타 보조지표의 경우 신호를 표시한 다음 제거되기 때문에 큰 재정적 손실로 이어집니다. 오류 없는 거래 게시 알고리즘을 통해 트레이드(진입 또는 청산)를 할 이상적인 순간을 찾을 수 있으며, 이를 통해 이를 사용하는 모든 거래자의 성공률이
ARICoins
Temirlan Kdyrkhan
ARICoin is a powerful trading companion designed to generate high-probability entry signals with dynamic TP/SL/DP levels based on volatility. Built-in performance tracking shows win/loss stats, PP1/PP2 hits, and success rates all updated live. Key Features: Buy/Sell signals with adaptive volatility bands Real-time TP/SL/DP levels based on ATR Built-in MA Filter with optional ATR/StdDev volatility Performance stats panel (Success, Profit/Loss, PP1/PP2) Alerts via popup, sound, push, or email Cust
Trend Forecaster
Alexey Minkov
5 (7)
Trend Forecaster – Since 2023. The Trend Forecaster indicator utilizes a unique proprietary algorithm to determine entry points for a breakout trading strategy. The indicator identifies price clusters, analyzes price movement near levels, and provides a signal when the price breaks through a level. The Trend Forecaster indicator is suitable for all financial assets, including currencies (Forex), metals, stocks, indices, and cryptocurrencies. You can also adjust the indicator to work on any time
CRT Multi-Timeframe Market Structure & Liquidity Sweep Indicator Non-Repainting | Multi-Asset | MT4 Version Available MT4 Version: https://www.mql5.com/en/market/product/162556 Full Setup Guide: https://www.mql5.com/en/blogs/post/767525 Indicator Overview CRT Ghost Candle HTF Fractal is a complete institutional-grade market structure toolkit for MetaTrader 5. It projects higher-timeframe candle structure, CRT trap levels, session levels, previous period highs and lows, pivot points, and a real
Meta Cipher A
SILICON HALLWAY PTY LTD
5 (1)
Meta Cipher A: 정밀한 가격 행동용 오버레이 지표 Meta Cipher A 는 인기 있는 Market Cipher A 개념을 MetaTrader 5로 가져온 고정밀 오버레이 지표입니다. 가격 차트에 선행 신호를 직접 표시하도록 설계되었으며, 8 EMA 리본 , WaveTrend 분석 및 8가지 다양한 신호 유형을 결합하여 진입, 청산 및 고위험 구간을 미리 파악할 수 있도록 도와줍니다. Meta Cipher A는 단독으로도 강력하지만, Meta Cipher B 와 함께 사용할 때 더 깊이 있는 분석과 확실한 신호 확인이 가능합니다. 기능 요약 이 오버레이 시스템은 트렌드 기반 색상으로 표시되는 동적 EMA와 시각적 명확성을 높이기 위한 채움 영역을 사용합니다. 또한 Blood Diamond (반전 신호), Yellow Cross (시장 조작 경고), Blue Triangle (추세 지속 신호) 등 8가지 전문 신호를 제공합니다. WaveTrend 오실레이터는 백그라운드에
==================================================================== SMC Pro v6.1 APEX AI — XAUUSD Gold Empire MetaTrader 5 Indicator · Smart Money Concepts · Predictive Intelligence Engine ==================================================================== SMC Pro v6.1 APEX AI is a professional Smart Money Concepts indicator system built exclusively for XAUUSD (Gold) on MetaTrader 5. It combines the complete SMC framework — Order Blocks, Liquidity sweeps, Fair Value Gaps, Break of Structure,
Times MT5
Ivan Stefanov
이 지표는 시장 상태에 따라 동적으로 조정되는 다양한 지속 시간의 시계열 시퀀스로 시장을 분석합니다. 각 시리즈는 두 개의 선으로 표시됩니다: 얇은 선과 두꺼운 선. 얇은 선은 시장이 도달할 것으로 예상되는 가격 수준을 나타내고, 두꺼운 선은 포지션 개시 트리거로 사용됩니다. 녹색 선은 강세장, 빨간 선은 약세장을 나타냅니다. 새로운 시계열이 나타나면 트렌드 방향으로 즉시 주문을 열 수 있습니다. 시리즈 종료 시 포지션을 청산하거나 다음 시리즈를 기다릴 수 있습니다. 강세장에서 얇은 선 위에 선에 닿지 않는 캔들이 나타나면 LONG 신호가 발생하고, 이후 두꺼운 선에 도달하면 "Buy!" 알림이 표시됩니다. 약세장은 반대입니다. 단독 사용하거나 다른 지표와 조합하여 조정 구간에서 신호를 필터링할 수 있습니다. 리페인팅 가능성이 있습니다. 원하는 모든 시간대에서 사용 가능하며, 기본 설정이 최적화되어 있습니다. 모바일 푸시 알림 지원. 내장 스캐너: "S" 버튼을 누르면 Market
Meravith MT5
Ivan Stefanov
5 (1)
마켓 메이커를 위한 도구. Meravith는 다음과 같은 기능을 제공합니다: 모든 타임프레임을 분석하고 현재 유효한 추세를 표시합니다. 강세와 약세 거래량이 동일한 유동성 구간(거래량 균형 구간)을 강조 표시합니다. 서로 다른 타임프레임의 모든 유동성 레벨을 차트에 직접 표시합니다. 텍스트 기반 시장 분석을 생성하여 참고용으로 제공합니다. 현재 추세를 기반으로 목표가, 지지선 및 손절가를 계산합니다. 거래의 위험 대비 보상 비율(Risk/Reward)을 계산합니다. 계좌 잔고에 따라 포지션 크기를 산출하고 잠재 수익을 추정합니다. 시장에 중대한 변화가 발생할 경우 경고도 제공합니다. 지표의 주요 라인: 강세/약세 거래량 소진 라인 — 목표가로 사용됩니다. 시장 추세를 나타내는 라인. 시장이 강세인지 약세인지에 따라 색상이 변경되며 추세 지지선 역할을 합니다. 색상은 주로 시장 심리를 보여줍니다. 거래량 균형선(Eq). Eq(Volume Equilibrium) 라인은 시스템의 핵심입니
Bill Williams Advanced
Siarhei Vashchylka
5 (11)
Bill Williams Advanced is designed for automatic chart analysis using Bill Williams' "Profitunity" system. The indicator analyzes four timeframes at once. Manual (Be sure to read before purchasing) Advantages 1. Analyzes the chart using Bill Williams' "Profitunity" system. Signals are displayed in a table in the corner of the screen and on the price chart. 2. Finds all known AO and AC signals, as well as zone signals. Equipped with a trend filter based on the Alligator. 3. Finds "Divergence Bar
UZFX {SSS} 스캘핑 스마트 시그널 MT5는 급변하는 시장에서 정확한 실시간 시그널을 필요로 하는 스캘퍼, 데이 트레이더, 스윙 트레이더를 위해 설계된 리페인팅 없는 고성능 트레이딩 지표입니다. (UZFX-LABS)에서 개발한 이 지표는 가격 움직임 분석, 추세 확인, 스마트 필터링 기능을 결합하여 모든 통화 쌍과 시간대에서 확률이 높은 매수 및 매도 시그널을 생성합니다. 추천* 최적 시간대: 15분 이상. {1시간}이 제가 가장 선호하는 시간대입니다. 그리고 그 결과는 정말 놀라울 정도입니다...! 참고: { LTL 164343 } 지표와 함께 사용하면 신호 적중률을 높일 수 있습니다. LTL 신호를 통해 추세를 파악하고, SSS 신호를 진입 신호로 활용하세요. 이 접근 방식은 승률을 극대화하고 오신호를 방지하는 데 도움이 됩니다. 주요 기능 스마트 신호 감지 – 강력한 추세 반전 및 지속 패턴을 정밀하게 식별합니다. 다중 시간대 스캘핑 – 모든 시간대에서 완벽하게 작동
제작자의 제품 더 보기
DESCRIPTION: Position Size Calculator — On-Chart Risk Management Tool Never risk too much on a single trade again. This calculator displays real-time position sizing for 3 risk levels simultaneously, calculated from your live account balance and current ATR-based stop loss distance. DISPLAYS 3 RISK SCENARIOS AT ONCE: Risk Level 1 (1%): Risk amount in dollars + Lot size Risk Level 2 (2%): Risk amount in dollars + Lot size Risk Level 3 (3%): Risk amount in dollars + Lot size All lot sizes are dyna
FREE
Market Pulse Scanner
Olurotimi Olugbenga Awolade
Market Pulse Scanner v2 — 6-Factor Market Analysis Dashboard Before you take a trade, you need to know: Is there a trend? How strong is it? Is the market structure supporting it? Is volume confirming? Is volatility right for trading? The Market Pulse Scanner answers all of these questions in a single on-chart dashboard. Six independent analysis components score the market from 0 to 6. Strong signals only fire when most components agree. THE 6 COMPONENTS TREND DIRECTION EMA stack (20/50) with AD
DiNapoli Target Oscillator
Olurotimi Olugbenga Awolade
DiNapoli Target Oscillator v2 — See Where Price Sits Inside the Fibonacci Structure Most oscillators show you overbought or oversold. This one shows you exactly where price sits between the last swing low (0) and swing high (100) — mapped to the Fibonacci levels that institutional traders use for entries and exits. When the oscillator reads 38.2, price is at the golden pullback zone. When it reads 61.8, price has reached the first take-profit extension. At 100, it has fully retraced the swing. Y
Precision Reversal Engine
Olurotimi Olugbenga Awolade
Precision Reversal Engine v2 — Multi-Confluence Reversal Detection with 3-Tier Take Profit Reversals are the highest-reward trades in the market — but only if you enter at the right time and exit at the right level. The Precision Reversal Engine v2 combines five independent detection modules, an ADX trend filter, and a 3-tier Fibonacci TP system to give you the clearest, most actionable reversal signals available on MetaTrader 5. Version 2.0 is a major upgrade — smarter signal filtering, dramat
필터:
리뷰 없음
리뷰 답변