MRPHN Indicator

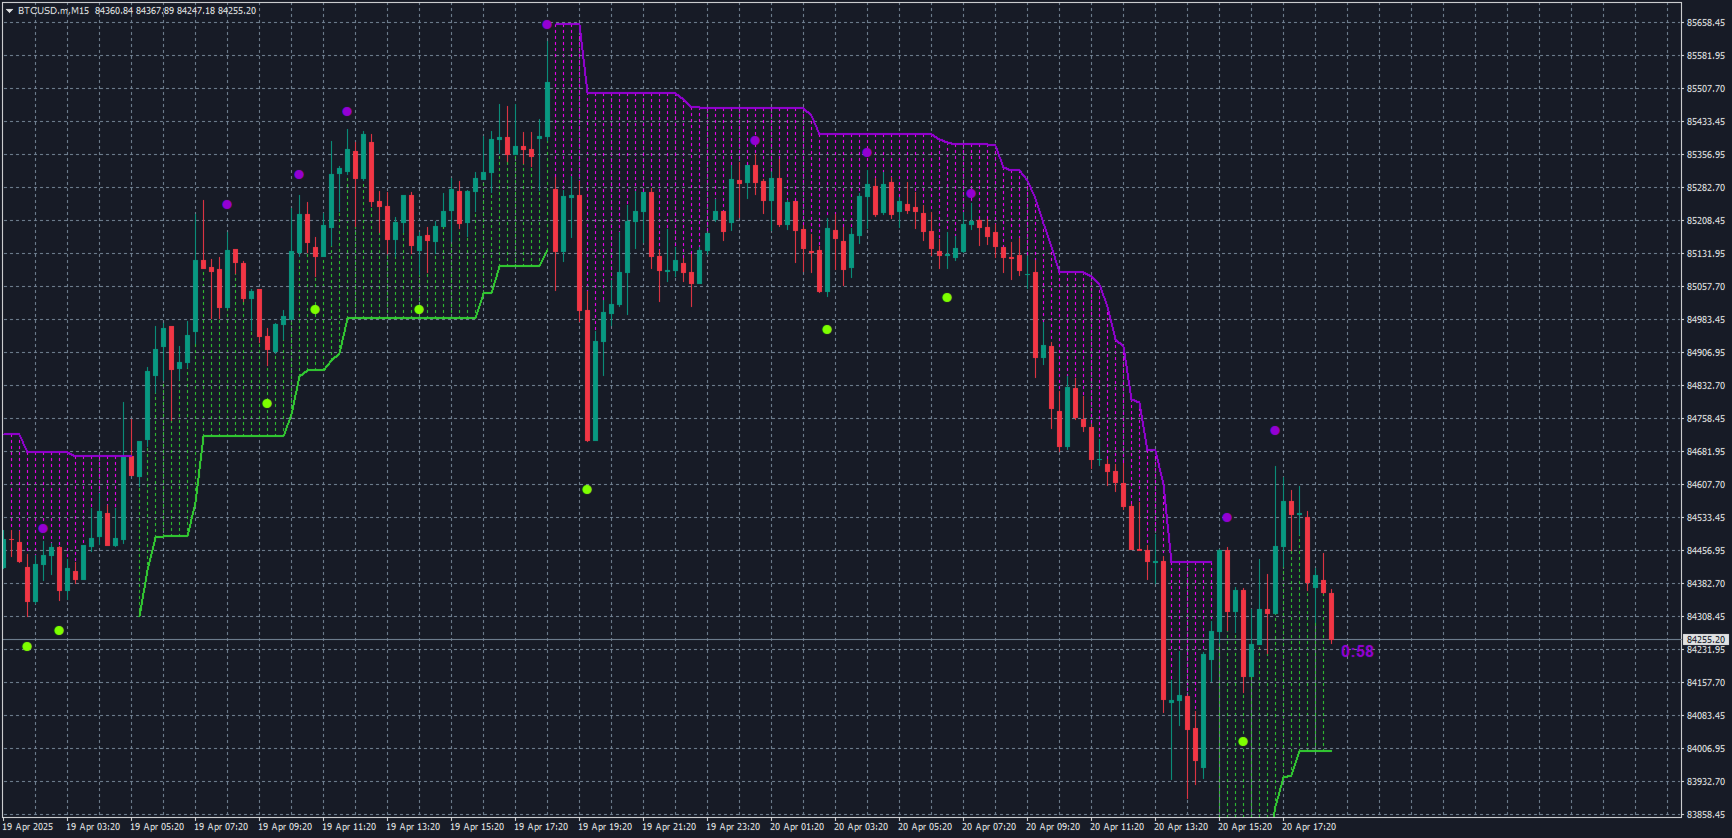
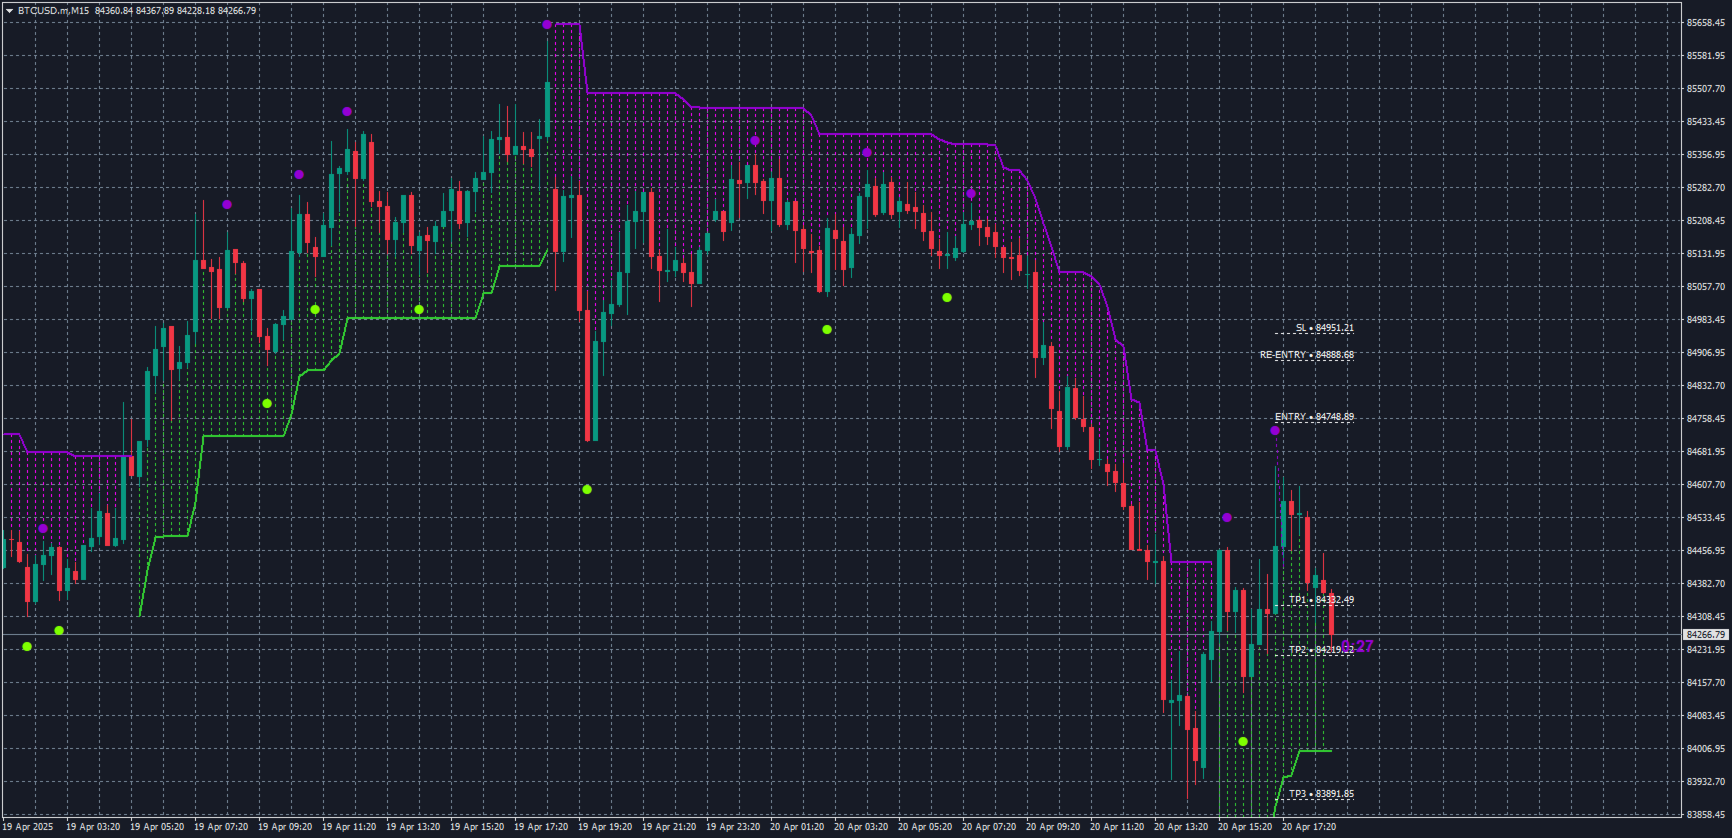
iMRPHN: Supertrend & Swing Reversal Indicator

A trading indicator that integrates Supertrend zone detection with swing-based entry logic. Designed for traders who apply both trend-following and counter-trend approaches. The indicator works across multiple timeframes and offers several helpful visual and alert-based features.

Key Features:

  • Automatic identification of swing high and swing low levels

  • Automatic Fibonacci retracement

  • Supertrend reversal zone visualization in real-time

  • Highlights areas of interest for potential long or short setups

  • Optional detection of sub-swings for refined structure mapping

  • Candle-close countdown timer

  • Configurable alerts: pop‑up, sound, email, and mobile notifications


Applications:

  • Identifying potential reversal areas after extended moves

  • Confirming breakout entries in the direction of the trend

  • Helps support decision-making during volatile market conditions

  • Aligning swing bias across different timeframes


推荐产品
The indicator detects and displays Shark harmonic pattern (see the screenshot). The pattern is plotted by the extreme values of the ZigZag indicator (included in the resources, no need to install). After detecting the pattern, the indicator notifies of that by a pop-up window, a mobile notification and an email. The indicator highlights the process of the pattern formation and not just the complete pattern. In the former case, it is displayed in the contour triangles. After the pattern is comple
VR Cub
Vladimir Pastushak
VR Cub 这是获得高质量切入点的指标。该指标的开发是为了促进数学计算并简化对仓位入场点的搜索。多年来,该指标所针对的交易策略已被证明其有效性。交易策略的简单性是其巨大的优势,即使是新手交易者也能成功进行交易。 VR Cub 计算开仓点以及获利和止损目标水平,这显着提高了效率和易用性。查看使用以下策略进行交易的屏幕截图,了解简单的交易规则。 设置、设置文件、演示版本、说明、问题解决,可以从以下位置获取 [博客] 您可以在以下位置阅读或撰写评论 [关联] 版本为 [MetaTrader 5] 计算入场点的规则 开仓 要计算入场点,您需要将 VR Cub 工具从最后一个高点拉伸到最后一个低点。 如果第一个点在时间上早于第二个点,交易者等待柱线收于中线上方。 如果第一个点在时间上晚于第二个点,交易者等待柱线收于中线下方。 根据上述条件,严格在 柱线收盘 后建仓。 换句话说,如果我们在小时图上进行交易,那么从最高点到最低点的时间距离必须超过24小时,最高点和最低点之间的点数必须大于或等于平均价格变动每天。 维持和改变市场地位 可以有多个未平仓头寸;每个头寸都可以单独修改。 VR Cub
基于具有标准参数的MACD指标波 在最后两个MACD波上分别对正面和负面交易斐波纳契水平, 如果负波浪在MACD指标上结束,则颜色为绿色, 如果正波在MACD指标上结束,那么颜色为红色。 Wave的终止标准是两个滴答,MACD的符号不同。 在最近四次MACD波浪中绘制趋势线。 与专家合作很好  Figures MACD   https://www.mql5.com/ru/market/product/42031 更多截图: https://www.mql5.com/ru/charts/10581596/audusd-h1-alpari-international https://www.mql5.com/ru/charts/10631979/usdjpy-m1-alpari-international https://www.mql5.com/ru/charts/10628704/gbpusd-m15-alpari-international
PipsZenith Virtual Candle Levels – Indicator Description Take your trading to the next level with PipsZenith Virtual Candle Levels – the ultimate multi-timeframe support and resistance tool. This powerful indicator plots High, Low, Open, and Close levels from multiple standard and custom timeframes, helping traders identify key market zones with precision. Unlike ordinary indicators, PipsZenith Virtual Candle Levels lets you see levels from: Yearly, 6-Month, 4-Month, 3-Month, 2-Month Monthly, We
TrendInChannel
Andriy Sydoruk
This indicator is the undisputed leader among the indicators. And for this statement there is a good reason. The indicator builds a very high quality channel in which it generates signals to enter! What is the ideal strategy for the trader, since the trader always hesitates when choosing a strategy for the job. That is, this indicator will allow you to solve the dilemma of choosing a job by trend or to the channel, since it combines these two basic concepts. Working with the indicator is very
Wave Wolf MT4
Andrei Salanevich
Wave Wold MT4外汇指标旨在搜索狼波并将其显示在交易终端的当前窗口中。 对于在交易中使用狼波的交易者来说,这是一个很好的指标。 它在交易策略中的应用将显着提高其效率和盈利能力。 有关指标的信息 与其他Wolf wave指标不同,Wave Wold MT4外汇指标具有许多显着提高其有效性的功能: 第一个是打开的Windows5point参数(真值)提供信息支持,即扩展了狼波出现在其上的图表的窗口。 例如,如果EURUSD、AUDUSD和GBPUSD图表是开放的,并且每个图表都安装了Wave WOLD MT4指标,那么如果检测到欧元模型,相应的图表将自动被带到其他图表的顶部,这在交易大量工具时变得非常方便。  第二个功能是MACD上的内置发散分析,用户可以自己选择参数(默认设置(12,26,9))。 顺便说一下,通常振荡器的值不显示在工作窗口上,只反映在形成点(5)时的价格标签的颜色上,特别是,如果标签的颜色是蓝色,则没有发散,如果颜色是红 如何使用指标 Wave WOLD MT4指标显示第4个形成点的假设Wolf模型和第5个点的形成区域(所谓的甜区,以黄色显示)。 如
Trend Map
Maryna Shulzhenko
The Trend Map indicator is designed to detect trends in price movement and allows you to quickly determine not only the direction of the trend, but also to understand the levels of interaction between buyers and sellers. It has no settings and therefore can be perceived as it signals. It contains only three lines, each of which is designed to unambiguously perceive the present moment. Line # 2 characterizes the global direction of the price movement. If we see that the other two lines are above
Trend Oscillator mw
DMITRII GRIDASOV
趋势振荡器 - 是一种高级自定义 Crypto_Forex 指标,高效的交易工具! ............................................................................... - 使用高级新计算方法 - 参数“计算价格”有 20 个选项。 - 有史以来最平滑的振荡器。 - 绿色表示上升趋势,红色表示下降趋势。 - 超卖值:低于 5,超买值:超过 95。 - 使用此指标,有很多机会升级标准策略。 - 具有 PC 和移动警报。 ................................................ 点击这里查看高质量的交易机器人和指标! 这是仅在此 MQL5 网站上提供的原创产品。
The indicator displays the data of the Stochastic oscillator from a higher timeframe on the chart. The main and signal lines are displayed in a separate window. The stepped response is not smoothed. The indicator is useful for practicing "manual" forex trading strategies, which use the data from several screens with different timeframes of a single symbol. The indicator uses the settings that are identical to the standard ones, and a drop-down list for selecting the timeframe. Indicator Paramet
FXC iMACD-DivergencE MT4 Indicator This is an advanced MACD indicator that finds trend-turn divergences on the current symbol. The indicator detects divergence between the MACD and the price movements as a strong trend-turn pattern. Main features: Advanced divergence settings Price based on Close, Open or High/Low prices Give Buy/Sell open signals PUSH notifications E-mail sending Pop-up alert Customizeable Information panel Input parameters: MACD Fast-EMA: The Fast-EMA variable of the MACD indi
ZhiBiCCI MT4
Qiuyang Zheng
【ZhiBiCCI】指标适合所有的周期使用,也适合所有的市场品种。 【ZhiBiCCI】绿色实线是逆转看涨背离。绿色虚线是经典的看涨背离。 【ZhiBiCCI】向红色实线是反向看跌背离。红色虚线是古典看跌背离。 【ZhiBiCCI】可以在参数里面设置(Alert、Send mail、Send notification),设置为(true)就可以发送即时信号到警报窗口、电子邮件、即时消息。 参数设置说明: 【displayAlert】:这是警报开关,设置成true,如果出现箭头就会自动警报提示;设置成false,则不会警报提示。 【sendmail_NO_OFF】:这是发送邮件的开关,设置成true,如果出现箭头就会发送邮件到你在MT4设置好的邮箱里面;设置成false,则不会发邮件。 【sendnotification_NO_OFF】:这是发送即时消息的开关,设置成true,如果出现箭头就会发送消息到你的移动设备;设置成false,则不会发消息。 更多好用的指标网址: https://www.mql5.com/en/users/zhengqiuyang/seller
FXC iDeM-DivergencE MT4 Indicator This is an advanced DeMarker indicator that finds trend-turn divergences on the current symbol. The indicator detects divergence between the DeMarker and the price movements as a strong trend-turn pattern. Main features: Advanced divergence settings Price based on Close, Open or High/Low prices Give Buy/Sell open signals PUSH notifications E-mail sending Pop-up alert Customizeable Information panel Input parameters: DeM Period: The Period size of the DeMarker in
Auto Fibo Pro m
DMITRII GRIDASOV
“Auto FIBO Pro” Crypto_Forex 指标 - 是交易中的绝佳辅助工具! - 指标自动计算并放置在图表斐波那契水平和局部趋势线(红色)上。 - 斐波那契水平指示价格可能反转的关键区域。 - 最重要的水平是 23.6%、38.2%、50% 和 61.8%。 - 您可以将其用于反转剥头皮或区域网格交易。 - 还有很多机会可以使用 Auto FIBO Pro 指标来改进您当前的系统。 - 它具有信息价差掉期显示 - 它显示所连接的外汇对的当前价差和掉期。 - 显示屏还显示账户余额、净值和保证金。 - 可以将信息价差掉期显示定位在图表的任何角落 . 点击这里查看高质量的交易机器人和指标! 这是仅在此 MQL5 网站上提供的原创产品。 ...............................................
Crypto_Forex 指标 HTF Ichimoku 适用于 MT4。 - Ichimoku 指标是最强大的趋势指标之一。HTF 表示 - 更高时间框架。 - 此指标非常适合趋势交易者以及与价格行动条目的组合。 - HTF Ichimoku 指标允许您将更高时间框架的 Ichimoku 附加到当前图表。 - 上升趋势 - 红线高于蓝线(并且两条线都在云层上方)/ 下降趋势 - 红线低于蓝线(并且两条线都在云层下方)。 - 仅当价格突破 Ichimoku 云层顶部边界时才打开买入订单。 - 仅当价格突破 Ichimoku 云层底部边界时才打开卖出订单。 - HTF Ichimoku 指标提供了捕捉大趋势的机会。 点击这里查看高质量的交易机器人和指标! 它是仅在此 MQL5 网站上提供的原创产品。
Rainbow Price Visualizer
Vincent Jose Proenca
Rainbow Price Visualizer v1.21 See where the market really breathes. Turns your MT4 chart into an ultra-precise heatmap that highlights price zones favored by big players. Why it matters 300 price levels at 0.2‑pip resolution — microscopic detail. 8 visual themes (Rainbow, Fire, Ocean…) for instant readibility. Smart opacity: low noise fades, real zones pop. Lightweight rendering with automatic cleanup. Fully customizable: saturation, opacity, resolution, history depth. Bands project into the f
Alpha Trend sign Alpha Trend sign 是我么长期以来非常受欢迎的交易工具,它可以验证我们的交易系统,并且明确的提示交易信号,并且信号不会漂移。 主要功能: •  根据市场显示活跃区域,根据指标可以很直观的判断当前行情是属于趋势行情,还是震荡行情。    并根据指标的指示箭头切入市场,绿色箭头提示买入,红色箭头提示卖出。 •  建议使用5分钟以上的时间周期进行交易,避免因为小周期波动出现频繁的交易信号。 •  您也可以开启信号提示,以免错过最佳的交易时机。 •  本指标不但可以很好的预测趋势行情,也可以在宽幅震荡行情中获利。 •  本指标本着大道至简的原则,适合不同阶段的交易者使用。 注意事项: •  Alpha Trend sign 有明确的进出场信号,不建议逆势操作,以免造成损失。 •  Alpha Trend sign 是特别成熟的指标,我们团队人手一个,使用它可以实现稳定盈利。     
Noize Absorption Index MT4
Ekaterina Saltykova
5 (1)
Noize Absorption Index - is the manual trading system that measures the difference of pressure between bears forces and bulls forces. Green line - is a noize free index that showing curent situation. Zero value of index shows totally choppy/flat market.Values above zero level shows how powerfull bullish wave is and values below zero measures bearish forces.Up arrow appears on bearish market when it's ready to reverse, dn arrow appears on weak bullish market, as a result of reverse expectation. S
Infinity Trend Pro
Yaroslav Varankin
1 (1)
This is a trend indicator without redrawing Developed instead of the binary options strategy (by the color of the Martingale candlestick) Also works well in forex trading When to open trades (binary options) A signal will appear in the place with a candle signaling the current candle It is recommended to open a deal for one candle of the current timeframe M1 and M5 When a blue dot appears, open a deal up When a red dot appears, open a trade down. How to open trades on Forex. When a signal is rec
The   Trend Duration Forecast MT4   indicator is designed to estimate the probable lifespan of a bullish or bearish trend. Using a Hull Moving Average (HMA) to detect directional shifts, it tracks the duration of each historical trend and calculates an average to forecast how long the current trend is statistically likely to continue. This allows traders to visualize both real-time trend strength and potential exhaustion zones with exceptional clarity. KEY FEATURES Dynamic Trend Detection:   Uti
PZ Divergence Trading
PZ TRADING SLU
5 (2)
棘手的发现和频率稀缺是最可靠的交易方案之一。该指标使用您喜欢的振荡器自动查找并扫描常规和隐藏的发散。 [ 安装指南 | 更新指南 | 故障排除 | 常见问题 | 所有产品 ] 容易交易 发现常规和隐藏的分歧 支持许多知名的振荡器 根据突破实现交易信号 显示适当的止损和获利水平 可配置的振荡器参数 可自定义的颜色和尺寸 按条形过滤大小差异 实现绩效统计 它实现了电子邮件/声音/视觉警报 为了提供广阔的市场前景,可以使用不同的振荡器在同一张图表中多次加载该指标,而不会产生干扰。该指标支持以下振荡器: RSI CCI MACD OSMA 随机 动量 很棒的振荡器 加速器振荡器 威廉姆斯百分比范围 相对活力指数 由于差异可能会扩大很多,尤其是在外汇市场中,因此该指标产生了转折:它在等待交易突破之前等待donchian突破确认差异。最终结果是带有非常可靠的交易信号的重新粉刷指示器。 输入参数 幅度:用于寻找差异的之字形周期 振荡器-选择要加载到图表的振荡器。 突破期-交易信号的突破期,以柱为单位。 发散类型-启用或禁用发散类型:隐藏,常规或两者。 最小散度单位为条形-最小散度单位为条形
PABT Pattern Indicator - it's classical system one of the signal patterns. Indicator logic - the Hi & Lo of the bar is fully within the range of the preceding bar, look to trade them as pullback in trend. In the way if indicator found PABT pattern it's drawing two lines and arrow what showing trend way.  - First line - it's entry point and drawing at: 1. On the high of signal bar or on middle of the signal bar (depending from indicator mode) for buy; 2. On the low of signal bar or on middle of t
The indicator detects and displays 3 Drives harmonic pattern (see the screenshot). The pattern is plotted by the extreme values of the ZigZag indicator (included in the resources, no need to install). After detecting the pattern, the indicator notifies of that by a pop-up window, a mobile notification and an email. The indicator highlights the process of the pattern formation and not just the complete pattern. In the former case, it is displayed in the contour triangles. After the pattern is com
MACDivergence MTF
Pavel Zamoshnikov
4.29 (7)
Advanced ideas of the popular MACD indicator: It detects and displays classic and reverse divergences (three methods of detecting divergences). It uses different color to highlight an uptrend and a downtrend. Two methods of determining a trend: а) MACD crosses the 0 level (classic signal); б) MACD crosses its own average (early signal). This is a multi-timeframe indicator: it can display MACD data from other timeframes. Two methods of drawing: classic histogram and line. It generates sound and v
Super Reversal Pattern
Parfait Mujinga Ndalika
Super Reversal Pattern Indicator Unlock the power of advanced pattern recognition with our Super Reversal Pattern Indicator. Designed for traders seeking precision and reliability, this indicator identifies one of the most effective reversal patterns in technical analysis, offering a significant edge in your trading strategy. Key Features: Non-Repainting Accuracy: Enjoy the confidence of non-repainting technology. Once a Super Reversal Pattern is detected, it remains static, providing consiste
Trendiness Index
Libertas LLC
5 (3)
"The trend is your friend" is one of the best known sayings in investing, because capturing large trendy price movements can be extremely profitable. However, trading with the trend is often easier said than done, because many indicators are based on price reversals not trends. These aren't very effective at identifying trendy periods, or predicting whether trends will continue. We developed the Trendiness Index to help address this problem by indicating the strength and direction of price trend
The   Trendlines Oscillator   helps traders identify trends and momentum based on the normalized distances between the current price and the most recently detected bullish and bearish trend lines. The indicator features bullish and bearish momentum, a signal line with crossings, and multiple smoothing options. USAGE The   Trendlines Oscillator   works by systematically: Identifying pivot highs and lows. Connecting pivots to form bullish (support) and bearish (resistance) trendlines. Measuring
Minotaur Waves Signal
Leandro Bernardez Camero
Minotaur Waves 是一款高精度市场分析工具,结合双重信号引擎设计,旨在识别趋势转折点并确认价格动量的变化。系统集成了强大的 Minotaur Oscillator (牛头人振荡器)与动态区间结构,提供清晰可视的非重绘入场信号,适用于所有货币对,尤其在 EURUSD、GBPUSD、USDJPY 的 M1、M5、M15 和 M30 时间周期下表现最佳。 获取最新更新和操作指南: https://www.mql5.com/en/channels/forexnewadvisor 系统核心组成: 动态区间系统: 实时跟踪价格动量变化,展示关键趋势与突破区域 Minotaur Oscillator: 通过柱状图展示动量极值,精确确认买卖转折点 信号逻辑与入场条件: 交易信号仅在价格行为与振荡器状态共同满足下生成,满足以下全部条件时发出交易提醒: Minotaur Oscillator 出现已确认极值: 高点为 +33 (买入),低点为 -33 (卖出) 价格突破动态区间的关键确认水平 所有计算基于已收盘的K线 ,确保信号不重绘且稳定可靠 在满足以上条件后,系统将触发: 多通道提
Stochastic Divergen MT4
Komang Putra Riswanjaya
Overview The Stochastic Divergence Indicator is a tool designed to help identify potential market turning points by analyzing divergences between price and the Stochastic Oscillator. It highlights divergence signals visually on the chart, assisting traders in observing possible trend changes. Key Features No Repaint: Once a signal is formed, it remains on the chart. Adjustable Parameters: Settings can be modified to fit different trading preferences and timeframes. Visual Display: Arrows are pl
这是一个预测蜡烛收盘价的指标。 该指标主要用于 D1 图表。 该指标适用于传统外汇交易和二元期权交易。 该指标可以用作独立的交易系统,也可以作为您现有交易系统的补充。 该指标分析当前蜡烛,计算蜡烛本身内部的某些强度因素,以及前一根蜡烛的参数。 因此,该指标预测市场走势的进一步方向和当前蜡烛的收盘价。 由于这种方法,该指标既适用于短期盘中交易,也适用于中长期交易。 该指标允许您设置指标在分析市场情况期间将产生的潜在信号的数量。 在指标设置中有一个特殊的参数。 此外,该指标可以通过图表上的消息、电子邮件以及推送通知的形式通知新信号。感谢您的关注!交易愉快! 购买后一定要写信给我! 我会给你我的交易指标的建议! 还可以获得奖金!
SuperTrend V
Muhammad Hassaan
*This is TradingView indicator converted to mql4* The SuperTrend V indicator is a popular technical analysis tool used to identify trends and potential trend reversals in financial markets. It is based on the concept of the SuperTrend indicator but incorporates additional features and variations. The SuperTrend V indicator uses a combination of price action and volatility to determine the trend direction and generate trading signals. Here are the key components and features of the indicator: Ca
FREE
该产品的买家也购买
Neuro Poseidon MT4
Daria Rezueva
4.94 (35)
Neuro Poseidon is a new indicator by Daria Rezueva. It combines precise trading signals with adaptive TP/SL levels - creating best possible trades as a result! Message me and get  Neuro Poseidon Assistant  as a gift to automize your trading process! What makes it stand out? 1. Proven profitability on all assets and timeframes 2. Only confirmed BUY and SELL signals present on the chart 3. Adaptive TP & SL levels generated by the software for each trade 4. Easy to understand - suitable for all
Advanced Supply Demand
Bernhard Schweigert
4.91 (300)
现在优惠 30%! 任何新手或专业交易者的最佳解决方案! 该指标是一款独特、高质量、且价格合理的交易工具,因为我们已经整合了许多专有功能和新公式。 依据此更新,您将能够显示双重时间帧区域。 您不仅可以显示一个较高的时间帧,还可以同时显示图表时间帧,加上更高的时间帧:显示嵌套时区。 供需双方所有交易者都会喜欢它。 :) 重要信息披露 高级供需的最大潜力,请访问 https://www.mql5.com/zh/blogs/post/720245   想象您的交易如何得以改善,是因为您能够精准定位入场或目标位吗? 构建于新的底层算法,它可以更轻松地识别出买卖双方之间的潜在失衡。 这是因为它以图形方式展示供需最强劲区域,及其过去的表现(显示旧区域)。 这些功能旨在帮助您更轻松地发现最佳入场区域和价位。 现在您可以针对您的交易品种和时间帧来优化和编辑区域强度! 高级供需指标适用于所有产品和时间帧。 它是一个新的公式,非常新的功能是两个区域强度函数可由用户输入进行调整! 这在交易中是一大优势。 当您学习如何使用专有功能,例如带有价格游离最小 X 因子的区域强度时,您能够判断该区域强劲与否。 供需
本指标是实践实战交易完善的波浪自动分析的指标 !  案例... 注: 波浪分级用西方叫法不习惯,因受到缠论(缠中说禅)命名方式习惯的影响,我是将基础波浪命名为 笔 ,将二级波段命名为 段 ,同时具有趋势方向的段命名为 主趋段 (以后笔记中都是这种命名方式,先告知大家),但是算法上和缠论关系不大切勿混淆.反映的是本人分析盘面总结的 千变万化纷繁复杂的运行规律 . 对波段进行了标准化定义,不再是不同人不同的浪  ,    对人为干扰的画法进行了排除,在严格分析进场起到了关键的作用 . 使用这个指标,等于将交易界面提升美感,抛弃最原始的K线交易带你进入新的交易层次.如果不是为了交易,在宣传上也将使客户观感提升层次. 指标内容: 1. 基础波浪 (笔) : 首先我们找出了价格波动过程中的基础波动拐点,当然他的有序性低,为下一步的计算提供基础. 2. 二级波段( 段 ) :在基础波浪的基础上,通过算法分析得到层级更明显的二级波段,二级波段为波浪提供了分析基础 3. 波浪( 浪 ): 有着更清晰的趋势,更清晰直观的方向.分析一个波浪是否延续,需要看二级波段的形态,分析二级的构成,可以得出波浪
Scalper Inside PRO
Alexey Minkov
4.74 (68)
Scalper Inside PRO Scalper Inside PRO 是一款适用于 MetaTrader 4 的日内趋势与剥头皮指标,使用专有算法快速识别市场方向和关键目标价位。它能够自动计算进场价、出场价以及多级止盈目标,并显示详细的绩效统计,让您了解不同交易品种和策略以往的表现情况,从而帮助您为当前的市场环境选择最合适的交易工具。此外,您还可以将自己的箭头指标轻松接入 Scalper Inside PRO,快速评估其统计数据和历史表现。 该指标可用于任何交易品种和任何周期(建议在 M5 上进行日内交易),并内置多种交易策略,因此既可以作为独立的剥头皮工具使用,也可以作为您交易系统中功能强大的分析组件。 主要功能 通过专有算法(Next‑Generation Trend Detection Algorithm,NG TDA)快速识别当前市场趋势。 自动计算日内交易的进场价、出场价和多级止盈目标。 内置策略与统计模块,用于评估不同市场环境下各品种的表现。 支持接入自定义箭头指标(PRO 模式),并计算其详细信号统计数据。 适用于外汇、金属、指数、股票、商品、期货和加密货币等各类市
Breakout Arrows Mt4
Michael Oko Oboh
5 (1)
Trend Breakout Arrows Indicator The Trend Breakout Arrows Indicator is a momentum-based signal tool designed to identify potential bullish and bearish breakout opportunities. It displays clear arrow signals directly on the price chart, helping traders quickly recognize possible trend changes and continuation setups. Up Arrow (Buy Signal) A magenta up arrow appears below a candle when bullish momentum begins to strengthen. This signal indicates that buying pressure may be overtaking selling press
Current event:  https://c.mql5.com/1/326/A2SR2025_NoMusic.gif A. 什么是 A2SR ?   * 这是一个领先的技术指标(没有重绘,没有滞后)。  -  指导 : -- 在  https://www.mql5.com/en/blogs/post/734748/page4#comment_16532516 -- 和  https://www.mql5.com/en/users/yohana/blog A2SR 在确定支撑(需求)和阻力(供应)水平方面有一种特殊的技术。 与我们在网上看到的普通方式不同,A2SR 在确定实际 SR 级别时有一个独创的概念。 原技术不是从网上拿来的,也没有在网上公开过。 A2SR 将根据您的交易风格自动选择 SR 级别。 即使您正在更改时间范围,但 SR 级别仍将保留在其位置上。 因为实际的 SR 不是从你使用的时间范围内获得的。 A2SR 拥有完整的交易工具 。 实际支持(需求)和阻力(供应)的真正概念。 新闻事件和央行讲话的市场情绪。 新闻事件和趋势的主要货币强度 (MCS) 的真正概念
MetaBands M4
Vahidreza Heidar Gholami
3.5 (6)
MetaBands使用强大且独特的算法绘制通道并检测趋势,以便为交易者提供进出交易的潜在点。它是一个通道指标和强大的趋势指标。它包括不同类型的通道,可以通过使用输入参数简单地合并以创建新通道。MetaBands使用所有类型的警报通知用户市场事件。 功能 支持大多数通道算法 强大的趋势检测算法 能够合并不同类型的通道 多时间帧和多货币(信号矩阵) 所有类型的警报功能(声音、屏幕闪烁、推送通知、电子邮件、弹出窗口、箭头) 它永远不会重绘 趋势检测 MetaBands使用在通道内振荡的蓝色线来检测趋势。当该线遇到通道的上界时,表明开始下跌趋势,当它遇到下界时,表明开始上涨趋势。如果蓝线接近中线,则市场处于整理期。 该指标使用独特的方法来检测趋势。一开始可能看起来有些复杂,但如果您观看视频教程,您就会意识到它是多么强大且易于使用。 入场和出场信号 当趋势变化或价格穿过上下通道时,MetaBands会立即通过不同的方法提醒交易者,这些方法可以在指标设置中启用。 信号矩阵 要监视来自不同时间框架的多个符号并在一个地方查看信号,请单击右上角按钮或按键盘上的M键以打开信号矩阵。该矩阵可以快速概览
本产品已针对 2026 年市场进行更新,并针对最新 MT5 版本进行了优化。 价格更新通知: Smart Trend Trading System 目前价格为 $99 。 接下来的 30 次购买 后,价格将上涨至 $199 。 特别优惠: 购买 Smart Trend Trading System 后,请发送私信给我,即可免费领取 Smart Universal EA ,并将您的 Smart Trend 信号转换为自动交易。 Smart Trend Trading System 是一套完整的交易系统,具备不重绘、不回绘、不延迟的特点,专为希望获得更清晰信号、更准确趋势方向以及更有组织交易方式的交易者打造。 Online course , manual and download presets . 它将 10 多种交易工具 整合到一个系统中,包括趋势检测、反转区域、Smart Cloud、移动止损逻辑、支撑与阻力、K线着色、提醒以及多周期分析。 该系统旨在帮助您应对不同的市场环境: 趋势市场: 识别主要趋势,发现回调,跟随动能,并通过止损指导和移动止损选项寻找更清晰的入场机会。 震荡
Dynamic Forex28 Navigator
Bernhard Schweigert
4.43 (7)
Dynamic Forex28 Navigator - 下一代外汇交易工具。 当前 49% 折扣。 Dynamic Forex28 Navigator 是我们长期流行的指标的演变,将三种功能合二为一: 高级货币强度 28 指标 (695 条评论)+ 高级货币 IMPULSE 带警报 (520 条评论)+ CS28 组合信号(奖励)。 有关指标的详细信息 https://www.mql5.com/en/blogs/post/758844 下一代强度指标提供什么? 您喜欢的原始指标的一切,现在通过新功能和更高的精度进行了增强。 主要特点: 专有货币强度公式。  所有时间范围内的平滑和准确的强度线。 非常适合识别趋势和精确进入。 动态市场斐波那契水平(市场斐波那契)。  此指标独有的独特功能。 斐波那契应用于货币强度,而不是价格图表。 适应实时市场活动以获得准确的反转区域。 实时市场动量。  第 9 行显示市场是活跃还是被动。 对于定时交易至关重要。 全面的警报和显示。  每种货币最强的买入和卖出动量。 ​​28 对的双重动量买入和卖出。 超买/超卖警告外部范围和止损。 反转
BTMM State Engine Pro MT4
Garry James Goodchild
BTMM State Engine Pro is a MetaTrader 4 indicator for traders who use the Beat The Market Maker approach: Asian session context, kill zone timing, level progression, peak formation detection, and a multi-pair scanner from a single chart. It combines cycle state logic with a built-in scanner dashboard so you do not need the same tool on many charts at once. What it does Draws the Asian session range; session times can follow broker server offset or be set in inputs. Tracks level progression (L
IQ FX Gann Levels
INTRAQUOTES
5 (2)
IQ FX Gann Levels a precision trading indicator based on W.D. Gann’s square root methods . It plots real-time, non-repainting support and resistance levels to help traders confidently spot intraday and scalping opportunities with high accuracy. William Delbert Gann (W.D. Gann) was an exceptional market analyst, whose trading technique was based on a complex blend of mathematics, geometry, astrology, and ancient mathematics which proved to be extremely accurate. Setup & Guide:  Download  MT5 Ver
Neo Wave PRO
Nikolay Raykov
5 (1)
Price & Time Market Structure Indicator A professional market structure tool that analyzes waves through both price and time — not price alone. Main Description NeoWave PRO is a professional market structure indicator for MetaTrader 4 designed for traders who want to move beyond traditional one-dimensional wave tools such as ZigZag, swing indicators, and basic high/low systems. Most wave indicators analyze only one thing: Price. But a real market wave is not only a price movement. A true wave de
GOLD Impulse with Alert
Bernhard Schweigert
4.67 (12)
这个指标是我们2个产品 Advanced Currency IMPULSE with ALERT  +   Currency Strength Exotics 的一个超级组合。 它适用于所有时间框架,并以图形方式显示8种主要货币和一种符号的强势或弱势冲动! 该指标专门用于显示任何符号的货币强度加速,如黄金、异国货币对、商品、指数或期货。这是它的第一个指标,任何符号都可以被添加到第9行,以显示黄金、白银、石油、DAX、US30、MXN、TRY、CNH等的真实货币强度加速(冲动或速度)。 建立在新的基础算法上,它使识别和确认潜在的交易更加容易。这是因为它以图形方式显示了一种货币的强势或弱势是否正在加速,并测量了这种加速的速度--把它想象成你汽车中的速度表。当你加速时,事情显然会发生得更快,这在外汇市场上也是一样的,即如果你配对的货币正在向相反的方向加速,你就会发现一个潜在的有利可图的交易。 动态市场斐波那契28水平被用作警报触发器,将适应市场活动。如果冲动击中黄色触发线,你将收到警报。然后你就知道作为一个交易员应该做什么。货币对和方向已经给出。只需点击警报按钮,就可以切换到该货
另有 MT5 版本可供选择 https://www.mql5.com/zh/market/product/170916 M30/H1/H4 波段版已上线 想抓住M5/M15无法捕捉的大行情? Gold Signal Swing Pro(M30/H1/H4)现已发售。 目标每笔$20-$80+。 https://www.mql5.com/en/market/product/177643 KURAMA GOLD SIGNAL PRO(MT4版)— 7层过滤器、自动TP/SL、品质评分搭载 XAUUSD完整交易系统 不重绘。不重画。不延迟。每个信号永久固定。所见即所得。 福利:购买买断版许可证可免费获得 AI Zone Radar(价值$59)+ 完整PDF手册。购买后请给我发消息。 AI Zone Radar: https://www.mql5.com/en/market/product/175834 交易员的信赖:已被活跃的黄
Enigmera
Ivan Stefanov
5 (8)
ENIGMERA: 市场的核心 重要提示:MQL5.com 演示版本在策略测试器中运行,可能无法完全反映 Enigmera 的功能。请查看描述、截图和视频了解详细信息。如有任何问题,请随时联系我! 该指标的代码已完全重写。版本 3.0 增加了新功能并修复了自指标发布以来积累的错误。 简介 这个指标和交易系统是金融市场的一种独特方法。ENIGMERA 使用分形周期来精确计算支撑和阻力水平。它展示了真实的积累阶段,并提供了方向和目标。无论是在趋势中还是在修正中,这个系统都能工作。 它是如何工作的 指标的大部分功能通过图表左侧的按钮控制,使得能够快速响应不同的市场情况。 按钮 ON/OFF – 显示或隐藏整个指标。 Channel – 激活支撑通道,显示可接受的偏差范围。 Dev1 (第一偏差) – 指示价格在支撑偏差内的波动,信号表示市场正在整合或积累力量。 Dev2 (第二偏差) – 显示价格在偏差之间的波动,表示趋势形成和方向。 Dev3 (第三偏差) – 表示趋势的显著加速和高波动性。 45deg (45度) – 显示市场的节奏和相对于 45 度线的运动稳定性。 Tgt1/2
Harmonic Pattern Plus MT4
Young Ho Seo
4.44 (18)
Introduction Harmonic Patterns are best used to predict potential turning point. Traditionally, Harmonic Pattern was identified manually connecting peaks and troughs points in the chart. Manual harmonic pattern detection is painfully tedious and not suitable for everyone. You are often exposed under subjective pattern identification with manual pattern detection. To avoid these limitations, Harmonic Pattern Plus was designed to automate your harmonic pattern detection process. The functionality
地震仪 市场地震探测器。 Description in English : https://www.mql5.com/en/market/product/113869?source=Site+Market+Product+Page#description How to use the Seismograph : https://www.mql5.com/en/market/product/113869#!tab=comments&page=2&comment=52806941 Create an EA : https://www.mql5.com/en/market/product/113869#!tab=comments&page=3&comment=52816509 无论您以何种方式交易,您都绝对希望避免进入低流动性市场。 然而,即使你确保在应该繁忙的市场时间进入,事实是许多人经常被困在流动性低的市场中。 经过几个小时的等待,市场突然变得繁忙起来,但是......事实证明,现在很多人都站在了与市场相反的方向上。 如果人们不得不等待浮动负数需要很长时间,甚至人们不得不止
Delta Fusion Pro
Francesco Secchi
5 (2)
Delta Fusion Pro – 高级订单流分析,专为日内交易设计 Delta Fusion Pro 是一款专业的 MetaTrader 4 指标,能够揭示市场中的主动订单流,实时显示机构压力的强度和方向。与传统的成交量指标不同,它分析买盘(Ask)与卖盘(Bid)之间的成交量差值(Delta),用于提前预测反转、确认趋势并识别专业兴趣区域。 主要特点 智能自动调节系统 根据以下条件自动调整所有参数: 交易品种类型(外汇、加密货币、指数、大宗商品、股票) 操作周期 市场波动率(ATR) 最近平均成交量 无需手动配置,适合新手交易者——指标自动完成校准! 核心功能 净Delta与累计Delta 计算主动买盘/卖盘成交量差值,支持自定义 EMA 平滑 实时显示方向性压力 可自定义直方图颜色(买入/卖出) 价格/成交量背离 自动检测常规与隐藏背离 强度分类:强/中/弱 高级过滤:成交量确认、趋势、时间距离 图形信号(彩色箭头) 市场失衡 识别显著的买盘/卖盘比例失衡(可配置比率) 最小成交量阈值验证 图表显示彩色点(多头/空头) Infusion Volume 检测异常成交量峰值(
Trend Lines PRO
Roman Podpora
5 (1)
TREND LINES PRO 帮助您了解市场真正的方向转变点。该指标显示真实的趋势反转点以及主要参与者重新入场的时机。 您可以看到 BOS线、 趋势变化和更高时间框架的关键水平——无需复杂的设置或不必要的干扰。信号不会重绘,并在K线收盘后仍然保留在图表上。 VERSION MT 5    -   与……搭配使用时,可发挥其最大潜力   RFI LEVELS PRO 指示器 该指标显示的内容: 实际变化 趋势(BOS 线) 一旦信号出现,它就始终有效!这与会重绘的指标有着重要的区别,后者可能会发出信号后又改变信号,从而导致资金损失。现在,您可以更精准、更准确地进入市场。此外,还有一个功能,会在箭头出现后为K线着色,直到达到目标价位(止盈)或出现反转信号为止。 重复条目   以及主要玩家的充值 为了提高寻找入场点时的视觉清晰度,我们创建了一个模块,该模块首先显示买入/卖出区域,并在该区域内寻找最佳入场点。此外,我们还加入了智能逻辑来管理止损位,该逻辑会随着时间的推移逐步降低止损位的大小,从而降低入场交易时的初始风险(移动止损位)。 信号强度水平(BOS) 该指标采用三个显著性等级来衡量
The Propfolio Master Suite is the ultimate all-in-one analytical workstation for professional traders. Combining the power of the Beat The Market Maker (BTMM) methodology, Smart Money Concepts (SND/Liquidity), and Advanced Volume Profile, this suite replaces multiple different indicators with one optimized engine. Monitor up to 14 pairs simultaneously from a single chart, instantly identify market cycles, and seamlessly map institutional footprints with the click of a button. The Command Center
RFI levels PRO
Roman Podpora
5 (1)
该指标能够准确显示反转点和价格回落区域。     行业领军人物 。您能洞察新趋势的形成,并以最高的精准度做出决策,掌控每一笔交易。 与……结合时,展现其最大潜力     趋势线专业版   指标  VERSION MT5 该指标显示的内容: 新趋势开始时的反转结构和反转水平及其激活。 显示屏   获利了结   和   止损   风险回报比最低的水平     RR 1:2       。 具有智能减值逻辑的止损。 显示指定指标中两种趋势类型的反转形态。 指标: 根据     趋势线     (全球趋势变化) 潮流专业版     (趋势快速变化) 简单有效   扫描器   实时趋势(新增)。 多时间框架工具筛选。 展示   利润   在 LOGIC AI 信号之后。 以下列出今日走势积极的金融工具。(RB键) 能够为终端启用通知(警报)功能,并向移动设备推送通知。 逻辑人工智能     — 利用人工智能寻找最佳切入点。 只有在启用 MTF(多时间框架分析)模式时,该功能才可用。 兼容性。 当与趋势线指标结合使用时,该指标能发挥其最大潜力。 这     RFI LEVELS PRO    
Advanced Currency IMPULSE with ALERT
Bernhard Schweigert
4.9 (490)
目前40%的折扣!! 对任何新手或专家交易者来说都是最好的解决方案! 这个指标是一个独特的、高质量的、负担得起的交易工具,因为我们已经纳入了一些专有的功能和一个秘密的公式。只需一张图表,它就能给出所有28种货币对的警报。想象一下,你的交易将如何改善,因为你能够准确地确定新趋势或剥头皮机会的触发点 建立在新的基础算法上,它使识别和确认潜在交易变得更加容易。这是因为它以图形方式显示了一种货币的强势或弱势是否正在加速,并测量了这种加速的速度--把它想象成你汽车中的速度表。当你加速时,事情显然会发生得更快,这在外汇市场上也是一样的,即如果你配对的货币正在向相反的方向加速,你就会发现一个潜在的有利可图的交易。 货币动量的垂直线和箭头将指导你的交易! 动态的市场斐波那契23水平被用作警报触发器,将适应市场活动。如果冲动触及黄色触发线,您将在MetaTrader或您的电子邮件或推送警报中收到警报。然后你就知道作为一个交易员应该做什么。货币对和方向已经给出。只要点击警报按钮,就可以切换到该货币对或打开一个新的图表,以便进一步分析。警报级别可以通过用户输入来改变,可以选择3个敏感度级别。 尽
IQ FX Strength  answers the single most important question in trading: "Who is truly driving the market right now?" Designed with a stunning Hybrid UI, this tool separates true trend moves from market noise, allowing you to catch "Explosive" moves before the crowd sees them. System Requirement: For higher accurate signal and optimal, smoother performance of this indicator without any lag, a good CPU (with   RAM of  atleast 8GB or above) and fast internet connection is highly recommended. IQ FX
RelicusRoad Pro
Relicus LLC
4.65 (107)
RelicusRoad Pro: 量化市场操作系统 终身访问限时 70% 折扣 - 加入 2,000+ 交易员社区 为什么大多数交易者即使拥有“完美”指标也会失败? 因为他们在真空中交易 单一概念 。没有背景的信号是赌博。要持续获胜,您需要 共振 (CONFLUENCE) 。 RelicusRoad Pro 不是一个简单的箭头指标。它是一个完整的 量化市场生态系统 。它描绘价格运行的“公允价值之路”,区分市场噪音和真实的结构性突破。 停止猜测。开始用机构级“路”逻辑进行交易。 核心引擎:“Road” (路) 算法 系统的核心是 Road Algo ,一个实时适应市场条件的动态波动率通道。它投射出 安全线 (平衡) 和价格可能反转的 扩展水平 。 Simple Road: 典型市场的标准结构映射。 Smooth Road: 针对震荡盘整的降噪计算。 Breakout Road: 专为识别波动率扩张和爆发性走势而调整。 1. 算法动量与确认 我们的“剥头皮箭头”不只是简单的交叉。它们利用 高阶多项式逻辑 过滤噪音,确保信号与主周期一致。我们检测动量、价格行为和 Road 结构汇聚的精确入场
PZ Harmonacci Patterns
PZ TRADING SLU
3.17 (6)
可以说,这是您可以为MetaTrader平台找到的最完整的谐波价格形成自动识别指标。它检测19种不同的模式,像您一样认真对待斐波那契投影,显示潜在的反转区域(PRZ),并找到合适的止损和获利水平。 [ 安装指南 | 更新指南 | 故障排除 | 常见问题 | 所有产品 ] 它检测19种不同的谐波价格形态 它绘制了主要,衍生和互补的斐波那契投影(PRZ) 它评估过去的价格走势并显示每个过去的形态 该指标分析其自身的质量和性能 它显示合适的止损和获利水平 它使用突破来表明合适的交易 它在图表上绘制所有样式比率 它实现了电子邮件/声音/视觉警报 受斯科特·M·卡尼(Scott M. Carney)的书的启发,该指标旨在满足最纯粹和最熟练的交易者的需求。但是,它采取了一种使交易更容易的方式:在向交易发出信号之前,它会等待Donchian朝正确方向突破,从而使交易信号非常可靠。 斐波那契投影与向量无关 它实现了电子邮件/声音/推送警报 它绘制了ABCD投影 重要提示: 为了符合 Scott M. Carney先生 的商标申诉,某些图案名称已重命名为不言自明的替代方式, Scott M.
NAM Order Blocks
NAM TECH GROUP, CORP.
3.67 (3)
MT4多時限訂單塊檢測指示器。 特徵 -在圖表控制面板上完全可自定義,提供完整的交互。 -隨時隨地隱藏和顯示控制面板。 -在多個時間範圍內檢測OB。 -選擇要顯示的OB數量。 -不同的OB用戶界面。 -OB上的不同過濾器。 -OB接近警報。 -ADR高低線。 -通知服務(屏幕警報|推送通知)。 概括 訂單塊是一種市場行為,它指示從金融機構和銀行收取訂單。著名的金融機構和中央銀行帶動了外匯市場。因此,交易者必須知道他們在市場上正在做什麼。當市場建立訂單塊時,它會像發生大多數投資決策的範圍一樣移動。 訂單建立完成後,市場將朝著上升和縮小的方向發展。訂單大宗交易策略的關鍵術語是它包括機構交易者正在做的事情。由於它們是主要的價格驅動因素,因此包括機構交易在內的任何策略都可以。 您將在任何時間範圍內實時看到訂單塊,使用我們的控制面板,您將能夠在所選的歷史記錄週期內檢測常規,拒收和未大寫的訂單塊。 現在您可以接收到訂單塊接近警報,我們在MT4上顯示屏幕通知,並將通知推送到您的手機!
Introduction to Fractal Pattern Scanner Fractal Indicator refers to the technical indicator that makes use of the fractal geometry found in the financial market. Fractal Pattern Scanner is the advanced Fractal Indicator that brings the latest trading technology after the extensive research and development work in the fractal geometry in the financial market. The most important feature in Fractal Pattern Scanner is the ability to measure the turning point probability as well as the trend probabi
Smart Price Action Concepts
Issam Kassas
4.77 (13)
本产品已针对 2026 年市场进行更新,并针对最新 MT5 版本进行了优化。 价格更新通知: Smart Price Action Concepts 目前价格为 $200 。 接下来的 30 次购买 后,价格将上涨至 $299 。 特别优惠: 购买后,请发送私信给我,即可领取 免费赠品 + 礼物 。 首先需要强调的是,这款交易工具是不重绘、不回绘、不延迟的指标,因此非常适合专业交易使用。 Online course , and manual Smart Price Action Concepts 指标是一款非常强大的工具,适合新手和有经验的交易者使用。它将 20 多个实用指标整合到一个系统中,结合了 Inner Circle Trader Analysis 和 Smart Money Concepts Trading Strategies 等高级交易理念。该指标专注于 Smart Money Concepts,帮助交易者理解大型机构如何交易,并辅助预测其市场行为。 它特别擅长流动性分析,使交易者更容易理解机构交易逻辑。它也非常适合预测市场趋势并仔细分析价格走势。通过让交易与机构策略保
KT Alpha Hunter Arrows MT4
KEENBASE SOFTWARE SOLUTIONS
大多数箭头指标只给你一个信号,然后把剩下的判断全部留给你自己。KT Alpha Hunter Arrows 给你的,是一套完整的交易计划。 每一个信号箭头出现时,图表上都会同时绘制完整计划:入场线、止损位、四个止盈目标,以及实时 Edge 结论,告诉你当前品种和时间周期是否值得交易。套装中还包含 Trade Manager EA,在你手动入场后负责后续执行,让你在市场波动和情绪干扰下依然保持纪律。非重绘。只在K线收盘后给出信号。适用于 Forex、黄金、指数,以及你交易的其他任何品种。 核心功能 非重绘买入和卖出箭头,只在K线收盘后出现。 每个信号都带有入场线、结构性止损和四个止盈目标。 Edge Dashboard 会分别评估当前图表上的买入和卖出机会。 结论系统:No Edge、Marginal、Tradeable、Good 或 Strong。 一键 Auto Optimize 按钮,可根据当前品种和时间周期自动调整设置。 完整套装包含 Trade Manager EA,并内置五种专为本指标设计的交易管理方案。 Prop Firm Risk Panel 可在图表上实时追踪日内回撤
该指标旨在与艾略特波浪理论相结合,提供了两种不同的工作方式: 自动工作: 在此模式下,指标会自动检测图表上的所有五个动机波浪,并为您提供预测和潜在的逆转区域。它还可以提供警报和推送消息。这种自动功能简化了识别和分析艾略特波浪模式的过程。 手动工作: 此选项适用于喜欢手动方法的交易员,用于手动绘制九个不同等级的波浪。每个等级都可以在它们出现后通过调整图表上的绘制线条来单独定义。此功能简化了手动绘制波浪的过程,使其更加高效。需要注意的是,所有绘图数据将保存在平台的数据文件夹中,以备将来参考。 参数: Name: 指标名称。 Use_System_Visuals: 启用或禁用指标主题,以匹配交易平台的整体外观。 Explain_Comment: 允许启用或禁用波浪编号的解释性注释,有助于理解已识别的波浪。 Show_Last_Candle_Counter: 启用或禁用蜡烛计时器,提供有关当前蜡烛收盘的剩余时间的信息。 Candle_Counter_Color: 蜡烛计时器文本的颜色。 Basic_Wave_Color: 用于表示波浪的主要颜色。 Bullish_Wave_Color: 当检测
作者的更多信息
EXTRCT – Telegram Signal to MT4 Let your chart listen, so you can live louder. Too busy to track Telegram trade signals? EXTRCT reads and trades them for you — directly in MT4. No Python. No API. No login required. Features: Freedom: Enter any public Telegram signal provider's channel username without needing to log in. Configurable Signal Format: Supports various signal formats, fully configurable via the settings. Symbol Filter: The EA will ignore signals for symbols not defined in the settin
MRPHN Overdosed EA
Affifuddin Bin Mohd Hazam
MRPHN Overdosed is a trend-following Expert Advisor built for XAUUSD , powered by a custom Supertrend indicator : iMRPHN (included for free). It combines simplicity and flexibility, offering optional Martingale logic, configurable risk settings, and time-based trading filters — ideal for traders who prefer a set-and-forget approach. Tested on :  XAUUSD Strategy : Trend-following using iMRPHN indicator Trade Timing Control : User-defined trade start & end time Take Profit / Stop Loss : Fully con
筛选:
无评论
回复评论