TitanSignal

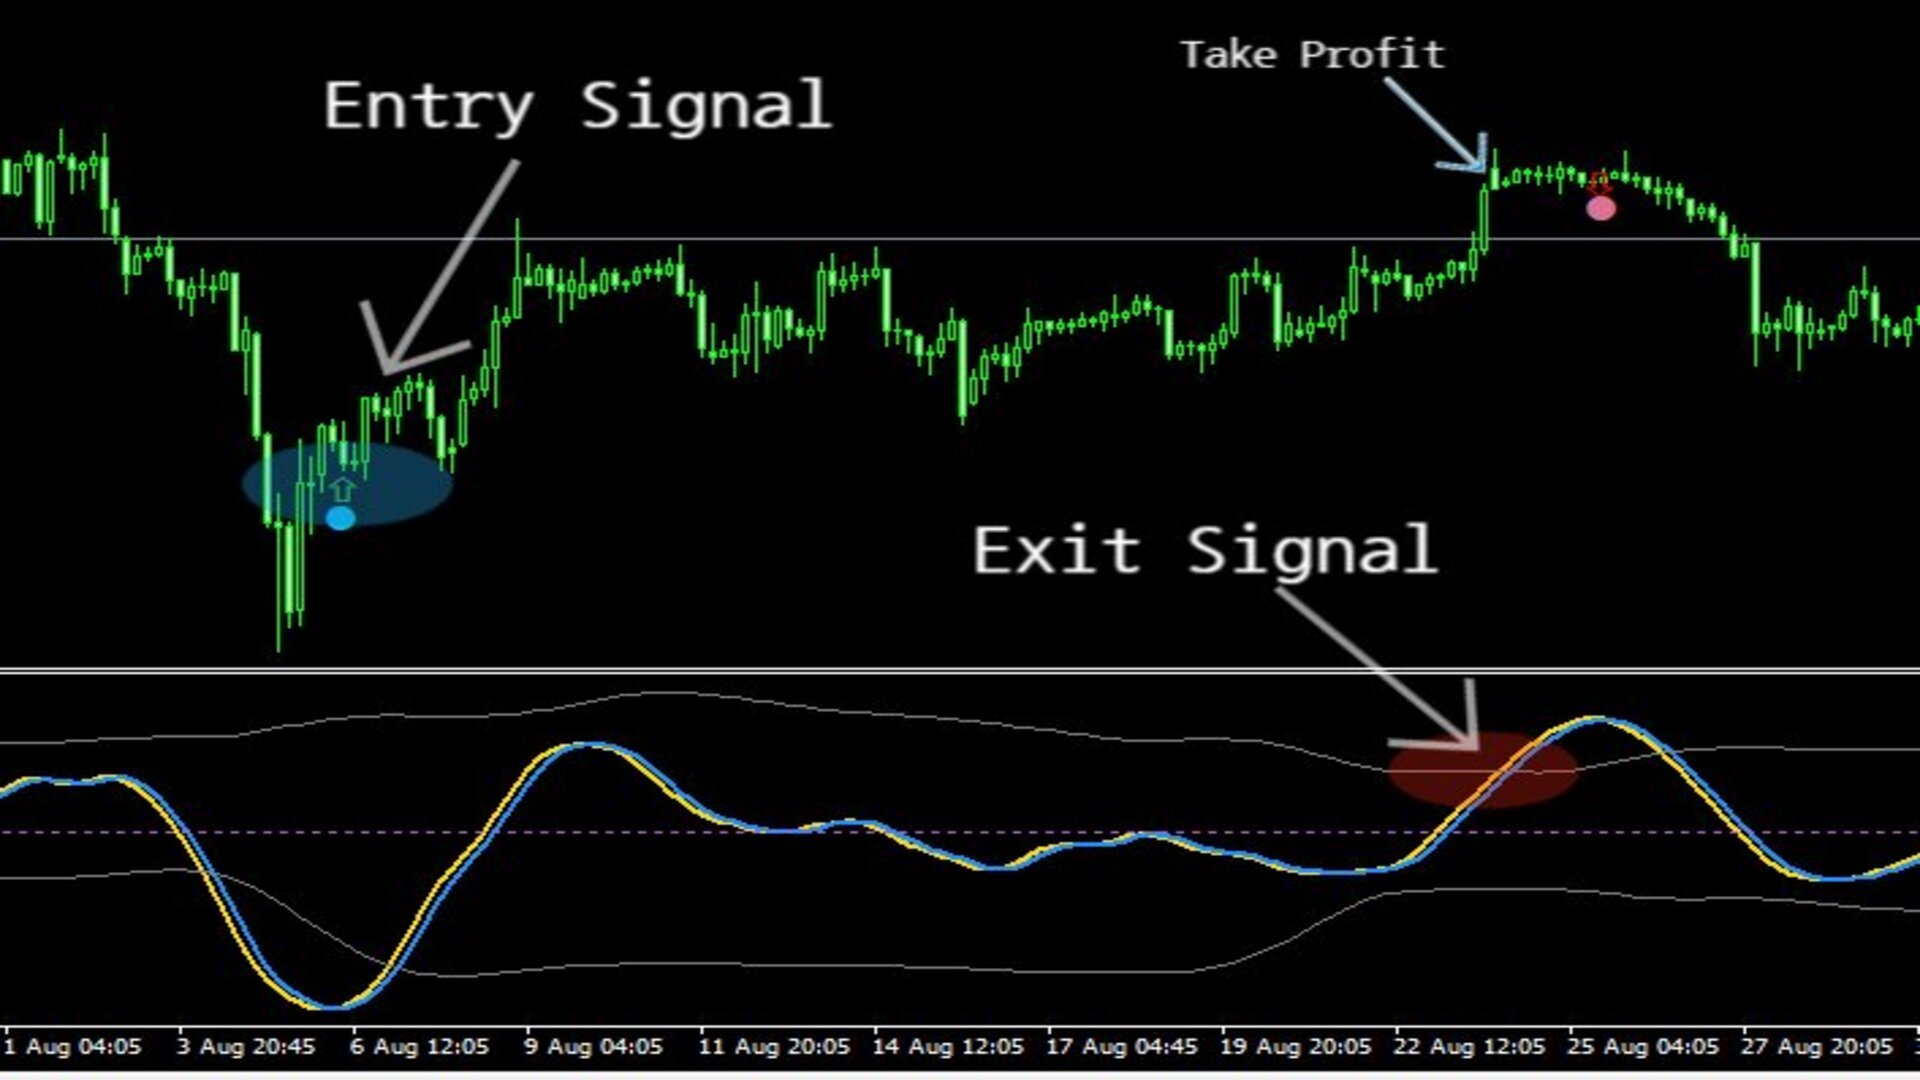
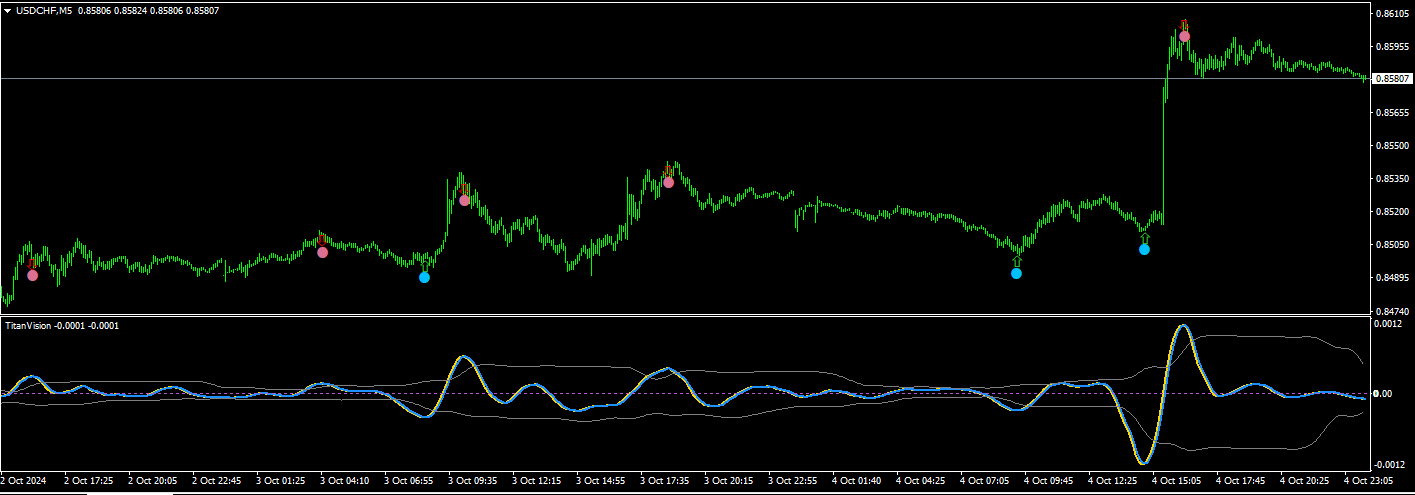
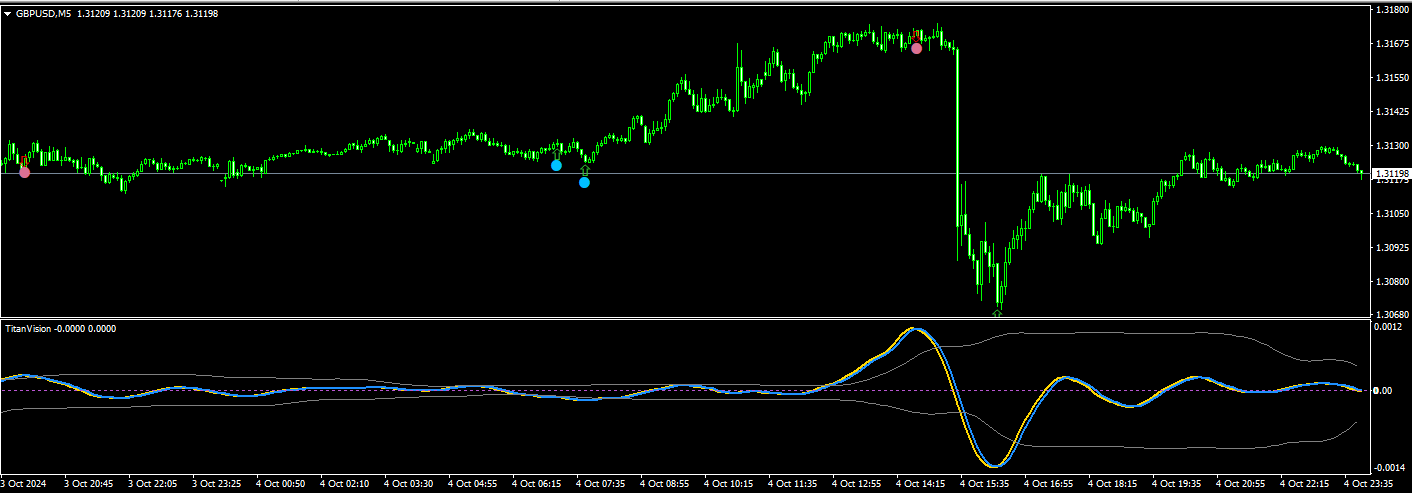
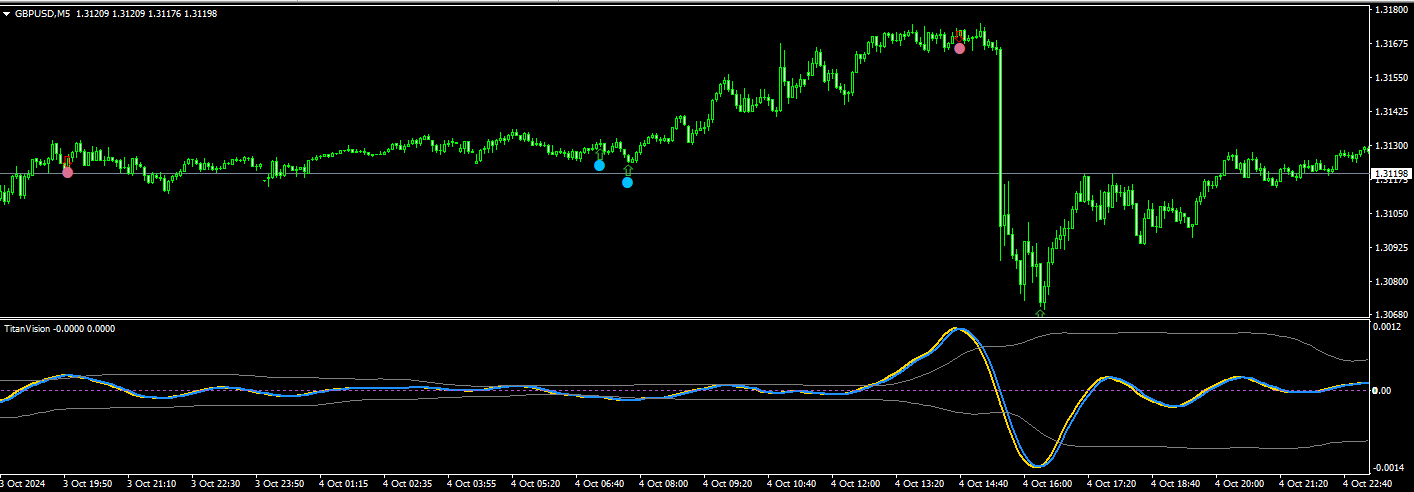
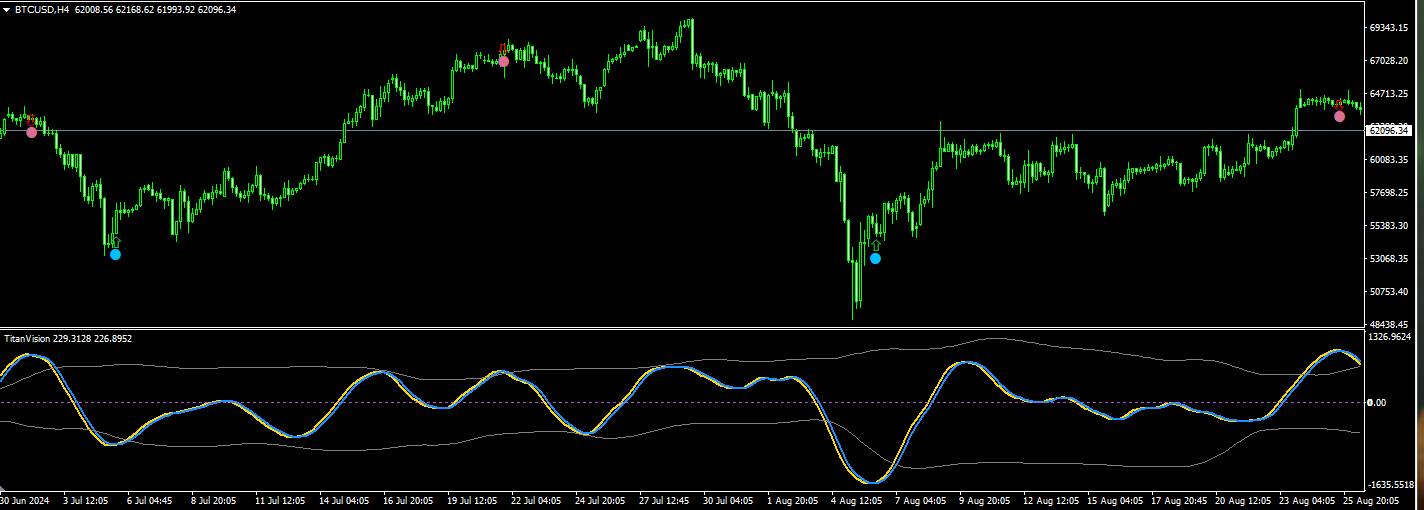
TitanVision indicator is a versatile technical analysis tool that helps traders identify market trends and potential entry and exit points. It features a dynamic Trend Catcher Strategy, adapting to market conditions for a clear visual representation of trend direction and various trend reversal points. Traders can customize the parameters according to their preferences.
The indicator helps in identifying trends, signals possible reversals, acts as a trailing stop mechanism and provides real-time alerts for immediate market responses, doesn't matter whether you are an expert or a beginner, Titan vision will help you make decisions and analyze the market for you.

Features:

- Trend Identification: Signals bullish and bearish trends.
- Trend Reversals: Warns of possible reversals when the colors of the candles change from bullish to bearish and vice versa.
- Real-Time Alerts: Generates alerts for identifying new trends.

Recommendations:

- Currencies and Pairs:      All Pairs
- Time Frames:                 M5/M15/M30/H1/H4
- Account Types:               Any ECN account, low spread account


推荐产品
The indicator draws trend lines based on Thomas Demark algorithm. It draws lines from different timeframes on one chart. The timeframes can be higher than or equal to the timeframe of the chart, on which the indicator is used. The indicator considers breakthrough qualifiers (if the conditions are met, an additional symbol appears in the place of the breakthrough) and draws approximate targets (target line above/below the current prices) according to Demark algorithm. Recommended timeframes for t
High Low Predict
Thomas Bradley Butler
This indicator is designed to help you forecast the potential high and low prices for the current trading day, based on the high and low of the previous day. It does this by applying a customizable percentage increase or decrease to those levels. How It Works: The idea is simple: It looks at the previous day's high and low prices and then adjusts them by a percentage you choose. Here's what that means: Predicted High: This is calculated by taking the high price of the previous day and adding a p
波浪同步器是波浪分析的可视化指标。结合蜡烛图运动序列并构建定向波浪,与市场一起产生同步运动。 每个波浪的开始都以信号箭头开始,还有警报。 该指标永远不会重绘或移动先前历史记录上的箭头。 信号箭头出现在蜡烛图的收盘价。 适用于任何交易工具和时间框架。 易于使用和配置,仅包含 2 个输入参数:选择与所选参数一起使用的时间框架和计算 MA 线的方法。 推荐的参数可以移动 1-2 个周期。 红色箭头方向用于购买交易资产。 蓝色箭头方向用于出售交易资产。 ----------------------------------------------------------------------------------------------
Introduction In the fast-paced world of financial market trading, success often hinges on the ability to spot and leverage trends. Among the various strategies available, momentum trading stands out as a powerful tool for traders seeking to capitalize on market movements. In this article, we will delve into the concept of momentum, its significance in trading, and the numerous benefits it offers to traders. What is Momentum? Momentum in trading refers to the tendency of assets to continue moving
Signal Eskiya
Vitalii Zakharuk
Signal Eskiya, in addition to channel lines, reflects entry signals in the form of arrows. Trading strategies using the channel indicator belong to the classic methods of technical analysis, are easy to execute, and therefore available even to beginners. Price ranges work equally well on any trading assets and timeframes, they can be used both independently and with additional confirmation from oscillators and market volumes. American traders say: “Trend is your friend”, which means “Trend is
Auto Trend Lines
Semion Tremsin
Simply drop the indicator to the graph and support and resistance levels will be shown automatically! The indicator for automatic drawing of support and resistance levels based on THREE points. Identified points are marked on the chart Indicator shows break through price for both bullish and bearish trends (if found) You can specify on how many bars the indicator shall look in order to identify supporting points. In addition, you can select on which time frame the indicator will work. That means
Bermaui Channel
Muhammad Elbermawi
5 (19)
这是一个价格通道,在图表上显示五个重要的价格水平。这些级别是: 1. 前 x 根柱线的最高价 (HH)。 2. 前 x 根柱线的最高低点 (HL)。 3. 中线。 4. 前 x 根柱线的最低最高价 (LH)。 5. 前 x 根柱线的最低价 (LL)。 如何Bermaui通道捕获 超买 区域 将 HH 和 HL 水平之间的距离视为超买区域。 当价格蜡烛或柱线穿过 HL 向上时,这表明价格正在进入其超买区域。 当价格蜡烛或柱线穿过 HL 向下时,这表明价格正在超出其超买区域。 当价格蜡烛穿过 HH 时,它会创造一个新的高点。这可能表明一个新的上升趋势的开始,该趋势将继续进行,直到价格再次反转下跌方向。 Bermaui Channels 如何捕捉 超卖 区域 将 LL 和 LH 之间的距离视为超卖区域。 当价格蜡烛或柱线穿过 LH 向下时,这表明价格正在进入超卖区域。 当价格蜡烛或柱线穿过 LH 向上时,这表明价格正在超出其超卖区域。 当价格蜡烛穿过 LL 时,它会创造一个新的低点。这可能表明新的下跌趋势的开始,该趋势将继续进行,直到价格反转其方向再次回到上行。 伯毛伊海峡特色 Berma
Trend Divergence Indicator: Your Essential Tool for Market Analysis The Trend Divergence Indicator is a powerful tool designed to assist traders in identifying market trends and pinpointing entry points with precision. By leveraging price divergence, this indicator enhances your trading strategy, offering reliable insights and filtering unnecessary signals. Key Features and Benefits of the Trend Divergence Indicator Accurate Trend Analysis: The Trend Divergence Indicator uses price divergence t
Dynamic Color Fibonacci Indicator This tool is designed to automate the process of drawing and updating Fibonacci levels on your chart. It automatically adjusts to market trends, providing clear visual cues and alerts to help you analyze price movements. Key Features Adaptive Colors: The Fibonacci lines automatically change color to reflect the current trend. They appear blue during uptrends and red during downtrends, giving you an immediate visual sense of the market direction without manual a
Renko Masterx
Abdulkarim Karazon
Renko Masterx 是一个 mt4 箭头型指标,旨在交易砖形图表,该指标有一个回溯测试仪表板,可以告诉交易者有用的信息,例如胜率和赢得的点数,它还给出了 atr x 乘法中的 tp 和 sl,该指标给出了其开盘或内部柱上的信号,它有一个白色标记,将标记给出信号的确切价格,使用该指标的方法是根据指标给出的箭头打开买入或卖出并设置TP 和 SL 也由指标给出。 参数 : 主周期:信号周期 TP ATR :利用每个信号的获利值 SL ATR :根据每个信号绘制的止损值 ATR PERIOD : tp/sl 值是通过乘以该 ATR 值生成的 时间过滤器:使用时,指标将根据此过滤器日期给出的信号给出赢/输统计数据 其他:警报/箭头大小/仪表板位置 x y =================================
The ABC Indicator analyzes the market through waves, impulses, and trends, helping identify key reversal and trend-change points. It automatically detects waves A, B, and C, along with stop-loss and take-profit levels. A reliable tool to enhance the accuracy and efficiency of your trading. This product is also available for MetaTrader 5 =>  https://www.mql5.com/en/market/product/128178 Key Features of the Indicator: 1. Wave and Trend Identification:    - Automatic detection of waves based on mov
Fibonacci Auto Levels
Mohamed yehia Osman
Possible Price reversals levels - based on  Fibonacci + Support +  Resistance Levels Auto levels drawn based on input index (Bars Count )  ---->>> Price Over 50% Fibo line ---> UP TREND ---> BUY when price drop near Support Lines  ---->>> Price Down 50% Fibo line ---> DOWN TREND ---> SELL when price goes up  near Resistance Lines  --->>> The more close price levels ----> the more possibility for price reversals --->>> are you a scalper --> try it on M1 charts with big index like 5000 bars  or
Mini FFMV Dashboard and CSM
Opengates Success International
1 (1)
Mini Forex Market-View Dashboard and Mini-CSM Mini Full Forex Market View Dashboard is a miniature creation of FULL FOREX MARKET_VIEW Custom indicator created to give the Traders a full view of what is going on in the market but in a partial matter to make it conscise. It is useful most especially for those who don't like bogus indicators or those who have a PC with limited screen size. It uses a real time data to access the market and display every bit of information needed to make a successful
The price is moving between two curve tunnel lines in a trend. The two lines of a tunnel represent support and resistance. In an uptrend, for instance, a trade might be entered at the support of the trend line (shown by the red line in the chart) and exited at resistance of the upper tunnel line (shown by the blue line). Tunnel show trend direction for any timeframe (if you have enough bars on the chart for higher timeframes). Trend, or price tunnel, can be up, down or sideways. If the current p
Channel Reliable
Maryna Shulzhenko
This is no ordinary channel. Everyone should analyze it and find a way to use it in their trading strategies. Like all channels, it has a middle line as well as a high and low line. This channel is worth watching for its unusual behavior. The use of the Channel Reliable indicator allows the trader to react in time to the price going beyond the boundaries of the channel set for it. This corridor is built on the basis of the analysis of several candles, and changes in the parameter of the number
The High Low indicator is a very simple indicator that has the task of showing us the minimum and maximum levels of the time frame that we wish to underline. This indicator also has the ability to show you minimum and maximum price levels of institutional periods as a level, such as quarterly, half-yearly and annual. We believe these minimum and maximum levels are the true key market levels and therefore a correct visualization on the graph is able to show the important price levels.
Fibonacci Of Yesterday Ultimate
Thushara Dissanayake
5 (1)
作为外汇交易员,您了解 斐波那契 交易策略在技术分析中的价值。然而,手动绘制和调整斐波那契水平线可能非常耗时。这就是 Fibonacci Of Yesterday Ultimate 指标的用武之地。它专为使用基于前一天价格行为的 Fibonacci 策略的交易者而设计,可为您节省时间和精力。 这一创新指标根据斐波那契水平自动识别入场、止损和获利水平。它还包括一个用户友好的斐波那契工具,可以轻松定制以满足您的喜好。它的与众不同之处在于它能够识别图表上的真实趋势通道,帮助您轻松发现反转、回撤和趋势机会。 使用 Fibonacci Of Yesterday Ultimate 指标非常简单。等待重大新闻发布,确定趋势,并相应地绘制斐波那契水平。在 50% 和 38.2% 水平之间进行交易,将止损设置在 23.6% 回撤水平。该指标简化了该策略的实施。 用户友好的界面和快速访问按钮使其适合所有级别的交易者。当价格进入斐波那契水平时,通过手机、电子邮件和弹出式警报随时通知您。您可以自定义每个警报并查看其他时间范围内保存的信息。 告别手动调整和趋势通道分析。 Fibonacci Of Yesterd
NOTE-After the first 10 people to rent this product for 1 month then I will remove the 1 month renting option and leave the unlimited price only. Therefore don't rent it too late. Thanks for those who have rented yet. Don't miss out this offer! Few  people remaining. Special offer from 2500usd to 200usd 24 hours offer! Introduction Super bands Trend Indicator is an indicator designed to reveal the direction of the market Trend. The Indicator is based on moving averages, ichimoku, alligators, a
A Fibonacci indicator is best used with other indicators like Pivots, Support/Resistance etc. Price tends to use Fibo levels as Support or Resistance lines. So, this indicator is very useful to know when price might reverse or if a level is crossed, price might continue the trend. Also, to find the best Take Profit and StopLoss lines. Don't use Fibo Indicator alone for trading as it might not always be accurate. Use it to make your strategies better as a supporting indicator. Settings: Auto Fib
FREE
Fibonacci Of Yesterday
Thushara Dissanayake
作为外汇交易员,您了解 斐波那契 交易策略在技术分析中的威力。然而,手动绘制和调整斐波那契水平线可能非常耗时。这就是 EA 昨日斐波那契数 为您节省宝贵时间的用武之地。它专为使用基于前一天价格行为的斐波那契策略进行交易而设计,该创新工具可根据斐波那契水平自动识别入场、止损和获利水平。这种自动化简化了您的交易流程并提高了效率。该 EA 还具有现代跟踪系统和全面的风险管理系统,可帮助您有效地管理您的交易。 使用昨日斐波那契 EA,您可以根据确定的斐波那契水平快速进场和退场,从而利用快速的市场活动。此外,EA 提供通知提醒,即使您不在交易平台上,也能让您了解市场动向。 Fibonacci Of Yesterday EA 的用户友好设置适合所有技能水平的交易者。此外,可定制的设置允许您定制 EA 以匹配您的个人交易偏好。 使用此 EA 的策略包括等待所有主要新闻发布、确定趋势并相应地绘制斐波那契水平。如果市场处于上升趋势,则斐波那契水平从摆动高点绘制到摆动低点。相反,如果市场处于下降趋势,则斐波那契水平从摆动低点绘制到摆动高点。要执行交易,请在 50% 和 38.2% 的斐波那契水平之间
AutoPivot
Hafis Mohamed Yacine
This indicator will draw monthly, weekly, and daily pivot. Pivot line will be calculated automatically again when the period ends. Auto Pivot Metatrader 4 Indicator The Auto Pivot indicator for Metatrader 4 automatically updates the pivot point (PP), support (S1,S2,S3) and resistance levels (r1,r2,r3) every day. Price above the pivot point means positive while price below the pivot point means negative. S3 indicates extremely oversold while price above resistance r3 means extremely overbought.
介紹 斐波那契水平專業指標是日常交易的絕佳工具,可作為其他指標的補充,以更好地確認交易設置和市場走向。該指標易於設置,適用於所有貨幣對和時間範圍,推薦使用 M15-W1。 該指標的目的是在圖表上顯示斐波那契水平、日線、上線和下線。作為附加功能,該指標還會在您的圖表上繪製回撤線和擴展線,並告訴您當天的高點、低點、範圍和點差。 Fibonacci Levels Pro 指標使用前一天的高點和低點為您繪製計算線。這是每個交易者必備的工具! 特徵 易於設置,無需複雜的設置 乾淨流暢的圖表線條,易於閱讀 適用於所有貨幣對和時間範圍 斐波那契線的可調顏色設置 可調節儀表板顏色 包含帳戶信息的儀表板 指標參數 UpperFiboColor - 在 123.6 到 400.0 之間設置您想要的上斐波那契水平的顏色 MainFiboColor - 為每日斐波那契水平從高 100.0 到低 0.0 設置所需的顏色 LowerFiboColor - 從 -23.6 到 -500.0 為較低的斐波那契水平設置所需的顏色 主要斐波那契線 - 真/假。在圖表上顯示從高 100.0 到低 0.0 的每日水平 儀
Breakout Trend Lines
Alexander Nikolaev
5 (2)
The indicator draws lines based on the price Highs and Lows, as well as slant trend lines. Break through the trend line, High or Low usually indicates trend change (or continuation). Once the price moves through a line, and the candlestick closes, the indicator draws an appropriate arrow (also, you can enable alerts). This indicator is easy to use, but nevertheless, there are many trading strategies, which are based on a breakthrough of the trend lines. The number of candlesticks used to determi
OBTE = Order Block Type I OBTI Indicator MT4 is the most accurate and customizable indicator on the market. It was developed to facilitate the analysis of operations based on candlestick patterns and supply-demand zones. These zones are possible movement reversal points. For this indicator is generated by the order block of smart money concept. Input parameters: 1. Multiple timeframes : M1 M5 M15 M30 H1 H4 D1 W1 MN1 2. Default input: H1 H4 D1 W1 MN1 3. Notifications / Send Emails / Notification
The Auto Super Pivot indicator is an indicator designed to calculate support points and resistance points for pivot points. this indicator has the ability to calculate standard pivot, fibonacci, camarilla, woodie and demark pivot points. It also allows you to use all time zones with the time frame feature. Another feature of the indicator is the auto time slice feature. This feature allows automatic calculations without having to set any time zone. Features 6 different pivot calculation modes A
Pivot levels Auto V1
Hafis Mohamed Yacine
What Is a Pivot Point? A pivot point is a technical analysis indicator, or calculations, used to determine the overall trend of the market over different time frames. The pivot point itself is simply the average of the intraday high and low, and the closing price from the previous trading day. On the subsequent day, trading above the pivot point is thought to indicate ongoing bullish sentiment, while trading below the pivot point indicates bearish sentimen How to Use Pivot Points The very ess
Arbitrage Macd
Muhammed Emin Ugur
Arbitrage MACD: Your Key to Analyzing Market Trends The Arbitrage MACD is a cutting-edge indicator designed to assist traders and investors in analyzing market trends with greater precision and confidence. MACD, which stands for Moving Average Convergence Divergence, is a well-known and widely used tool in the financial world, and the "Arbitrage MACD" takes its functionality to the next level. This innovative indicator offers a comprehensive analysis of the relationship between two moving ave
Pisces TheProfitZone
Nuttawut Khiawkiri
Pisces TheProfitZone "Pisces TheProfitZone MT4 Indicator Powered byFxGangster" This indicator will calculate new support and resistant zone everyday, and that give us a trading zone such as thats telling us TP and SL, So it still telling us for where should the price will go reach? Fore Example. Uptrend : If Price can stay upper a Line and price close higher above a Line, then the price will continue go up to reach next Line. Downtrend : If Price can't pass to stay upper a Line and the price
该产品的买家也购买
Meravith
Ivan Stefanov
5 (1)
该指标从每个点分析成交量,并计算该成交量的市场疲劳水平。 它由三条线组成: 牛市成交量疲劳线 熊市成交量疲劳线 表示市场趋势的线。该线根据市场是熊市还是牛市变化颜色。 您可以从任何选择的起点分析市场。一旦达到成交量疲劳线,确定一个新的起点来开始下一次分析。 您可以分析任何内容——趋势和修正。一个好的方法是每次当它达到趋势线或形成顶部或底部时移动指标。 趋势线与某一成交量疲劳线之间的距离越大,说明该方向的成交量越大。 趋势线可以作为开单的位置,而疲劳线则用于收集利润。 该系统非常独特,但又极其直观。 市场上没有类似的产品。 使用没有限制。可以在所有市场和所有时间框架中应用。 重要提示:在MetaTrader4测试器中检查时,双击紫色线条,然后左右移动它以分析市场。 如有任何问题,请随时联系我。
Scalper Inside PRO
Alexey Minkov
4.74 (69)
An exclusive indicator that utilizes an innovative algorithm to swiftly and accurately determine the market trend. The indicator automatically calculates opening, closing, and profit levels, providing detailed trading statistics. With these features, you can choose the most appropriate trading instrument for the current market conditions. Additionally, you can easily integrate your own arrow indicators into Scalper Inside Pro to quickly evaluate their statistics and profitability. Scalper Inside
目前八折优惠! 对任何新手或专家交易者来说都是最好的解决方案! 这个仪表板软件适用于28种货币对。它基于我们的两个主要指标(高级货币强度28和高级货币冲动)。它对整个外汇市场提供了一个伟大的概述。它显示高级货币强度值,货币运动速度和28个外汇对在所有(9)时间段的信号。想象一下,当你可以使用图表上的单一指标观察整个市场,以确定趋势和或剥头皮的机会时,你的交易将得到改善 我们已经在这个指标中建立了一些功能,使你更容易识别强势和弱势货币,同时识别和确认潜在的交易。该指标以图形方式显示货币的强势或弱势是增加还是减少,以及它在所有时间段的表现。 增加的新功能是动态市场斐波那契水平,它适应当前的市场条件变化,这是一个已经在我们的高级货币强度28和高级货币冲动指标中使用的成熟的加分项。 在交易时,总是将弱势货币和强势货币配对,这个新指标将帮助你做到这一点。 用户手册:点击这里  https://www.mql5.com/en/blogs/post/708783 特点  显示每个时间段的ACS28和GAP-speed(冲动)的货币强度值。 列:颜色代码以7种颜色显示货币强度:强势
本指标是实践实战交易完善的波浪自动分析的指标 !  案例... 注: 波浪分级用西方叫法不习惯,因受到缠论(缠中说禅)命名方式习惯的影响,我是将基础波浪命名为 笔 ,将二级波段命名为 段 ,同时具有趋势方向的段命名为 主趋段 (以后笔记中都是这种命名方式,先告知大家),但是算法上和缠论关系不大切勿混淆.反映的是本人分析盘面总结的 千变万化纷繁复杂的运行规律 . 对波段进行了标准化定义,不再是不同人不同的浪  ,   对人为干扰的画法进行了排除,在严格分析进场起到了关键的作用 . 使用这个指标,等于将交易界面提升美感,抛弃最原始的K线交易带你进入新的交易层次.如果不是为了交易,在宣传上也将使客户观感提升层次. 指标内容: 1. 基础波浪 (笔) : 首先我们找出了价格波动过程中的基础波动拐点,当然他的有序性低,为下一步的计算提供基础. 2. 二级波段( 段 ) :在基础波浪的基础上,通过算法分析得到层级更明显的二级波段,二级波段为波浪提供了分析基础 3. 波浪( 浪 ): 有着更清晰的趋势,更清晰直观的方向.分析一个波浪是否延续,需要看二级波段的形态,分析二级的构成,可以得出波浪后
Looking for a powerful yet lightweight swing detector that accurately identifies market structure turning points? Want clear, reliable buy and sell signals that work across any timeframe and any instrument? Buy Sell Arrow MT Swing is built exactly for that — precision swing detection made simple and effective. This indicator identifies Higher Highs (HH) , Higher Lows (HL) , Lower Highs (LH) , and Lower Lows (LL) with remarkable clarity. It is designed to help traders easily visualize market str
Dynamic Forex28 Navigator
Bernhard Schweigert
4.43 (7)
Dynamic Forex28 Navigator - 下一代外汇交易工具。 当前 49% 折扣。 Dynamic Forex28 Navigator 是我们长期流行的指标的演变,将三种功能合二为一: 高级货币强度 28 指标 (695 条评论)+ 高级货币 IMPULSE 带警报 (520 条评论)+ CS28 组合信号(奖励)。 有关指标的详细信息 https://www.mql5.com/en/blogs/post/758844 下一代强度指标提供什么? 您喜欢的原始指标的一切,现在通过新功能和更高的精度进行了增强。 主要特点: 专有货币强度公式。  所有时间范围内的平滑和准确的强度线。 非常适合识别趋势和精确进入。 动态市场斐波那契水平(市场斐波那契)。  此指标独有的独特功能。 斐波那契应用于货币强度,而不是价格图表。 适应实时市场活动以获得准确的反转区域。 实时市场动量。  第 9 行显示市场是活跃还是被动。 对于定时交易至关重要。 全面的警报和显示。  每种货币最强的买入和卖出动量。 ​​28 对的双重动量买入和卖出。 超买/超卖警告外部范围和止损。 反转
ACB Breakout Arrows
KEENBASE SOFTWARE SOLUTIONS
4.15 (34)
ACB Breakout Arrows 指标通过识别一种特殊的突破形态,为交易者提供关键的入场信号。该指标持续扫描图表中某一方向上趋于稳定的动能,并在主要行情启动之前给出准确的进场信号。  点击此处获取多品种、多周期扫描仪 - ACB Breakout Arrows MT4 专用扫描仪 主要功能 指标自动提供止损和止盈位置。 配备 MTF 多周期扫描仪面板,可跟踪所有时间周期的突破信号。 适用于日内交易者、波段交易者和剥头皮交易者。 采用优化算法,提高信号准确性。 提供特殊目标线,用于设置快速平仓点或无损平移位(Quick Profit Line)。 包括胜率、成功率、平均收益等表现分析指标。 不重绘,信号一旦出现即保持不变。 交易确认 -  建议结合使用 ACB Trade Filter 指标 以过滤低质量信号。 强买入: 上箭头 + 绿色柱状图 + 多头趋势。 强卖出: 下箭头 + 红色柱状图 + 空头趋势。 避免交易 :当柱状图为灰色且趋势为震荡时。 (可选) -  建议使用 KT  支撑与阻力位指标  来避免在关键支撑/阻力区域附近开仓。此类交易可能迅速转为亏损,造成不必
Entry Points Pro
Yury Orlov
4.62 (172)
这是一款 MT4 的趋势指标,可提供准确的入场交易信号,且无重绘或延迟。 它可应用在任何金融资产:外汇、加密货币、贵金属、股票、指数。 最好的结果出现在 M15+ 的时间帧内。 指标的 MT5 版本 重要! 购买后请联系我,以便获取详细指南和奖励。 视频 (6:22) - 一个信号赢取的利润等于指标价格的三倍。 视频 (4:44) - 它如何在测试器中工作,我的提示和技巧。 视频 (1:44) - 有关它如何处理加密货币和指数的几句话。 大多数交易者在 Entry Points Pro 指标的帮助下,在第一个交易周内就改善了他们的交易结果。 Entry Points Pro 指标的益处 入场信号无重绘或延迟 如果信号出现,并得到确认(如果信号所在烛条已收盘),则它不会再消失;不像是重绘指标,它会导致重大的财产损失,因为它们可以在显示信号后再将其删除。 无差错开仓 指标算法可令您找到入场交易(买入或卖出资产)的理想时机,从而提高每位交易者的成功率。 Entry Points Pro 可操作任何资产 它允许您在 MT4 平台上交易任何经纪商提供的加密货币、股票、金属、指数、商品
Adaptive Volatility Range
Stanislav Konin
5 (3)
Adaptive Volatility Range [AVR] is a powerful tool for identifying key trend reversal points. AVR accurately reflects the Average True Range (ATR) of volatility, taking into account the Volume-Weighted Average Price (VWAP). The indicator adapts to any market volatility by calculating the average volatility over a specific period, ensuring a stable rate of profitable trades. You receive not just an indicator but a professional automated trading system , AVR-EA . Advantages: Automated Trading Sys
RelicusRoad Pro
Relicus LLC
4.63 (106)
您有多少次购买了一个交易指标,它拥有 出色的回测 、 实盘账户表现证明 以及惊人的数据和 无处不在的统计数据 ,但使用后您却 最终爆仓 ? 您不应该只相信一个信号本身,您需要知道它最初为何出现,而这正是 RelicusRoad Pro 最擅长的! 用户手册 + 策略 + 培训视频 + 带 VIP 权限的私人群组 + 提供移动版本 一种全新的市场视角 RelicusRoad 是外汇、期货、加密货币、股票和指数领域 全球最强大、最好的交易指标 ,为交易者提供 账户增长 所需的所有信息和工具。我们提供 技术分析 和 交易计划 ,帮助 每一位交易者成功 ,无论是 初学者 还是 高级交易者 。 它是一个 关键交易指标 ,提供足够的信息来 预测 未来市场。我们相信一个 完整的解决方案 ,而不是图表上几个毫无意义的不同指标。这是一个 一体化指标 ,显示 信号 、 箭头 + 价格行为 信息,这些信息 无与伦比 且 非常准确 。   RelicusRoad 利用机器学习(AI)技术,为交易者提供必要的信息和工具,帮助他们成为成功且消息灵通的交易者。   利用领先指标预测未来价格 几乎 所有技术指标
OrderFlow Absorption – 專業級MT4買賣差與吸收訊號指標 釋放真正訂單流分析的力量,OrderFlow Absorption 是MetaTrader 4上最強大的買賣差(Delta)直方圖與吸收訊號指標。專為想看清每一個價格波動背後真相的交易者設計,這個工具揭示了隱藏的買賣壓力與推動市場的吸收事件。 功能特色 買賣差直方圖視覺化:   以清晰的色彩直方圖即時顯示買方與賣方壓力。 吸收訊號偵測:   先進邏輯自動辨識多空吸收事件,及早預警潛在反轉。 圖表標記:   吸收訊號直接標示於主圖表,方便視覺辨識。 彈出式警報:   新吸收訊號出現時即時通知。 自訂門檻:   過濾弱訊號,專注高勝率機會。 資源管理:   高效運算,適用於大型圖表也能流暢運行。 全品種兼容:   適用於任何商品與週期,包括外匯、指數、商品等。 簡易整合:   參數簡單,快速上手與調整。 OrderFlow Absorption 的邏輯說明 OrderFlow Absorption 採用專利演算法,能在沒有完整Tick數據的情況下,估算每根K棒的買賣壓力(Delta)。它分析成交量、價格行為、K
Dynamic Scalper System
Vitalyi Belyh
5 (1)
“ Dynamic Scalper System ”指标专为在趋势波内进行剥头皮交易而设计。 已在主要货币对和黄金上进行测试,并可与其他交易工具兼容。 提供顺势短线建仓信号,并提供额外的价格变动支持。 指标原理: 大箭头决定趋势方向。 在趋势波内,我们采用一种生成小箭头形式的剥头皮交易信号的算法。 红色箭头代表看涨方向,蓝色箭头代表看跌方向。 敏感的价格变动线会沿着趋势方向绘制,并与小箭头信号协同作用。 信号运作方式如下:当线在适当时刻出现时,将形成入场信号;在出现线时,持仓;线完成后,平仓。 建议的操作时间范围为M1 - H4。 箭头在当前K线上方形成,如果下一根K线已开仓,则不会重新绘制上一根K线上方的箭头。 输入参数 Trend Wave Period - 趋势方向(大箭头)的周期,改变趋势波的时间间隔。值 1 表示趋势方向的最长持续时间,参数值越大,持续时间越短。 Scalper Arrows Period - 信号箭头(小箭头)的计算周期,改变入场信号的生成频率。值 3 表示最频繁的生成频率,参数值越大,箭头频率越低,准确度越高。 这些参数可以根据不同的时间范
The BB Reversal Arrows technical trading system has been developed to predict reverse points for making retail decisions. The current market situation is analyzed by the indicator and structured for several criteria: the expectation of reversal moments, potential turning points, purchase and sale signals. The indicator does not contain excess information, has a visual understandable interface, allowing traders to make reasonable decisions. All arrows appear to close the candle, without redrawin
Full Scalping Signal
Leandro Bernardez Camero
FullScalping 是一款 不重绘、不回绘 的指标,专为在任何市场中生成 持续不断的剥头皮入场信号 而设计。非常适合追求激烈行情的激进交易者! 加入频道,获取独家信息和更新: https://www.mql5.com/en/channels/forexnewadvisor 你会注意到它 几乎在每根K线 上都会给出信号,要么是确认趋势,要么是提示关键回调。就像一个全天候运行的雷达为你指引方向。 它是如何工作的?非常简单: 红色箭头 进场 做空 蓝色箭头 进场 做多 始终顺应整体趋势方向进行交易,积极获取 每单15到20点 的利润,并在市场剧烈反转之前迅速退出。 信号 持续不断 ,让你永远不会错过交易机会。目标是通过以下方式实现 高频剥头皮交易 : 大手数交易 低点差(显示在左下角) 宽止损,设在上一次趋势反转附近 你可以观看 实时交易视频 了解操作过程,但它使用起来非常简单,安装完成后即可上手。 它会重绘或回绘吗? 对于箭头类指标,大家最关心的问题之一就是它是否 重绘 或 回绘 。而对于 FullScalping 来说,答案非常明确: 此指标 不会重绘 这意味着
NAM Order Blocks
NAM TECH GROUP, CORP.
3.67 (3)
MT4多時限訂單塊檢測指示器。 特徵 -在圖表控制面板上完全可自定義,提供完整的交互。 -隨時隨地隱藏和顯示控制面板。 -在多個時間範圍內檢測OB。 -選擇要顯示的OB數量。 -不同的OB用戶界面。 -OB上的不同過濾器。 -OB接近警報。 -ADR高低線。 -通知服務(屏幕警報|推送通知)。 概括 訂單塊是一種市場行為,它指示從金融機構和銀行收取訂單。著名的金融機構和中央銀行帶動了外匯市場。因此,交易者必須知道他們在市場上正在做什麼。當市場建立訂單塊時,它會像發生大多數投資決策的範圍一樣移動。 訂單建立完成後,市場將朝著上升和縮小的方向發展。訂單大宗交易策略的關鍵術語是它包括機構交易者正在做的事情。由於它們是主要的價格驅動因素,因此包括機構交易在內的任何策略都可以。 您將在任何時間範圍內實時看到訂單塊,使用我們的控制面板,您將能夠在所選的歷史記錄週期內檢測常規,拒收和未大寫的訂單塊。 現在您可以接收到訂單塊接近警報,我們在MT4上顯示屏幕通知,並將通知推送到您的手機!
The Nihilist 5.0 Indicator includes Forexalien and Nihilist Easy Trend trading strategies and systems. It is composed of an MTF Dashboard where you can analyze the different input possibilities of each strategy at a glance. It has an alert system with different types of configurable filters. You can also configure which TF you want to be notified on your Metatrader 4 platform and Mobile application The indicator has the option to view how could be a TP and SL by using ATR or fixed points, even w
Introducing the Delta Volume Profile Indicator - Unleash the Power of Institutional Precision!  Technical Indicator: Are you ready to trade like the pros? The Delta Volume Profile Indicator is no ordinary tool. It’s a high-precision, cutting-edge indicator that puts the power of institutional-grade trading in your hands. This unique indicator analyses delta volume distribution in real-time, revealing the market's hidden buy/sell imbalances that the biggest financial institutions rely on to antic
介绍 ON Trade Waves Patterns Harmonic Elliot Wolfe,这是一款高级指标,旨在使用手动和自动方法检测各种市场模式。以下是它的工作原理: 谐波模式: 该指标可以识别出现在您图表上的谐波模式。这些模式对于练习谐波交易理论的交易者非常重要,正如Scott Carney的书《谐波交易第1卷和第2卷》所描述的那样。无论您是手动绘制它们还是依赖自动检测,ON Trade Waves Patterns都可以胜任。 控制面板: 我们配备了一个用户友好的控制面板,它会保存您的图表和时间帧设置,使您可以轻松切换不同配置。您甚至可以最小化它以最大化图表空间。如果您更喜欢使用其他分析工具,只需单击关闭按钮即可隐藏所有指标数据。 模板保存: 当您自定义设置或添加其他指标,如移动平均线或布林带时,该指标会自动保存您的模板。这意味着您可以随时轻松加载您喜欢的设置。 优化显示: 对于Windows 10用户,我们建议调整您的DPI设置以获得高清设备上的最佳屏幕体验。右键单击MetaTrader图标,选择“兼容性”,然后选择“更改高DPI设置”,将其设置为“系统(增强)”。
KT Trend Trading Suite MT4
KEENBASE SOFTWARE SOLUTIONS
KT Trend Trading Suite 是一款多功能指标,它结合了趋势跟随策略和多个突破点作为入场信号。 当新趋势形成后,该指标会提供多个入场机会,让交易者能够顺势而为。为了避免不重要的入场点,还引入了回调阈值的概念。 MT5版本可在此处获取  https://www.mql5.com/en/market/product/46270 功能特点 将多种市场动态纳入一个公式中,以清晰展现市场趋势。 绘制矩形框标记入场信号,并配合局部高点和低点进行定位。 指标会自动评估自身信号的准确性,并提供多个简明的性能指标。 内置多周期仪表盘,扫描所有可用时间周期,并显示每个周期内的趋势方向。 输入参数 History Bars:   用于分析历史信号的K线数量。  Signals Period:   整数值,决定入场信号的强度。 Pullback Depth:   整数值,决定趋势继续前常见的回调深度。 Trend Period:   整数值,用于判断主要趋势方向。 Show MTF Dashboard:   显示/隐藏多周期扫描仪表盘。 Performance Analysis:
The Super Arrow Indicator provides non-repainting buy and sell signals with exceptional accuracy. Key Features No repainting – confirmed signals remain fixed Clear visual arrows: green for buy, red for sell Real-time alerts via pop-up, sound, and optional email Clean chart view with no unnecessary clutter Works on all markets: Forex, gold, oil, indices, crypto Adjustable Parameters TimeFrame Default: "current time frame" Function: Sets the time frame for indicator calculation Options: Can be set
Beast Super Signal
Dustin Vlok
4.73 (89)
正在寻找可以帮助您轻松识别有利可图的交易机会的强大外汇交易指标? Beast Super Signal 就是您的不二之选。 这个易于使用的基于趋势的指标持续监控市场状况,寻找新的发展趋势或跳入现有趋势。当所有内部策略一致且彼此 100% 融合时,Beast Super Signal 会发出买入或卖出信号,无需额外确认。当您收到信号箭头警报时,只需买入或卖出。 购买后给我留言,让我加入我的私人 VIP 群组! (仅限购买完整产品)。 购买后给我发消息以获取最新的优化设置文件。 此处提供 MT5 版本。 在此处 获取 Beast Super Signal EA。 查看评论部分以查看最新结果! Beast Super Signal 根据您偏好的 1:1、1:2 或 1:3 风险回报率建议入场价、止损和获利水平,让您放心交易。这个 Beast Super Signal 是 100% 不可重新绘制的,这意味着它永远不会重新计算或重新绘制,每次都能为您提供可靠的信号。 Beast Super Signal 指标适用于所有时间范围,包括货币对、指数、商品和加密货币对。 Beast Su
GOLD Impulse with Alert
Bernhard Schweigert
4.64 (11)
这个指标是我们2个产品 Advanced Currency IMPULSE with ALERT  +   Currency Strength Exotics 的一个超级组合。 它适用于所有时间框架,并以图形方式显示8种主要货币和一种符号的强势或弱势冲动! 该指标专门用于显示任何符号的货币强度加速,如黄金、异国货币对、商品、指数或期货。这是它的第一个指标,任何符号都可以被添加到第9行,以显示黄金、白银、石油、DAX、US30、MXN、TRY、CNH等的真实货币强度加速(冲动或速度)。 建立在新的基础算法上,它使识别和确认潜在的交易更加容易。这是因为它以图形方式显示了一种货币的强势或弱势是否正在加速,并测量了这种加速的速度--把它想象成你汽车中的速度表。当你加速时,事情显然会发生得更快,这在外汇市场上也是一样的,即如果你配对的货币正在向相反的方向加速,你就会发现一个潜在的有利可图的交易。 动态市场斐波那契28水平被用作警报触发器,将适应市场活动。如果冲动击中黄色触发线,你将收到警报。然后你就知道作为一个交易员应该做什么。货币对和方向已经给出。只需点击警报按钮,就可以切换到该货
Volatility Trend System - a trading system that gives signals for entries. The volatility system gives linear and point signals in the direction of the trend, as well as signals to exit it, without redrawing and delays. The trend indicator monitors the direction of the medium-term trend, shows the direction and its change. The signal indicator is based on changes in volatility and shows market entries. The indicator is equipped with several types of alerts. Can be applied to various trading ins
Elliott Wave Trend MT4
Young Ho Seo
4 (7)
Elliott Wave Trend was designed for the scientific wave counting. This tool focuses to get rid of the vagueness of the classic Elliott Wave Counting using the guideline from the template and pattern approach. In doing so, firstly Elliott Wave Trend offers the template for your wave counting. Secondly, it offers Wave Structural Score to assist to identify accurate wave formation. It offers both impulse wave Structural Score and corrective wave Structure Score. Structural Score is the rating to sh
MR Reversal Patterns 4
Sergey Khramchenkov
5 (2)
In the "Masters of Risk" trading system, one of the main concepts is related to places where markets change direction. In fact, this is a change in priority and a violation of the trend structure at the extremes of the market, where supposedly there are or would be stop-losses of "smart" participants who are outside the boundaries of the accumulation of volume. For this reason, we call them "Reversal Patterns" - places with a lot of weight for the start of a new and strong trend. Some of the imp
Smart Price Action Concepts
Issam Kassas
4.75 (12)
首先,值得强调的是,这个交易工具是非重绘、非重画和非滞后的指标,非常适合专业交易。 在线课程,用户手册和演示。 智能价格行动概念指标是一个非常强大的工具,既适用于新手,也适用于经验丰富的交易者。它将超过20个有用的指标合并到一个指标中,结合了高级交易思想,如内圈交易员分析和智能资金概念交易策略。该指标侧重于智能资金概念,提供有关大型机构交易方式的见解,帮助预测它们的动向。 它在流动性分析方面尤其擅长,有助于理解机构的交易方式。它擅长预测市场趋势,并仔细分析价格波动。通过将您的交易与机构策略对齐,您可以更准确地预测市场走向。该指标多才多艺,擅长分析市场结构,识别重要的订单区块,并识别各种模式。 它擅长识别BOS和CHoCH等模式,理解动量的转变,并突出显示供需强劲的关键区域。它还擅长发现强大的不平衡,并分析价格创造更高高点或更低低点的模式。如果您使用斐波那契回撤工具,该指标可以满足您的需求。它还可以识别相等的高点和低点,分析不同的时间框架,并通过仪表板显示数据。 对于使用更高级策略的交易者,该指标提供了工具,如公平价值差指标和优惠和折扣区域的识别。它特别关注高时间框架订单区块,并
Supply and Demand Dashboard PRO
Bernhard Schweigert
4.8 (20)
目前八折优惠! 这个仪表板是一个非常强大的软件,可用于多个符号和多达9个时间段。 它是基于我们的主要指标(最佳评论:高级供应需求)。 Advanced Supply Demand 该仪表板提供了一个伟大的概述。它显示。   筛选后的供需值,包括区域强度评级。 区间内和区间外的点位距离。 它突出了嵌套的区域。 在所有(9个)时间段内,它对所选符号发出4种警报。 它是高度可配置的,以满足您的个人需求! 您的利益! 对每个交易者来说,最重要的问题是。 什么是入市的最佳水平? 在强大的供应/需求区域内或附近进入你的交易,以获得最佳的成功机会和风险/回报。 我的止损的最佳位置是哪里? 把你的止损放在强势供应/需求区的下方/上方是最安全的。 我的最佳盈利目标是什么? 你的退出策略和你的进入策略一样重要,了解更高的时间框架图可以帮助你。对于买入,使用下一个供应区作为目标,对于卖出,使用下一个需求区作为目标。在回撤到供应区或需求区时进场,以确保有足够的利润空间,达到更高的时间框架的供应和需求,将增加你的利润。 为什么我们要过滤强区和弱区? 不平衡性越大,价格的变动就
PZ Harmonacci Patterns
PZ TRADING SLU
3.17 (6)
可以说,这是您可以为MetaTrader平台找到的最完整的谐波价格形成自动识别指标。它检测19种不同的模式,像您一样认真对待斐波那契投影,显示潜在的反转区域(PRZ),并找到合适的止损和获利水平。 [ 安装指南 | 更新指南 | 故障排除 | 常见问题 | 所有产品 ] 它检测19种不同的谐波价格形态 它绘制了主要,衍生和互补的斐波那契投影(PRZ) 它评估过去的价格走势并显示每个过去的形态 该指标分析其自身的质量和性能 它显示合适的止损和获利水平 它使用突破来表明合适的交易 它在图表上绘制所有样式比率 它实现了电子邮件/声音/视觉警报 受斯科特·M·卡尼(Scott M. Carney)的书的启发,该指标旨在满足最纯粹和最熟练的交易者的需求。但是,它采取了一种使交易更容易的方式:在向交易发出信号之前,它会等待Donchian朝正确方向突破,从而使交易信号非常可靠。 斐波那契投影与向量无关 它实现了电子邮件/声音/推送警报 它绘制了ABCD投影 重要提示: 为了符合 Scott M. Carney先生 的商标申诉,某些图案名称已重命名为不言自明的替代方式, Scott M.
IQ Gold Gann Levels
INTRAQUOTES
5 (4)
Presenting one-of-a-kind Gann Indicator for XAUUSD IQ Gold Gann Levels is a non-repainting, precision tool designed exclusively for XAUUSD/Gold intraday trading. It uses W.D. Gann’s square root method to plot real-time support and resistance levels, helping traders spot high-probability entries with confidence and clarity. William Delbert Gann (W.D. Gann) was an exceptional market analyst whose trading technique was based on a complex blend of mathematics, geometry, astrology, and ancient calcul
Quantum Trend Sniper Indicator MT4
Bogdan Ion Puscasu
4.69 (42)
介绍   量子趋势狙击指标 ,突破性的 MQL5 指标,正在改变您识别和交易趋势反转的方式!由拥有超过13年交易经验的资深交易员团队开发,     量子趋势狙击指标   旨在通过其创新的方式以极高的准确度识别趋势反转,将您的交易之旅推向新的高度。 ***购买量子趋势狙击指标,即可免费获得量子突破指标!*** 当量子突破指标识别出趋势反转时,它会向您发出警报和信号箭头,并建议您三个止盈水平。 它既适合新手交易者,也适合专业交易者。 量子 EA 通道:       点击这里 MT5版本:       点击这里 建议: 时间范围:  所有时间范围。为了获得最佳结果,我们建议在 M15、M30 和 H1 时间范围内使用它。 货币对:欧元兑美元、英镑兑美元、澳元兑美元、欧元兑英镑, EURAUD, XAUUSD 账户类型:ECN、Raw 或 Razor,点差极低 经纪时间:任意 经纪商:IC Markets、Pepperstone with Raw 和 Razor 的点差最低 建议止损:50 点 建议止盈水平:20 点、50 点和 100 点 规格: 不重漆! 最多
作者的更多信息
Titan Machinist - Your Professional Management System for MetaTrader                                                                                                                                 Transform Your Trading with Automated Position Management Tired of having to manually manage every single trade? Titan Machinist is the ultimate solution to automate your trade management, allowing you to trade like a true professional. Suitable for any trading technique: one
This Expert Advisor constantly monitors the balance and P / L of your trading account to avoid costly withdrawals and / or taking profits. When a certain drawdown or profit target is reached, the EA will warn, close all trades. Very simple setting, set the Take profit and the stop loss (in money) and the expert will start to monitor the orders that are manual or from another expert, and once the profit or stop loss point has been set, the expert will close all the positions with the classic "Bas
FREE
TitanFury
Marco De Donno
50% off for a limited time!!! TitanFury Forex EA is a work based on the method of correlationtrading. Best to work in most market conditions. Since it uses the absorb method ,low drawdown,no martingale,autolot system. This EA has been integrated withh a multi-pair trading system,so this EA only enough to be installed on a chart. This TitanFury is a fully automatic forex robot but you can manually interact with thhis EA using its dashboard. Also,this EA ill not work on BACKTESTING because it's
Titan Gold
Marco De Donno
50% off for a limited time!!!    Ideal Set  <------- Warning Live Account :  https://www.mql5.com/en/signals/2290123?source=Site+Signals+My Golden Titan is an automated system developed on the basis of Price Action trading strategies for direct interaction with the market price. Golden Titan has 7 different strategies already build in, that work seamlessly together.  The result is a very stable growth curve, with some losses here and there as well (but at least not manipulated to trick you.)
Titan King
Marco De Donno
50% off for a limited time!!!                                                                                                 Live Account:   https://www.mql5.com/en/signals/2288479?source=Site+Signals+My                                                                                                             Introducing Titan King  Titan Kings trading system   is a combination of cutting-edge AI algorithms and classic trading strategies involving: momentum, supply and demand zones and EMA.
Titan BaBaDuk
Marco De Donno
50% off for a limited time!!! Titan Babaduk ea is a fully automated trading robot, it well identifies potential breakout levels in certain price patterns and then trades along with the breakouts,  it uses 10 strategic models to manage operations and find entry points, in each operation SL, TP is positioned and managed with Trailing stop. It works only and exclusively in H1 (USDJPY-EURUSD) H4 (GBPUSD), Titan Babaduk has been programmed only for the USDJPY, EURUSD & GBPUSD pairs in order to be us
Titan Gravity
Marco De Donno
Live Signal:   Click One Have you ever wondered why most systems are not effective in live trading? My answer is that it's all the fault of the so-called "Smart Money" or the institutional ones,, they constantly create spikes first up then down and vice versa to screw all the retail investors by tearing away their capital, confusing them and making the markets move randomly without any rules. But in all this there is a famous strategy, which in 2009 won the world championship, exploiting and r
Titan Machinist - Your Professional Management System for MetaTrader                                                                                                                                 Transform Your Trading with Automated Position Management Tired of having to manually manage every single trade? Titan Machinist is the ultimate solution to automate your trade management, allowing you to trade like a true professional. Suitable for any trading technique: one s
Live Signal:   Click One Have you ever wondered why most systems are not effective in live trading? My answer is that it's all the fault of the so-called "Smart Money" or the institutional ones,, they constantly create spikes first up then down and vice versa to screw all the retail investors by tearing away their capital, confusing them and making the markets move randomly without any rules. But in all this there is a famous strategy, which in 2009 won the world championship, exploiting and r
筛选:
无评论
回复评论