Start Thunder Enter
- 指标
- 版本: 1.1
- 更新: 13 九月 2023
- 激活: 5

This offer is limited to a temporary period.
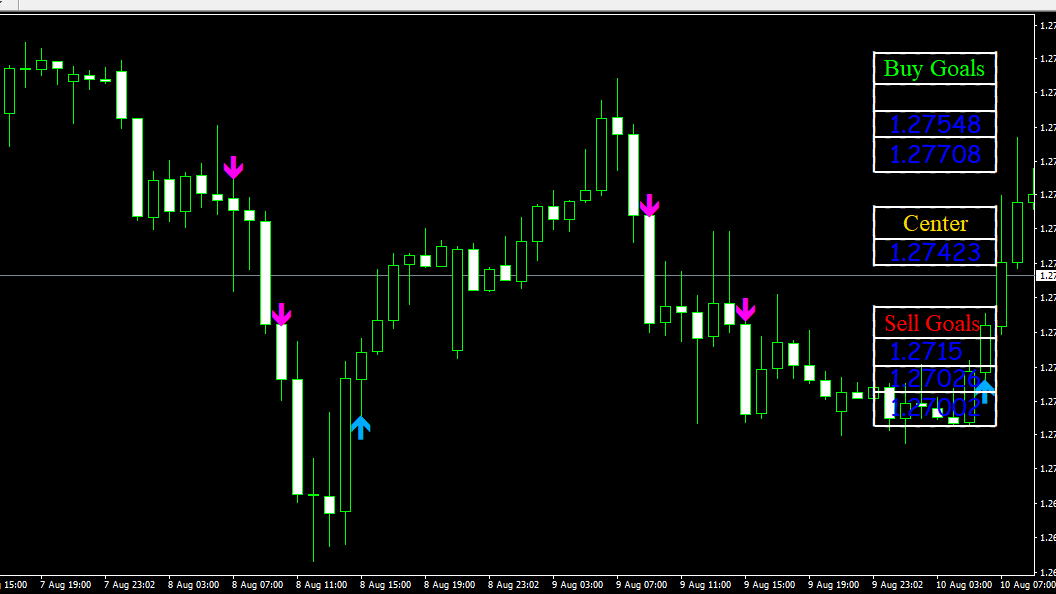
Entry signal :follow the blue arrow for a buy trade and the Pink for a sell.
Buy Trade:
When the blue arrow appears, you wait until the candle completely finishes. Then you enter into a Buy Trade as soon as the next candle appears.
Now wait until you hit TP1 from the Buy Goals box, then close the trade with a profit.
Sell Trade:
When the Pink arrow appears, you wait until the candle completely finishes
Then you enter into a Buy Trade as soon as the next candle appears.
Now wait until you hit TP1 from the Sell Goals box, then close the trade with a profit.
On average normally the profit from when the new candle opens is 200 pips.
This applies on the following time frames:
30mins, 1H, 4H
Exceptions:
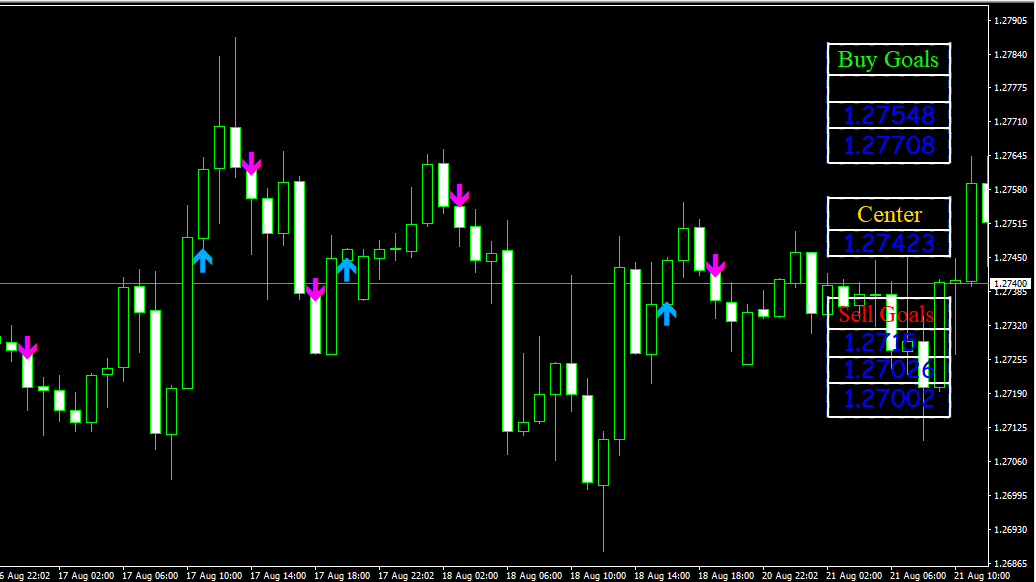
If you have 2 of the same coloured arrows appearing consecutively in an upward incline or downward decline
Do not enter a buy/sell trade on the second arrow which appears (higher/lower up), as the second arrow indicates that the movement has stopped.
However if 2 of the same coloured arrows follow each other at the same height (price level) either at the peak or the bottom of a curve; then you open a buy/sell trade.
E.g If you have 2 consecutive blue arrows appearing one after the other, at different heights/price levels, do not open another buy trade on the higher blue arrow. As the movement in this upwards direction will soon stop.
The same applies for a Sell Trade with 2 pink arrows appearing at different height/price levels.
E.g If you have 2 pink arrows appearing at the peak of a curve next to each other (around the same price level), make sure to enter into a sell trade.
The same applies for a Buy Trade, when you have 2 blue arrows next to each other at the bottom of the curve, initiate a Buy Trade.
Thank you .
用户没有留下任何评级信息