 MetaTrader 5
 专家
 指标
 程序库
 实用工具
 窗口小部件
 规则
适用于MetaTrader 5的技术指标 - 152
 技术指标的信号外汇和股票市场的开仓交易和平仓交易起着至关重要的作用。指标的本质就是一种交易品种的数学转换,旨在预测未来的价格变化。
测试技术指标可以更有利于预测市场行为并从中获利。
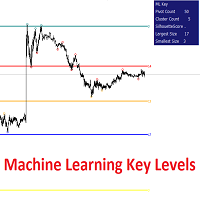
OVERVIEW
This script plots Machine Learning Key Levels on your chart by detecting historical pivot points and grouping them using agglomerative clustering to highlight price levels with the most past reactions. It combines a pivot detection, hierarchical clustering logic, and an optional silhouette method to automatically select the optimal number of key levels, giving you an adaptive way to visualize price zones where activity concentrated over time.
CONCEPTS
Agglomerative cluster

indikator Visual Panel Strengt MultiTimeframe : English Description Visual Panel Strength MultiTimeframe is a real-time trend strength indicator panel that displays the buy/sell pressure across multiple selected timeframes—such as M1, M3, and M5. The indicator utilizes ATR-based volatility analysis and a smoothed trend algorithm to calculate trend signals. Visually presented as a horizontal bar chart at the corner of your main chart, this tool helps traders instantly identify the prevailing
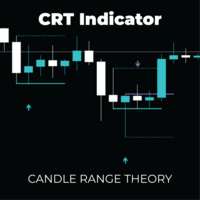
CRT Pro: Multi-Timeframe Reversal System Trade the Trap. Follow the Flow. Front-Run the Institutions. Most retail traders lose money chasing breakouts. The CRT Pro Multi-Timeframe Reversal System is built on one powerful truth: the best trades happen right after the trap is sprung. Candle Range Theory (CRT) identifies the precise moment price sweeps liquidity luring breakout traders in then violently reverses. Combined with a multi-timeframe DSL trend engine, this indicator doesn't just find r
RSI Trendline Breakout Pro RSI indicator with automatic trendline detection and high-precision breakout signals.
Overview Transform your trading with the most advanced RSI trendline breakout system available on the market. This professional indicator combines sophisticated zone-based analysis with automatic trendline detection to deliver high-precision trading signals that work across all timeframes and market conditions. Key Features Advanced Signal Detection Zone-based RSI analysis with aut

ICT Silver Bullet Indicator is designed to make trading the Silver Bullet strategy easier and more efficient. It combines all key parts of the ICT Silver Bullet method and highlights them on the chart, so you can focus on placing trades. Each feature is highly customizable, allowing you to adjust settings and visuals to match your trading style and preferences. The control panel lets you quickly hide or show specific tools for clearer analysis. The indicator also includes an alert system that n
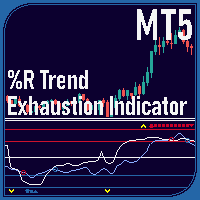
Overview The %R Trend Exhaustion Indicator is a versatile technical analysis tool for MetaTrader 5, adapted from a popular TradingView indicator. It is designed to help traders identify trend exhaustion points, potential reversals, and trend continuation signals across various market conditions. The indicator offers multiple display modes and customizable settings to suit different trading strategies, enhanced with additional features to improve its functionality in the MetaTrader 5 environment.

Double Fractal Entry generates precise entry signals based on smart fractal breakouts or rebounds. It visualizes market structure with dynamic channels and plots clear SL/TP levels. A powerful tool for trend and reversal traders. This product is also available for MetaTrader 4 => https://www.mql5.com/en/market/product/143602 The indicator generates entry points based on two configurable strategies: Fractal Breakout – when price breaks the last key fractal; Fractal Rebound – when price bounces

العربية ### الميزات الرئيسية للمؤشر المُجمّع:
1. **نظام زوايا جان**:
- يرسم خطوط الاتجاه من نقطة بداية بزوايا مختلفة (45 درجة، 90 درجة، إلخ.)
- يتضمن إشارات دخول وتنبيهات لمستويات الأسعار
- يعرض نقاط الارتكاز، ومستويات فيبوناتشي، ونقاط التأرجح
2. **نظام مربع التسعة**:
- يُنشئ مستويات دعم/مقاومة أفقية بناءً على مربعات الأسعار
- مستويات مُرمّزة بالألوان حسب الأهمية الزاوية (0 درجة، 45 درجة، 90 درجة، إلخ.)
- نظام تنبيه قابل للتخصيص لمستويات اللمس
3. **واجهة موحدة**:
- مُعاملات إدخال مُنظّمة

Watermark – Marca D'Água para MetaTrader 5 O Watermark é um indicador visual elegante e funcional projetado para exibir uma marca d'água centralizada no gráfico do MetaTrader 5. Ele mostra automaticamente: Símbolo atual (ex: EURUSD) Timeframe ativo (ex: H1) Nome completo do ativo (opcional) Ideal para traders que desejam personalizar visualmente seus gráficos com informações importantes, mantendo o espaço de negociação organizado e informativo. Principais Recursos: Marca d'água centralizada At
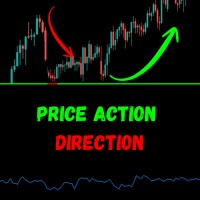
智能趋势识别,实时精确提示。一款工具,多重确认。 Price Action Trend Direction 是一款强大、简洁高效的 MetaTrader 5 指标,融合了动态趋势逻辑、清晰可视化界面以及手机推送通知功能。无论你是剥头皮交易者还是波段交易者,该工具都能为你提供清晰、无噪音的市场方向和趋势强度判断。 功能亮点: 价格动能斜率分析
通过EMA斜率准确识别价格动能,检测趋势方向和强度。 实时趋势强度分级
自动分类趋势为:非常弱、弱、中等、强、极强。 一次性信号提醒(不重复)
每次信号变更仅提醒一次,无重复弹窗,无干扰。 手机推送通知内置支持
即时接收如“EURUSD - BUY NOW”或“趋势变为下跌(红色)”等消息推送至手机。(下方有设置指南) 清晰的可视化界面
趋势颜色线与数值强度在独立窗口显示,界面整洁,决策快速。 多时间周期兼容
适用于任何时间周期和资产:外汇、加密货币、指数、大宗商品。 不重绘 – 真实历史回测
所有信号基于已收盘K线,不会出现重绘情况。你看到的,就是你交易的。 开启手机推送通知方法:

MTF SuperTrend Confluence: Precision Trend Analysis Across Multiple Timeframes Tired of conflicting signals and market noise on a single timeframe? Gain a decisive trading edge by seeing the bigger picture. The MTF SuperTrend Confluence indicator is your all-in-one solution for high-probability trend analysis, meticulously engineered to filter out uncertainty and pinpoint powerful market movements. This powerful tool plots up to three fully customizable SuperTrend indicators from different timef
The Machine Learning Moving Average (MLMA) is a responsive moving average making use of the weighting function obtained Gaussian Process Regression method. Characteristic such as responsiveness and smoothness can be adjusted by the user from the settings.
The moving average also includes bands, used to highlight possible reversals.
USAGE Figure 2 The Machine Learning Moving Average smooths out noisy variations from the price, directly estimating the underlying trend in the price.

Advanced FVG & Order Block Detection System Transform Your Trading with Professional-Grade Market Structure Analysis What You Get: Three Powerful Trading Concepts in One Ultimate Indicator Fair Value Gaps (FVG) Detection: Automatically identifies price inefficiencies in the market Highlights areas where institutional traders may return to fill gaps Visual color-coded zones Real-time detection across any timeframe Order Block Identification: ️ Sophisticated algorithm detects instit

Pixel Minimalist Screener — Trade Smarter, Not Harder Clarity matters. In fast-moving markets, having a clean and focused workspace can make all the difference. The Pixel Minimalist Screener is built for traders who value precision, simplicity, and actionable information — all in one place. Key Features Multi-Timeframe Support
Monitor up to three customizable timeframes on a single screen. Whether you’re scalping, swing trading, or position trading, this screener helps you align with the b

Purpose of the Inside Bar and Outside Bar Breakout Scanner Indicator: The Inside Bar & Outside Bar Breakout Scanner is an advanced dashboard designed to scan multiple instruments and timeframes simultaneously. Its primary function is to identify two powerful candlestick patterns—the Inside Bar (IB) and the Outside Bar (OB) —and then to detect and classify breakouts from these formations. The indicator presents its findings in a clean, organized table, signaling potential trend continuation o
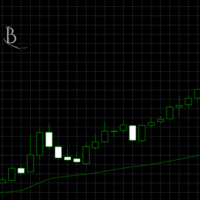
指标:VWAP 与趋势 平台: MetaTrader 5
类型: 自定义指标
显示位置: 图表窗口(叠加) 功能: 计算每个交易日的 成交量加权平均价格(VWAP) 。 基于每根K线的开盘价和收盘价平均值与tick成交量进行 连续VWAP计算 。 每个新交易日自动 重置VWAP计算 。 通过参数 BufferSize (循环缓冲区中的K线数量) 限制数据使用量 。 通过当前VWAP与过去VWAP之间的差值 计算VWAP趋势(斜率) 。 输出两个值: VWAP (以深绿色虚线形式显示在图表上) VWAP趋势 (每根K线的数值,默认不显示) 输入参数: BufferSize (默认值:100)
设置用于计算VWAP趋势的K线数量。 输出值: VWAP 公式:∑(价格 × 成交量)÷ ∑成交量 价格 =(开盘价 + 收盘价)/ 2 每个交易日单独计算 在图表中显示为线条 VWAP趋势 公式:(当前VWAP – 过去VWAP)÷ K线数量 表示VWAP的斜率(正值 = 上升,负值 = 下降) 默认不在图表中显示,但可通过缓冲区访问

周期性成交量轮廓(Periodic Volume Profile) 平台: MetaTrader 5
类型: 自定义指标
显示位置: 图表窗口(叠加) 功能: 实时计算 POC(控制点) 、 VAH(价值区上沿) 和 VAL(价值区下沿) ,基于滑动窗口内的K线数据。 使用 tick 成交量和收盘价来更新每个价格区间的成交量分布。 达到 CleanUpAfter 所设定的K线数量后,自动删除最旧的数据。 若价格超出当前分布范围,自动调整分布范围。 每个价格层的成交量按 tickMultiplier 设置的精度划分。 输入参数: ValueAreaPercent (默认:70)
用于确定价值区域的成交量百分比。 CleanUpAfter (默认:50)
滑动窗口的K线数量限制。超过后会移除旧数据。 输出值: POC(控制点) :滑动窗口内成交量最大的价格。 VAH :价值区域的上边界。 VAL :价值区域的下边界。
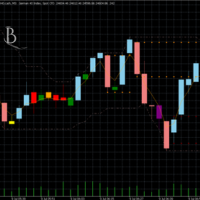
关键蜡烛图形态识别 平台: MetaTrader 5
类型: 自定义指标
显示方式: 蜡烛图彩色叠加 功能: 自动识别特定蜡烛图形态 ,并通过不同颜色加以区分。 每根蜡烛根据类型(如内包、外包、锤头、流星等) 着以专属颜色 。 通过观察这些特定蜡烛图的 组合模式 ,可判断 买方或卖方的活跃区域 。 关键的转折点通过 箭头标记 。 显示 支撑/阻力区域 、 ATR波动范围 、 EMA 均线 和 局部高低点 。 输出多个数据缓冲区: 蜡烛类型分类(含颜色) ATR与真实波动范围 转折点与触发强度 支撑/阻力位 输入参数: TurningPointLookback (默认值:14)
回溯几根K线寻找重复信号确认。 AtrPeriod (默认值:5)
ATR周期,用于过滤低波动或假信号。 工作原理: 每根K线根据结构被归类并着色。 重复的关键K线形成 买卖力量的线索 。 出现可能的反转点时,用 箭头提示 。 有助于识别 重要价格区间与市场行为变化 。

" Blow It Up!" - The Trading Indicator That Questions Your Life Choices Tired of boring indicators? Meet your new market companion that delivers: "YOLO BUY!" arrows when you should probably panic Explosive rectangle confetti (because why not?) 200+ soul-crushing quotes like "Your stop loss is imaginary" and "This is n't trading, it's donating to whales" Random alerts that roast your strategy This Indicator is lik e Therapy - Because daytrading shouldn't fe el like watching paint dry! Highlights

Key Features:
Accurate Buy/Sell Signals (Blue = Buy, Red = Sell)
Advanced SSL Algorithm – Based on dynamic moving average crossovers
Visual Arrows + Colored Dot and Lines for quick decision making
Multi-timeframe compatibility – Works from 1M to Daily
No Repaint, No Delay – Reliable signals in real-time Enter the candle after Dot. Highly optimized & lightweight code for fast execution
Perfect For:
Scalping (1M–5M)
Intraday traders (15M–1H)
Swing trading (4H–D1)
Begin

Trend Hunter Beast MT5 Indicator Easy to follow the overall trend by looking at a higher timeframe. Simple entry when the arrow appears. Exits are made on the opposite arrow, or you can place a stop loss below the last low or high, and a stop loss as desired.
Applies to any Forex asset, although it is recommended to use pairs with low spreads.
You can also use it on crypto assets or indices such as the SP500, etc.
Check the trend on higher timeframes such as D1 and H1, and enter in the same d

SuperTrend Alert with Email Notification – Your Smart Market Sentinel! Overview: SuperTrend Alert with Email Notification is a lightweight and powerful tool that helps traders stay ahead of trend changes in real-time . Built on the widely trusted SuperTrend indicator , this tool monitors price action and instantly notifies you via email when a new BUY or SELL signal is triggered – no more missed opportunities! ️ Key Features: SuperTrend-Based Signals Uses SuperTrend algorithm (ATR-base

The indicator to trade price consolidation is designed to identify price contraction and alerts us on formation. It does this by analyzing historical price data and identifying price action patterns. The algorithm then uses this information to mark the zone , potential targets and liquidity lines, giving us valuable insights into market behavior. Traders can adjust parameters such as colors ,alerts types and how many previously formed zones to display on chart . Furthermore, the indicator can

BBMA Indicator – Precision Trading Made Simple Experience powerful technical analysis trusted by traders worldwide. The BBMA Indicator combines two of the most effective concepts in trading: Bollinger Bands and Moving Averages . Through integrated algorithms, this indicator helps you identify: Optimal Entry & Exit Points → Spot precise trading opportunities based on price movement.
Trend Confirmation → Easily determine if the market is trending or ranging.
Potential Reversals → Receive ear

CycleTrackSwingPro for MetaTrader 5 ️ 在阅读以下详细信息之前,请仔细查看附带的图片。 I. 总体概述 大多数交易亏损的主要原因是缺乏对市场**上下文(CONTEXT) 和其潜在 能量(ENERGY)**的理解。 CycleTrackSwingPro 采用精心设计的 框架(FRAMEWORK) ,专门解决这些关键问题。它通过以下类别视角来优化交易决策: 短期 vs. 长期 动态 剧烈波动(Sharp Jerks) vs. 震荡积累(Accumulation) 衰竭(Exhaustion) vs. 突破(Breakouts) 周期性(Cyclic) vs. 非周期性(Non-Cyclic) 真实行情(Reality) vs. 偏离(Deviation) 此指标提供 全局市场视角 ,通过: 检测 短期行为 (例如价格的剧烈波动)。 绘制 中期高低点 以获取临时洞察。 追踪 长期趋势 ,识别主要的波段(Swings)。 它适用于 手动交易 ,也可作为**专家顾问(EA)的核心信号引擎(Core Signal Engine)**进行集成。未来将持续升级,以

MarketCrack – Whale Detector: 与智能资金保持一致 MarketCrack – Whale Detector 是一款专业的指标,旨在可视化、提前地检测大型市场参与者(即“巨鲸”)的活动。其目的是识别机构压力的关键时刻,使交易者能够与智能资金的方向保持一致,并更加自信地做出战略决策。 功能与目标 MarketCrack – Whale Detector 分析多个关键时间周期(从H1到H12)的价格行为和交易量,以识别机构压力的模式。其系统收集这些信息并以紧凑、专业的视觉面板呈现,清晰显示每个时间周期中“巨鲸”活动的强度和方向。当多个时间周期对齐时,该指标会自动突出显示,让用户能够更早地发现由大型交易者主导的趋势,并做出明智的决策。 确认与警报 为了提高稳健性,当所有时间周期都显示同一方向的压力时,信号被视为确认。然而,警报系统经过优化,旨在预测机会:当7个时间周期中至少有6个显示一致信号时,警报就会触发。这使得用户能够领先于巨鲸的行动,同时不失检测的稳健性。 配置与个性化 默认设置(ATR为30,成交量为10)旨在提供专业且多币种的平衡,适应大多数资产和交易风

Advanced MT5 Indicator: Precision-Powered with Pivot Points, MAs & Multi-Timeframe Logic Unlock the full potential of your trading strategy with this precision-engineered MetaTrader 5 indicator —an advanced tool that intelligently blends Pivot Points , Adaptive Moving Averages , and Multi-Timeframe Analysis to generate real-time Buy and Sell signals with high accuracy. If you want to test on Real Market, Let me know. I will give the Demo file to run on Real Account.
Whether you're a scal
Oscillator Alerts MultiPanel All oscillator signals — in a single panel!
A professional multi-panel tool for market control, based on major oscillators with a flexible alert system and unique interactive management features. Description Oscillator Alerts MultiPanel is an innovative tool for traders that brings together multi-symbol and multi-timeframe analysis, flexible notifications, and the most convenient interactive control — all right on your chart. Key Advantages Interactive Oscillator Se

Zephir Power Indicator v1.30 — Breakout Signal & Statistics Tool for MetaTrader 5
Full strategy Guide on purchase - Trader with track record and 8 years of experience EXTRA COPY FOR TRADING VIEW FOR THIS INDICATOR
Zephir Power Indicator v1.30 is a high-performance breakout detection tool for MT5 that identifies precise bullish and bearish entry points based on candle body breakouts, ATR filters, and optional trend confirmation. Designed for professional traders, this indicator visuall
Trader Dynamic Index_Pro 信号已添加
这是Traders Dynamic Index指标的增强版,集成了上下文感知信号、多层次确认以及市场节奏同步。专为专业交易员在手动交易和智能交易系统中使用而设计。 您将很难忽视这个指标——它超越了当前大多数震荡指标,具备上下文分析、趋势识别、动态震荡范围、背离检测,尤其是市场节奏的整合。几乎没有任何指标能达到如此全面的水平。
I. 引言 请 先查看附图 ,以便直观了解该指标的高效性, 再继续阅读详细介绍 。 这是我经过长时间开发和优化的成果。在创建过程中,我反复 修改了近40个版本 ,倾注了自己在 交易领域 的全部经验和对 交易者实际操作场景的理解 。 这个指标不仅仅是一个技术工具,更是 逻辑与实战经验的结晶 ,旨在帮助交易者更好地把握市场节奏,实现高效交易。 我将 持续更新和改进 该指标,使其始终适应市场变化。您的支持和反馈对我而言非常宝贵。 立即下载演示版,体验不一样的交易感受。 II. 主要功能 II.1 高级 RSI 架构 该指标在传统 RSI 基础上进行了改进,添加了 动态阈值 、 趋势叠加 和 信号标记 ,
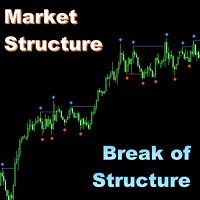
Market Structure - Break of Structure (MS-BOS)(MT5 版) 在图表右侧中央新增了一个简单的面板,用于显示该指标在当前设置下、在主要时间周期组中最近一次结构突破(BOS)的方向。该面板可在参数中关闭。
我的所有指标仅在K线收盘时运行,并且不会重绘已经绘制的数值(除非描述中另有特别说明)。因此它们完全适用于自动交易以及进行高质量的技术分析。 市场结构 — 结构突破。该指标基于反转点(也称为"分形"),并在价格上方和下方这些反转点所在的位置以"菱形"标记将其绘制在图表上。 反转点是这样一根价格柱(蜡烛):其顶点高于其左右相邻柱的顶点。与现有的同类指标相比,在指标设置中既可以指定"分形"柱之前的柱数 (1),也可以指定其之后的柱数 (2);如果将 (2) 设为 0(默认值),则左右两侧采用相同的设置 (1)。
结构突破是指在该"反转点"之后的价格走势中,某根价格柱(蜡烛)收盘于或穿越该反转点的极值价格之外(即:对于上方"分形",收盘或穿越高于该柱的最高价 High;对于下方"分形",收盘或穿越低于其最低价 Low)。指标设置中的参数 (3)
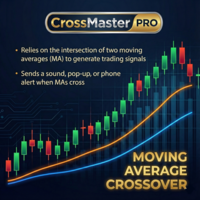
CrossMaster PRO – Where Trends Reveal Themselves CrossMaster PRO is a precision-built indicator designed to identify critical moments where market direction begins to shift. By monitoring the interaction between two moving averages, it delivers clear signals exactly when timing matters most. Built for traders who value clarity over noise, this tool transforms simple crossovers into actionable insights, supported by intelligent alerts and a clean visual structure.
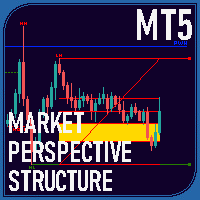
Overview The Market Perspective Structure Indicator is a comprehensive MetaTrader indicator designed to provide traders with a detailed analysis of market structure across multiple timeframes. It identifies and visualizes key price action elements, including swing highs and lows, Break of Structure (BOS), Change of Character (CHOCH), internal structures, equal highs/lows, premium/discount levels, previous levels from higher timeframes, and trading session zones. With extensive customization opt

WaveTrendPro Arrow – Adaptive Cross Signal with Smart Alerts Description WaveTrendPro Arrow is a clean and powerful visual indicator designed to detect trend-reversal points using the classic WaveTrend oscillator (WT1/WT2 cross) , enhanced with intelligent on-chart arrows , real-time alerts , and mobile push notifications . Unlike traditional WaveTrend indicators that display signals in a subwindow, this version shows precise entry arrows directly on the main chart , positioned adaptively

### EMA Oscillator Analysis **Working Principle:** 1. **Main Line Calculation (BufferV):** - Computes price deviation from adaptive EMA. - Formula: `BufferV[i] = Close[i] - (alpha * Close[i] + (1-alpha) * BufferV[i-1])` - Where `alpha = 2/(ema_period+1)`.
2. **Volatility Bands:** - `BufferDev`/`BufferNegDev`: ±1 standard deviation. - `BufferDevLimit`/`BufferNegDevLimit`: ±2 standard deviations (multiplied by `limit_factor`). - Standard deviation is calculate

Taking orders, now on MT5 the TPX Dash Needle is everything you need to find the famous Didi Needles on several timeframes and in several pairs at the same time. These are the simultaneous meeting of the 3, 8 and 20 averages that, aligned with the ADX indicator, are synonymous with large and strong movements in the market. Now with the new Heiken Aish filter, the name of the pair shows the direction of the Heiken Aish you choose, it can be weekly or daily, all signals will appear on the screen,
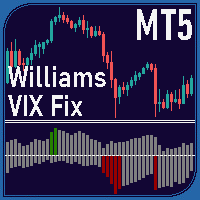
Overview The Williams VIX Fix Indicator is a MetaTrader 5 tool designed to help traders identify potential market tops and bottoms. By analyzing price extremes relative to recent highs and lows, it highlights overbought and oversold conditions using two histograms displayed in a separate window. The indicator combines the Williams VIX Fix calculation with Bollinger Bands and percentile-based thresholds to provide clear signals for potential reversals. Key Features Market Tops and Bottoms Market

Mantis Shrimp Convergence (MSC) A new way to see market momentum — no lag, no confusion.
What is MSC? Mantis Shrimp Convergence (MSC) is a powerful non-repainting oscillator, inspired by the logic of MACD but rebuilt for modern trading: zero lag, no false divergences, and dual-line precision. Designed for traders who demand clarity, speed, and reliability, MSC reveals momentum shifts with unmatched visual and structural accuracy.
How it Works MSC uses two signal lines — Fast and Slow,
Trend Frequency Market MT5 Carry out analysis and backtest even before opening your orders, check the strategy's Winrate and stay in favor of the Trend and the strength of the movement.
The TFM indicator is specialized in providing you with the strength points of the movement, painting the candles GREEN or RED to report price aggression from the Players who are acting at the exact moment. Taking advantage of this detection, the indicator plots Arrow and Entry, Stop Loss and Take Profit levels

TimeGap Block SMC v3.00 Professional Time Gap Analysis Indicator for MetaTrader 5 TimeGap Block SMC is a professional MetaTrader 5 indicator designed to identify and analyze Time Gap zones within market structure. It automatically detects price areas where the market moved too quickly, spending very little time inside a particular price range. These areas often become significant support and resistance zones and can provide valuable trading opportunities when price revisits them. The indicator i

True Volume: See the Story Behind the Price
Recommended Experience Level: Intermediate to Advanced True Volume is not just another histogram; it is a forensic analysis engine for price action. While standard volume indicators only tell you how much was traded, True Volume tells you who traded it and who won . By combining Geometric Decomposition , VSA (Volume Spread Analysis) , and Anomaly Detection , this indicator dissects every bar to reveal the hidden battle between Bulls
多时间周期移动平均线指标 使用多时间周期移动平均线指标,更深入地了解市场趋势。这款强大的 MQL5 工具允许您在单个图表上同时显示来自五个不同时间周期的移动平均线。无需在工作区中堆叠多个指标实例,即可从不同角度全面了解价格动态。 主要特点: 多时间周期分析: 在一个图表上显示来自五个不同时间周期(例如,M15、H1、H4、D1、W1)的最多五条移动平均线。 可自定义周期: 轻松设置所有显示线条的所需移动平均线周期。 多种均线类型: 从广泛的移动平均线类型中选择,包括简单移动平均线 (SMA)、指数移动平均线 (EMA)、平滑移动平均线 (SMMA) 和线性加权移动平均线 (LWMA)。 可调节时间周期: 选择您希望监控的任意五个时间周期,提供无与伦比的灵活性。 清晰的可视化: 一目了然地查看多个趋势视角,帮助您识别不同时间周期之间的汇聚或背离。 为 MQL5 优化: 专为 MetaTrader 5 平台开发,确保流畅的性能和可靠性。 无论您是剥头皮交易者、日内交易者还是长期投资者,此指标都能提供市场的整体视图,帮助您做出更明智的交易决策。避免在图表之间切换或添加
多时间周期RSI指标 使用我们直观的RSI指标,释放多时间周期分析的强大功能! 在一个图表上全面了解不同时间周期的市场动量。我们的多时间周期RSI指标允许您在五个可自定义的时间周期中以一致的周期跟踪相对强弱指数(RSI),使您能够做出更明智的交易决策。 主要特点: 同步多时间周期视图: 在一个图表上同时监控多达五个不同时间周期的RSI,无需在窗口之间切换。 可自定义时间周期: 定义您喜欢的时间周期以适应您的交易策略,从M1到MN。 统一的RSI周期: 在所有选定的时间周期中保持一致的RSI计算周期,以便进行直接比较。 清晰的视觉表示: 轻松识别超买/超卖情况以及多个市场周期中的动量变化。 增强的决策制定: 发现时间周期之间的背离和趋同,提供对市场趋势的更深入洞察。 用户友好的界面: 简单直观的设置,可立即使用。 为什么选择我们的多时间周期RSI? 该指标是寻求改善市场分析的交易者不可或缺的工具。通过提供跨各种时间周期的RSI的整体视图,您可以更好地理解资产的潜在强度或弱点,并预测潜在的价格变动。无论您是日内交易者、波段交易者还是长期投资者,该指标都将显著提高您的分析能力。

GoGo Breaker – The Master Candle Signal 基于价格行为的智能信号,带有高级过滤器 GoGo Breaker 是一款功能强大的交易指标,它使用**“主蜡烛”(Master Candle) 模式来实时识别高概率交易机会。该指标专为寻求 快速、精准进场 的交易者设计,是 剥头皮、日内交易和波段交易**的理想选择。 通过清晰的箭头自动检测买入/卖出信号。 适用于所有市场:外汇、指数、大宗商品和加密货币。 灵活:可单独使用,也可与其他指标结合使用以提高准确性。 推荐策略 基础策略:使用 VIDYA + 抛物线转向指标(Parabolic SAR)进行优化 (过滤掉明显趋势中的信号并避免假突破) 买入规则: 出现 GoGo Breaker 信号 (绿色箭头)。 随后的蜡烛 在 VIDYA 之上开盘和收盘 。 抛物线转向指标(Parabolic SAR) 位于 价格下方 (确认上涨趋势)。 卖出规则: 出现 GoGo Breaker 信号 (红色箭头)。 随后的蜡烛 在 VIDYA 之下开盘和收盘 。 抛物线转向指标(Parabolic SAR) 位于 价格上方
Candle Movement Index (CMI) — Visual Candle Strength Indicator for MT5 The Candle Movement Index (CMI) is a powerful MT5 indicator that visually measures the strength and momentum of each candle. It provides a color-coded representation of candle behavior, allowing traders to easily spot trend strength, market reversals, and volatility zones. This indicator is ideal for scalpers, intraday traders, and swing traders who want a quick and reliable visual confirmation of candle strength. Key Featur
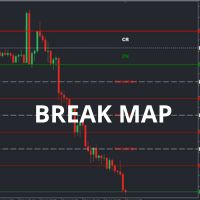
The Channel Break Map is a next-generation indicator for MetaTrader 5, designed for traders looking to maximize profits and minimize risks through precise analysis of channel breaks and trends. With an interactive interface and innovative features, this indicator is the ultimate tool for identifying opportunities in any financial market.
What Does the Channel Break Map Do? Dynamic Channels:
Establishes support (green) and resistance (red) lines, with a central line (white) marking the equilibr
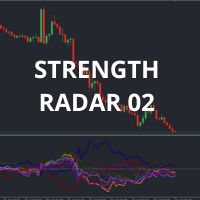
Strength Radar 02 – Take Your Trading to the Next Level!
Hello, trader! If you're looking for a tool to level up your game in forex, Strength Radar 02 is exactly what you need! Developed with passion and expertise, this indicator turns currency strength analysis into something simple and powerful. With it, you'll have a clear view of the real-time performance of AUD, CAD, CHF, EUR, GBP, NZD, JPY, and USD , using indicators like MA, MACD, RSI , and more — all fully customizable your way!
Ima
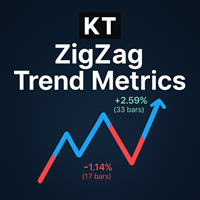
KT ZigZag Trend Metrics 将市场波动转化为一张清晰易读的趋势与结构“地图”,让初学者也能一眼看出转折点与行情流向。指标为每个摆动标注出“Higher High、Lower High、Lower Low 或 Higher Low”,并显示相对前一摆动的百分比变化。 它还显示形成新高或新低所耗费的 K 线数量,并在最近的高低点之间绘制连线,像给价格走势做“X 光”,帮助你轻松识别常见谐波形态。
功能亮点
一眼勾勒完整市场结构,大幅节省分析时间,是价格行为交易者的必备工具。 标注摆动高低点,显示百分比幅度及距上一次摆动的 K 线数。 保持图表整洁,仅展示关键摆动数据。 所有数据均基于广受欢迎的 ZigZag 指标计算,定位摆动精准。 可调节摆动灵敏度(depth 周期),精准控制识别位置。 自定义颜色、线宽与文字大小,匹配你的图表主题。
优于标准 ZigZag 的原因 传统 ZigZag 只在过去的摆动点间画线,并未告诉你每段行情有多大、耗时多久。 KT ZigZag Trend Metrics 为每个摆动标注百分比和 K 数,并绘制区间线,揭示隐藏模式;更多细节让

Overview
Support & Resistance (MTF) is a MetaTrader 5 indicator that automatically identifies swing highs (resistance) and swing lows (support) across up to three timeframes. It merges nearby levels to reduce clutter, adapts zone width to market volatility using ATR, and offers optional alerts when price breaks or retests those levels. Features Multi-timeframe pivot detection
Identify pivots on the current chart plus two higher timeframes using a configurable pivot length. Merge-distance grou
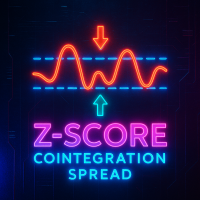
指标计算并显示 Z-Score 价差(协整价差),用于衡量两个金融工具之间的偏离程度。它基于最小二乘法(OLS)估算两个符号价格之间的关联系数 β,然后将价差分布标准化为 Z-Score。 在工具的独立窗口中,您将看到: 主 Z-Score 线(红色) 用户设定的上限和下限阈值(银色,虚线) 当 Z-Score 达到阈值时,指标会发出潜在的价差反转信号: Z-Score ≥ +Threshold → 做空第一个符号,做多第二个符号 Z-Score ≤ −Threshold → 做多第一个符号,做空第二个符号 此外,图表上还会显示推荐的头寸大小(手数)文本标签,可手动设置或根据波动率(ATR)自动计算。 如何使用 将指标加载到任何时间周期,选择您想作为第一个工具(Symbol1)的符号。 打开指标参数窗口,指定要分析价差的第二个符号(Symbol2)。 设置协整周期(CointegrationPeriod)、Z-Score 计算周期(ZScorePeriod)以及阈值(Threshold)。 选择手数计算方式:手动输入两个手数,或保留第二个手数由 ATR 自动计算。 当图表出现信号时,参
「我想确认上位周期的趋势方向,但频繁切换图表时间周期真的很麻烦啊……」
这个产品正是为你准备的!
Trend Map
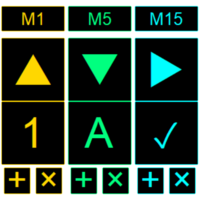
- 产品概述 本工具可以记录每个时间周期(或每个分形结构)的趋势方向,并将其持续显示在图表上。即使切换图表时间周期,面板仍会保留显示,因此特别适合频繁切换周期查看图表的交易者。它可以帮助你快速确认趋势方向,从而实现无压力交易。此外,你还可以通过一键操作,添加或删除每个周期的高低点参考线。请注意,这不是自动交易系统,而是一个辅助手动交易的工具。
- 功能说明 1. 面板单元 界面中竖直排列的单元区域。最多可显示10个,每个单元可设置不同的主题颜色。
2. 说明标签 面板单元最上方的标签,可自由输入文字(如时间周期名等)。可在设置中关闭显示。
3. 趋势箭头按钮 用于表示趋势方向的箭头,包括上升趋势(↑)、下降趋势(↓)和震荡区间(→)。点击按钮可切换状态,共有4种样式可选。
4. 文本输入框 可输入任意文字。例如你可以记录艾略特波浪的波数等。可在设置中关闭显示。
5. 添加线按钮 每个面板单元内都有一个“+”按钮,点击可在图表

Overview Harmonic Patterns MT5 is a technical analysis indicator designed for the MetaTrader 5 platform. It identifies and displays harmonic price patterns, such as Butterfly, Cypher, Crab, Bat, Shark, and Gartley, in both bullish and bearish directions. The indicator calculates key price levels, including entry, stop loss, and three take-profit levels, to assist traders in analyzing market movements. Visual elements and customizable alerts enhance usability on the chart. Features Detects six ha

Purpose : The AllAverages indicator plots a moving average line on the chart, with options to select from a wide range of MA types and price applications. It also displays buy and sell signals as arrows when the trend changes, and supports alerts (sound, email, push notifications) for these signals. Key Features : Supports multiple moving average types (e.g., SMA, EMA, HMA, TEMA, etc.). Allows customization of the price type (e.g., Close, Open, High, Low, Heiken Ashi variants). Displays a colore

ATR Info Display 是一款可视化指标,能够自动计算多个时间周期上的平均真实波幅(ATR),并直接在图表中显示。 它帮助交易者一目了然地识别市场波动情况。 功能特点: 日、周、月 ATR 水平线
根据每个周期的开盘价绘制的上下波动范围水平线。
支持颜色、样式和可见性设置。
日线 ATR 有助于评估当天市场的预期波动范围。
周线 ATR 特别适合用于波段交易判断。 日内波动率百分比(图表右上角)
显示当前日内价格变动与平均日波动范围的对比。 颜色指示: 黑色:波动率低于 100%(市场可能还有空间) 红色:波动率达到或超过 100%(市场可能已经耗尽动能) 交易建议:
当波动率超过 100% 时,市场已经完成了典型的日内波动。
此时应谨慎开仓 ,因为可能出现反转或震荡行情。
这有助于避免过度交易和控制风险。 可调节文本显示
可修改字体大小及其在图表中的 X/Y 位置。 ️ 适用场景: 本指标非常适合希望快速判断市场波动强度的交易者,无论是用于突破交易、区间交易还是风险管理。

Overview
Supply & Demand (MTF) v1.00 is a MetaTrader 5 indicator that automatically identifies and draws key supply and demand zones from up to three timeframes on your current chart. Supply zones mark areas where selling pressure was strong; demand zones mark areas where buying pressure was strong. Features Multi-timeframe detection
Scan the current chart plus two higher timeframes for zones. Candle-strength filter
Require a configurable number of strong candles to confirm each zone. Adjust
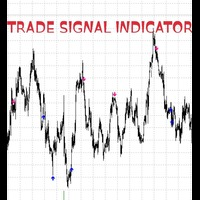
BUY & SELL ARROW INDICATOR - Professional Trading Signals! CRYSTAL CLEAR TRADING SIGNALS WITH PRECISION ACCURACY. WORKS ON ALL TIME FRAME, BEST ON 1HR TIME FRAME WHAT MAKES THIS INDICATOR REVOLUTIONARY? NO REPAINTING - NO GUESSWORK - NO REGRETS! 100% ACCURATE SIGNALS that never change or disappear ZERO OFFSET - Signals appear exactly when they should PERFECT PRECISION. INSTANT VISUAL CLARITY CRYSTAL CLEAR BLUE ARROWS for BUY signals STRIKING PINK ARROWS for SELL signals CLEAN CHART INTERF

Momentum Potentia Altopium is a trend and momentum indicator. The channel identifies support and resistance zones and therefore pullbacks and breakouts.
Bullish : When the price is above the channel and the color is green the market has strong upward momentum. Bearish : When the price trades below the channel and the color is light red, the market has strong downward momentum.
This indicator can be used in two ways:
Pullback : when the trend is up or down and the price returns to the channel

成交量与流动性猎手 – 剥头皮指标 是一款专业级别的剥头皮指标,旨在追踪多个时间框架下的实时成交量激增和流动性区域。
它结合了聪明资金(Smart Money)概念与实时交易条件,使其成为精准剥头皮交易的理想工具。无论您是在交易反转、突破还是公允价值缺口(FVG)——该指标都能帮助您识别真正的买卖压力集中在哪里。 实时成交量检测
追踪逐笔成交量(Tick Volume)的激增,并与近期历史数据进行对比,以突出显示异常的市场活动。 流动性区域识别
自动检测公允价值缺口(FVG)和潜在的订单区块(Order Blocks),标出价格可能发生反应的区域。 多时间框架分析 从 M5 到 H4,您可以自由控制并隐藏任何时间框架
在图表上直接显示清晰的柱状图和方框,界面简洁,不干扰交易,且可自定义。 该指标持续扫描市场中的以下内容: 成交量失衡 :逐笔成交量相对于平均值的突然激增或下降。 流动性区域 :公允价值缺口(FVG)、未成交的影线(Untapped Wicks)以及潜在的聪明资金足迹(Footprints)。 共振信号 :只有当多个因素(成交量、RSI、趋势、区域接触)同时满足时,才
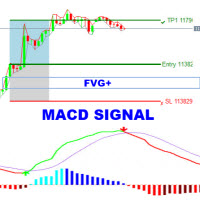
The MACD-FVG Signal System is a hybrid trading indicator that combines the power of momentum analysis through the MACD (Moving Average Convergence Divergence) with the precision of Fair Value Gap (FVG) detection to generate high-probability buy and sell signals. This indicator enhances traditional MACD signals by validating momentum shifts with market inefficiencies, offering traders a more refined entry strategy. Key Features: MACD with Histogram Display
Clearly visualizes the MACD line, Signa

This is a powerful indicator that groups multiple Expert Advisors (EAs) by strategy and displays aggregated performance results directly on the chart. Grouping is optional — you can use it even without organizing EAs into groups. It automatically calculates and visualizes performance within a specified aggregation period. You can exclude specific magic numbers or aggregate results across multiple magic numbers as a group. Additionally, by using partial string matching based on EA names, you can
Trading hours, Market hours, Business hours, Forex trading hours, Trading schedule, Market open/close times, Trading time zones, Time zone indicators, Market clock, ICT, Asia KillZone, London Killzone, New York Killzone
**Prices tend to move and form every 2 - 4 hours.**
Traders should pay attention to the impact of trading time zones, as different market hours and trading volumes can directly affect the volatility and trading opportunities of a currency pair. To help traders understand the m
ZeroLag T 3 Signal Suite The Ultimate All-in-One Trading Companion for XAU USD 15-Minute Charts Join the Group Chat - Community Group Download the Free Simple Trade Utility making your pending order placement simple. Unlock the power of precision trading with the ZeroLag T 3 Signal Suite —an advanced indicator designed for traders who demand speed , accuracy, and actionable insights . Built on the renowned Zero Lag T 3 smoothing algorithm, this tool delivers lightning-fast trend d
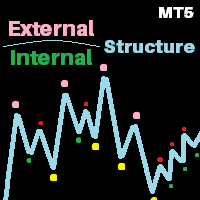
V2 of the Perfect structure.
What's Inherited from v1?
This is the finest structure marking you will ever find in any market. Indicator is coded considering the actual structure any trader would use. Indicator is coded based on actual candle breaks and not coded based on any pivot or predefined values or specific number of candles high and low. Please check out the screenshot. What's new in V2? AI based approach for High accuracy by calculating maximum bars with rapid switch algorithm. Dual tim
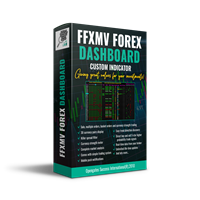
FULL FOREX MARKET VIEW 仪表盘指标 MT5 这是一个为 MT5 平台开发的自定义指标,旨在为交易者提供对市场的全面了解。它使用实时数据来分析市场,并显示成功交易所需的所有信息。 安装: 在将此指标附加到图表窗口之前,请进入 MT5 的“市场报价”面板,隐藏所有不需要或不交易的货币对,只保留你交易的那些。原因是 FFMV 仪表盘会显示 MT5 市场报价中的所有货币对,最多可显示 26 种。如果超过 26 种,FFMV 仪表盘上的字体和图像会变得模糊并失真!将无法正确显示。 用途: 单一交易 组合交易(请参阅截图) 也可用于多订单交易 用于确认来自你交易系统的信号等 组件: 时间框架:从 M1 到 MN1 当前蜡烛状态(买/卖) 趋势:货币整体趋势 影响:货币波动的幅度/波动性(见下): Build-up: 货币刚开始形成趋势 Good: 货币走势逐渐增强 High: 值得关注 Strong: 方向应予以考虑 Very strong: 接近完美 Excellent: 信号达到最佳,可以交易 变化:货币横盘、上涨或下跌 评级:交易可靠性 如何使用仪表盘: 所有时间框架从

3 Trading Strategies to Exploit Market Structure (Without Overcomplicating It)
Trading isn’t about predicting the future—it’s about spotting patterns, managing risk, and acting when odds favor you. Below are two timeless strategies (and one hybrid) that align with how markets actually move, not how we wish they would. Some of the strategies you can trade with the indicator [ Note] Higher timeframe should be 15x of the lower timeframe, for eg. htf 15min, ltf 1min. 1. The Breakout Trap: Trad
Engulfing Zone Sniper MT5 — Multi-Timeframe Signal & Zone Indicator The Engulfing Zone Sniper MT5 is a technical analysis tool designed to highlight engulfing candlestick patterns in combination with adaptive support/resistance zones. It provides visual markers and optional alerts to assist traders in identifying market structure reactions across multiple timeframes. Key Features Multi-Timeframe Detection – Option to scan higher timeframe engulfing setups with lower timeframe confirmation. Su

Smart Risk Manager Dashboard is a MetaTrader 5 indicator designed to assist traders with structured risk control and real-time account monitoring.
It provides a visual interface for managing position size, tracking losses and gains, and setting custom trading limits. Key Features SL/TP Risk Calculator
Displays estimated risk and reward directly on the chart using adjustable horizontal lines. Live Dashboard with Metrics
Shows equity, balance, daily gain/loss, trade count, and other key values i

Mikko Breakout Indicator – MetaTrader 5 智能突破识别指标 适用于 MetaTrader 5 的专业突破指标,支持外汇、指数和加密货币市场。 SqueezeMAX Pro 是一款专业级突破识别指标,专为追求客观性、精准度和真实执行性能的交易者设计。无重绘、无虚假信号。 该指标适用于真实账户、VPS 以及持续运行的交易环境,基于动态高点与低点的稳健逻辑,在突破发生的第一时间进行识别。 为什么经验丰富的交易者选择 SqueezeMAX Pro 有效减少图表噪音和滞后信号 实时识别高质量突破 自动适配图表显示风格 信号在 K 线收盘后固定,不会改变 极低 CPU 占用,适合 VPS 适用于外汇、指数、股票和加密货币交易,从剥头皮到波段交易均可使用。 运行逻辑 计算指定周期内的最高价与最低价 当价格突破周期最高点时识别为多头突破 当价格跌破周期最低点时识别为空头突破 实时更新显示,不重算历史 K 线 所有信号均在 K 线收盘后确认。
不发生重绘。 智能自适应可视化 SqueezeMAX Pro 可自动匹配当前图表类型,无需重新加载指标。 模式 说明 自动

Momentum Hunter – 高级无重绘动量指标 Momentum Hunter 是一款强大且可靠的指标,旨在检测新的市场动量,帮助交易者精准捕捉行情走势。该指标专为 M1 时间框架 优化,同时也适用于更高的时间框架,适合剥头皮和波段交易者。 主要功能: 无重绘 & 无延迟 :信号稳定,箭头只在蜡烛收盘后出现。 简洁界面 :图表干净简洁,仅显示箭头、止损价格标签和跟踪止损价格标签,无复杂按钮。 即时提醒 :每当信号出现时,可直接在 MetaTrader 和您的移动设备上收到通知。 适合所有交易者 :无论您是在 M1 剥头皮还是在高时间框架交易,Momentum Hunter 都能适应您的交易风格。 此高级工具结合了多种经过验证的策略,包括:
移动平均线 用于趋势方向
布林带 用于波动率分析
RSI 用于动量强度
蜡烛形态分析 用于精准入场 通过这种智能组合, Momentum Hunter 能识别高概率入场点,并直接在图表上显示 箭头 ,帮助交易决策更加快速明了。 为您的安全而设计 Momentum Hunter 不仅仅是一个入场信号工具:
安全止

The ** SmoothedTrender Indicator** is a custom MetaTrader 5 (MT5) indicator designed to display smoothed Renko bars on a chart, helping traders identify trends with reduced market noise. It transforms traditional price data into Renko bars, which are based on a user-defined price movement (brick size) rather than time, making it easier to spot significant trend changes. The indicator applies a smoothing mechanism to the price data, enhancing clarity by filtering out minor fluctuations.
### Key
学习如何在MetaTrader AppStore上购买EA交易,MetaTrader平台的应用程序商店。
MQL5.community支付系统支持通过PayPay、银行卡和热门付款系统进行交易。为更好的客户体验我们强烈建议您在购买前测试EA交易。
