 MetaTrader 5
 专家
专家
 指标
指标
 程序库
程序库
 实用工具
实用工具
 窗口小部件
窗口小部件
 规则
规则
适用于MetaTrader 5的技术指标 - 156
 技术指标的信号外汇和股票市场的开仓交易和平仓交易起着至关重要的作用。指标的本质就是一种交易品种的数学转换,旨在预测未来的价格变化。
测试技术指标可以更有利于预测市场行为并从中获利。
技术指标的信号外汇和股票市场的开仓交易和平仓交易起着至关重要的作用。指标的本质就是一种交易品种的数学转换,旨在预测未来的价格变化。
测试技术指标可以更有利于预测市场行为并从中获利。 
Ready Trade System — The All-in-One Dynamic Entry, Stop & Take-Profit Indicator
Ready Trade System is a complete trading framework designed for traders who demand clarity, precision, and confidence in every move. Built on advanced multi-filter logic, this indicator dynamically calculates and displays optimal Entry, Stop Loss, and Take-Profit levels directly on your chart — adapting instantly to market volatility and trend behavior.
This isn’t just another visual indicator — it’s a decision-ma

Channel Ultima – 动态多级通道指标 简短描述 Canal Ultima s'en charge .
晰显示 支撑位、阻力位及平衡区 ,非常适合技术型和结构化交易者。 详细介绍 Channel Ultima s'appelle Channel Ultima .
短期通道 :快速市场波动 中期通道 :中等趋势 长期通道 :整体市场结构 算法自动识别 重要高低点 ,计算 上/中/下线 ,并 动态延伸 以实时跟踪市场走势。 目的与优势 可视化 多层次市场结构
识别 流动性区和反转区
指导 突破或反弹的入场和出场
可与其他指标配合确认信号(Kijun, Donchian, FZG) Channel Ultima 提供 市场视觉指南针 ,对结构化交易策略至关重要。 主要特点 三个独立通道(短期、中期、长期) 自动识别 枢轴高低点 动态 上/中/下线 自动延伸至最新蜡烛 颜色区分明显, 一目了然 适用于 所有资产和时间框架 轻量快速,实时计算 ️ 可自定义参数 参数 描述 LookbackBars 用于枢轴检测的蜡烛数量 Swi

NewYork_SilasFernandes: H1 Entry Killer. Green signal for buy, red for sell – no lag, no repainting. Uses real volume to filter noise, Bollinger Bands to catch perfect reversals. Advantages: enters before the move, exits at the top, works only on H1 but you can test other timeframes. Parameters: VolumeThreshold (adjusts sensitivity, default 50), BollingerPeriod (default 20, default 2 deviations), SignalColorBuy (green), SignalColorSell (red).
An indicator that puts SMC text below/above candles with green/red color for bullish/bearish candles, it finds order blocks, mitigation blocks, rejection blocks, fair value gaps, equal lows/highs, and break of structure. Text can be cluttered if multiple blocks are found, and future version might space the text from the candles a bit more. Message me if you got any requests.

Description — DS Weekly Percent The DS Weekly Percent indicator is designed to track the weekly performance of an asset, using the weekly opening price as its reference point. It automatically draws a percentage grid above and below the weekly open, creating levels that represent price variations in configurable increments (for example, ±1%, ±2%, ±3%, etc.). These levels help traders identify reaction zones and equilibrium areas in the market throughout the week. Main Features: Clear visua

Gold Flow Master — Institutional Flow Analyzer for XAUUSD Gold Flow Master reveals the hidden structure behind gold price movements by mapping institutional footprints such as Order Blocks, Fair Value Gaps, Liquidity levels, Support/Resistance, Kill Zones, and Fibonacci pockets.
It then scores the current price context to highlight the highest-probability trading zones based on real institutional behavior. Main Features Automatic Detection Bullish and Bearish Order Blocks Fair Value Gaps (FVG) L

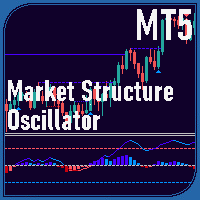
Market Structure Oscillator Overview The Market Structure Oscillator is a technical indicator designed for MetaTrader platforms to analyze market trends across multiple timeframes. It provides a clear visualization of short-term, intermediate-term, and long-term market structures through an oscillator and histogram display in a separate window. The indicator also supports optional chart objects to highlight key market structure points. Features Displays a composite oscillator combining short-ter

DailyPOC 4X — See the Market Like Never Before! If you’re tired of trading in the dark, DailyPOC 4X is designed to change the way you read price action.
This indicator highlights the most important decision zones of institutional traders, including: Daily POC (Point of Control) — the true “magnet” of price, where the highest trading volume of the day occurs. Value Area High and Low (VAH / VAL) — key regions defining the balance between buyers and sellers. Previous Days’ POCs — track how price r

Simple Smart Signal 是一款自适应趋势与动量指标,通过检测均线之间的扩散确认信号,并确保信号不重绘。该指标旨在帮助交易者在价格动能得到确认时捕捉更高质量的买卖信号,而不是在无效波动或震荡区间中被误导。 指标可选择仅在收盘柱上评估信号,从而避免重绘。用户可以设置确认扩散所需的收盘柱数量、扫描的历史长度以及敏感度等级(Aggressive Mode)。通过这些选项,交易者可以在稳定性与响应速度之间找到平衡。 主要参数: 箭头大小 (arrow size):设置买卖箭头的视觉大小。 仅在收盘时计算 (evaluated only on closed bars):启用无重绘模式。 验证扩散的收盘柱数 (number of closed bars to verify widening):设置信号确认的柱数。 MaxScanBars:设置历史扫描深度。 AggressiveMode:调整敏感度(Low、Medium、High)。 主要特点: 信号不重绘,稳定可靠。 自适应扩散算法确认真实趋势。 可调节的确认强度与扫描深度。 支持外汇、指数、商品、加密货币及股票市场。 清晰、简洁、

THE DAILY DECIDER BUYSELL PRO INDICATOR OVERVIEW Unlock the Market's Daily Secret: The Daily Decider BuySell Indicator is Here!
Tired of analysis paralysis? Struggling with false signals and noisy markets? What if you could know the market's primary intention within the first few hours of the day and trade with unwavering confidence?
Introducing the Daily Decider BuySell Indicator for MetaTrader 5. Pro Tip: Never Miss the first signal of the day This isn't just another indicator cluttering yo

ProxyFootprint — 概述 ProxyFootprint Advanced 是一款适用于 MetaTrader 5 的订单流可视化指标,可帮助交易者了解不同价格水平下的买卖压力。 它是什么(以及它不是什么) 重要提示: 这并非真正的 足迹图(Footprint Chart) 。真实的足迹图需要从交易所或专业数据提供商处获取实际订单簿数据(每个价格级别的买/卖量)。本指标使用公开的行情数据,基于 模拟算法 提供类似足迹图的可视化效果。 工作原理 该指标逐笔分析价格变动,以估算买卖压力: 向上的价格跳动视为买方压力 向下的价格跳动视为卖方压力 在每根K线内部的多个价格层级计算并显示买卖差(买量 – 卖量,称为“Delta”) 主要功能 多层价格分析:每根K线可显示多达8个可自定义价位的Delta值 净Delta显示:展示每根K线的整体买卖压力 六种视觉主题:Professional、Dark、Light、Vibrant、Classic、Custom 智能过滤:仅显示重要的Delta值,避免视觉干扰 实时更新:当前K线每2秒刷新一次 高效轻量:针对 M1、M5、M15 时间周期优
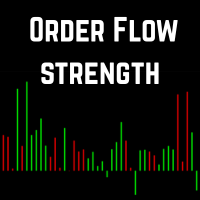
订单流强度(Order Flow Strength, OFS) 描述:
该指标通过分析每根K线收盘价在其区间的位置,并 结合成交量加权 ,来衡量 订单流的强度 。在独立窗口显示 买压(绿色) 和 卖压(红色) 。 公式 Order Flow Strength = Close − Low High − Low × Volume \text{Order Flow Strength} = \frac{\text{Close} - \text{Low}}{\text{High} - \text{Low}} \times \text{Volume} Order Flow Strength = High − Low Close − Low × Volume Close :K线收盘价 High :K线最高价 Low :K线最低价 Volume :该K线的成交量 公式将收盘价的相对位置(靠近高点或低点)与成交量结合,用于衡量市场运动的强度。 功能特点 原始模式(Raw Mode) 显示 成交量加权的绝对值 。 用于观察真实的买卖压力,无需归一化处理。 归一化模式(Normalized Mode)
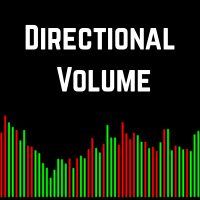
Directional Volume — 可视化多头与空头压力 Directional Volume(方向成交量) 是一个轻量但功能强大的成交量指标,它将多头与空头的交易压力分开,以直观的视觉形式呈现。
它不仅显示总成交量,还突出展示买方与卖方的主导力量,帮助交易者快速判断市场情绪与动能强度。 与传统成交量的区别 与仅显示每根K线总成交量的传统成交量柱不同, Directional Volume 根据K线方向划分成交量: 绿色柱状图 — 多头成交量(收盘价 > 开盘价的K线) 红色柱状图 — 空头成交量(收盘价 < 开盘价的K线) 这种划分方式让交易者可以轻松看出市场由买方还是卖方主导,以及动能何时开始转变。 使用方法 将指标附加到任意图表(适用于所有周期和交易品种) 观察绿色与红色柱状图,评估买卖力量的强弱 寻找成交量的急剧放大以识别强势压力或潜在突破区域 对比价格走势与方向成交量,发现潜在的背离信号 通过背离提前预测可能的趋势反转或动能衰竭 对无真实成交量数据的市场,可自动适配为tick成交量 交易应用 通过价格与成交量方向一致来确认趋势 在震荡市场中识别吸筹/派发阶段 发现成交量

Tick Speed & Volume Burst 描述
专业指标,通过两种互补的指标实时检测异常的流动性涌入: Tick Speed(蓝色) :衡量价格跳动速度的加速,用于识别订单簿中的异常活动。 Volume Burst(红色) :通过标准差分析识别统计上异常的成交量峰值。 该工具在可调节周期内对数据进行归一化处理,并在活动超出设定偏差阈值时触发警报(声音 / 弹窗 / 邮件 / 推送)。 使用方法 关键参数: SpikeThreshold (2.0 = 中等灵敏度,3.0 = 高选择性), AveragePeriod (默认 20 根K线)。 解读: 当两种直方图同时出现峰值时,通常表示机构入场/出场或宏观经济事件。 警报设置: 在 “ALERTES” 组中配置,以实时接收异常通知。 时间周期: 在 M1–M5 适用于剥头皮交易,在 M15–H1 适用于波段交易。 组合使用: 建议与趋势方向指标结合,以过滤虚假突破。 应用场景:
在突破前识别机构高活跃区域、检测市场操纵(扫止损行为)、确认关键支撑与阻力水平。

智能追踪市场的最佳方式 使用 Big Mindset Session Finder EA ,让您的交易更清晰、更精准、更自信!
这是一款能够在 MT5 图表上自动标出亚洲、伦敦和纽约交易时段 的全能型智能工具。 再也不用猜测市场高低点在哪里 —— 这个智能交易顾问会为您自动完成! 主要功能 自动识别交易时段
自动高亮显示 亚洲、伦敦和纽约 三大交易时段,使用不同颜色的垂直线直观展示市场结构,让图表更整洁、分析更清晰。 完全可调节的时间设置
轻松修改时段的开始与结束时间,以匹配 您的经纪商服务器时间 或您偏好的交易时段。
无论经纪商是 GMT+2 还是 GMT-5 —— 您都能完全掌控。 快速定位亚洲与伦敦时段高低点
EA 自动显示 亚洲高/低点与伦敦高/低点 ,帮助您精确识别 流动性区域、突破区间 与 关键反转点 。 可自定义颜色与样式
让图表符合您的风格!您可以自由选择线条颜色与样式,打造舒适直观的视觉体验。 支持模板保存
设置完成后,只需保存模板。下次加载 EA 时,系统会自动显示您的交易时段 —— 无需重新设置! 适配所有经纪商
更

反应指标 – MT5经济事件市场反应测量工具 反应指标 实时分析并量化市场对经济日历事件的反应。它会在每次重要经济公告后自动测量价格在10秒、30秒和60秒时的变动(以点数计算)。 主要功能 自动事件获取
与MT5原生日历API无缝集成,无需额外配置。 精确的新闻后波动性测量
计算新闻发布后价格波动速度(点数/分钟)。 对比分析
将每个事件的市场反应与历史上类似事件(按国家和类型分类)进行比较。 新闻前市场分析
在事件发布前15分钟分析市场状况,包括点差、波动性和预期影响。 可配置提醒系统
支持声音、弹窗、电子邮件和推送通知。 数据持久化
自动将所有测量数据保存为CSV格式,便于后续分析。 智能筛选
按重要性等级(1–3星)和受影响货币进行筛选。 实际用途 该指标可帮助交易者 量化市场对经济新闻的反应 , 识别历史上高影响力事件 ,并 评估公告前的市场条件 。
历史数据有助于预测 未来波动幅度的可能性 ,为交易决策提供客观依据。

Heikin Ashi RSI Indicator for MT5 (HARSI) Overview
The Heikin Ashi RSI (HARSI) indicator combines Heikin Ashi candle smoothing with RSI momentum analysis, providing a dual-layer view of price action and relative strength. It offers a clear visualization of market direction, RSI-based overbought and oversold conditions, and optional backtesting and alert systems for strategy validation and trade signal automation. How It Works
The indicator applies RSI values to Heikin Ashi calculations, creati

FiboCircles Zones — Fibonacci Circles, Fan, Zones & Time Analysis Suite An all-in-one Fibonacci indicator for MT5. It combines the most widely used Fibonacci tools into a single indicator — Circles, Fan, Zones, HLines, Time Period Wave, and Time Zones — with draggable, persistent anchor lines that remember their position permanently. No need to redraw anything every time you reopen the chart. Built for traders who rely on Fibonacci as a core tool for finding support/resistance, reversal points,

KINETIC BARYCENTER MT5
First-Principles quantitative mechanics: Center of mass, Multi-Horizon price gravity and Elastic exhaustion bands By ONDEB Labs
THE PARADIGM SHIFT: MEASURING MARKET MASS INSTEAD OF CHRONOLOGICAL TIME
Major technical indicators were conceived decades ago under the assumption that chronological time is uniform. Simple and Exponential Moving Averages (SMA, EMA) treat quiet, low-volume consolidation bars with the exact same mathematical weight as massive institutional liq

Indicator: Color MACD Description:
The Color MACD Indicator is an enhanced version of the classic MACD, designed to give traders a clearer and more intuitive visual signal of market momentum and trend changes.
Unlike the standard MACD, this version adds color-coded bars and signal lines to help you identify bullish and bearish momentum instantly — without having to interpret raw histogram data. Key Features: Color-coded histogram and signal line for quick visual analysis. Detects trend

TrapSniper Pro is a professional-grade indicator built to detect genuine price action setups while identifying potential market manipulation zones.
It combines advanced candlestick pattern recognition with smart filtering logic to highlight areas where institutional players may be trapping liquidity before major price reversals or continuations. This tool is designed for traders who rely on price action, smart money concepts, and clean chart analysis without unnecessary noise. It provides visual
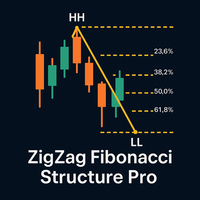
Trade smarter with ZigZag Fibonacci Structure Pro — a professional indicator that dynamically detects Higher Highs (HH), Higher Lows (HL), Lower Highs (LH), and Lower Lows (LL) in real time.
Each structural swing automatically maps a precise Fibonacci retracement , drawn only from true impulses — not minor corrections. With its elegant design, smooth visuals, and intuitive input settings, this indicator turns complex structure reading into a simple, visual process. Key features: Auto-detectio

AI SuperTrend Final – Adaptive Intelligence for Smarter Trading
The AI SuperTrend Final is not just another trend indicator—it is a next‑generation trading tool powered by adaptive intelligence. Designed for MetaTrader, this indicator combines the proven logic of SuperTrend with advanced filters such as Moving Average (MA), Average Directional Index (ADX), and a unique self‑learning mechanism. The result is a smart, evolving system that adapts to market conditions and continuously improves its
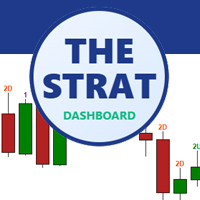
The Strat Dashboard – Rob Smith 策略专用多符号模式扫描仪
以实时多符号 Strat 分析,提升您的交易表现
The Strat Dashboard 是一款强大、专业级别的指标,专为使用 Rob Smith 著名 “Strat” 交易方法的交易者设计。它可同时监控无限符号、跨多个时间框架,瞬间识别高概率设置,再也不会错过任何可操作的模式。 MT4 Version :- https://www.mql5.com/en/market/product/153375/
什么是 “The Strat”?
The Strat 是由 Rob Smith 开发的一种革命性价格行为交易策略,专注于识别特定的蜡烛图模式及其跨时间框架的关系。该方法根据蜡烛与之前蜡烛的互动,将每根蜡烛分类为编号类别,创造出一种通用语言,用于解读价格行为,可应用于任何市场、任何时间框架、任何时刻。 The Strat 蜡烛分类系统: 1 Bar (Inside Bar):当前蜡烛的高点低于前一蜡烛的高点 且 低点高于前一蜡烛的低点 — 表示盘整 2 Bar (Directiona
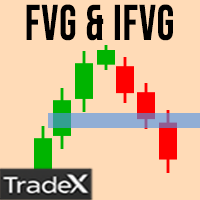
Click the link to view our products: LINK Click the link to view my best tool: LINK Description: Smart FVG & iFVG Zones Indicator MT5 accurately detects Fair Value Gaps and Inverse Fair Value Gaps based on ICT Smart Money Concepts . It automatically plots imbalance zones to reveal liquidity voids , mitigation areas , and institutional trading levels . Designed for professional traders, this tool helps you identify premium and discount zones with real-time updates. The indicator supports both bu

Symbol Changer Indicator
This is a simple yet intuitive indicator.
The indicator provide easy navigation across various symbols and across different time frames all in a chart.
The buttons are displayed on the main chart.
It is flexible and easy to use with fast response speed.
FEATURES
Use Custom Pairs : If set to true, load all the available symbols in the Market Watch. No means it loads the pairs selected below.
Pairs (Separated by Comma) : This enables selected pairs
BigMindset Liquidity & Volatility Indicator – $120 Price: $120 USD Overview:
The BigMindset Liquidity & Volatility Indicator is a powerful stand-alone tool for MetaTrader 5 that visually identifies low liquidity, high liquidity, and consolidation zones in the market. It provides traders with actionable insights to help avoid whipsaws, recognize strong momentum, and make smarter trading decisions—all without cluttering the chart. Why You Need This Indicator: Instant Market Clarity Quickly see th

Scanner Intelligence Hub - Multi-Active Monitoring 28+ Pairs Stop jumping from one chart to another. Scanner Intelligence Hub is the ultimate command center for the professional trader. Monitor dozens of assets and multiple timeframes from a single dashboard.
Technical Capabilities:
Real-time scanning: It detects candlestick patterns, mean crossovers, and RSI levels in 28 pairs simultaneously.
Customizable Panel: Choose which indicators and timeframes you want the Scanner to monitor f

VolumeTracker 4X – High-Volume Candle & VWAP Main Description: VolumeTracker 4X automatically identifies the highest-volume candle of the day in the Forex market and calculates the volume-weighted average price (VWAP) from that candle. It draws dynamic channels based on the high and low prices from the highest-volume candle to the current candle , helping you visualize key support and resistance areas . Created for traders who want more precise decisions using real trading volume as a reference.

SmartCandle 4X – Volume-Based Candles Main Description: SmartCandle 4X automatically colors each candle based on the detected volume . Low-volume candles start with soft blue tones , progressing to white, yellow, orange, red, and purple as volume increases. This allows traders to quickly identify whether the market is calm or active , supporting more strategic decisions in Forex trading. Key Benefits: Instant visualization of market activity levels . Candles colored intuitively, from low to high
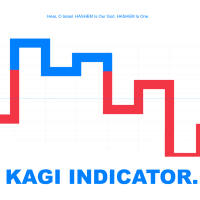
先进的卡吉图表指标,具备ATR适应性和智能警报 使用这款专业的卡吉指标改变您的价格分析,它能过滤市场噪音并突出真实的趋势变化。基于1870年代日本米市场的传统图表方法,该工具纯粹关注重要的价格波动,同时忽略基于时间的波动。 核心功能: 双重反转方法 固定Delta:为反转检测设置精确的价格阈值 基于ATR:使用平均真实波幅(14周期标准)自动适应市场波动性 根据您的交易风格和市场条件在方法之间切换 视觉清晰度 阳线(粗、蓝色):看涨动能 - 多头控制市场 阴线(细、红色):看跌动能 - 空头控制市场 可自定义颜色和线宽以获得最佳图表可见性 自动标记肩部(阻力)和腰部(支撑)水平 全面的警报系统(7种卡吉信号规则) 阳/阴转换:趋势方向改变时立即警报 肩部形成:顶部看跌反转点警报 腰部形成:底部看涨反转点警报 多重肩部:通过连续下降的顶部检测强劲的看跌趋势 多重腰部:通过连续上升的底部识别强劲的看涨趋势 多级突破:突然垂直价格飙升警报 趋势强度分析:跟踪线长度以测量动能强度 独立警报控制 启用或禁用特定警报类型 自定义连续计数以确认趋势(默认:3) 所有警报包括精确的价格水平和清晰的方向
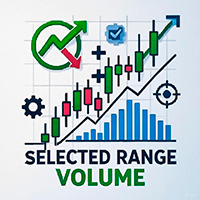
Selected Range Volume — Buyers and Sellers Balance + Volume Levels Selected Range Volume is an advanced indicator for analyzing volumes and the imbalance between buyers and sellers. It doesn't just show where the volume was—it highlights who exactly dominated: buyers or sellers, and where the market might stop in the future. You select any section of the chart, and the indicator instantly calculates the volume activity within the range, builds a volume profile by prices, and displays the balance

AMD 自适应移动平均线 (AAMA)
AAMA 是一款适用于 MetaTrader 4 的自适应移动平均指标,可根据市场状况自动调整其反应速度。 主要功能: 基于 Kaufman 效率比的自适应移动平均线——在趋势行情中快速反应,在震荡行情中过滤噪音 自动识别四个 AMD 市场阶段:积累期 (Accumulation)、上涨期 (Markup)、分配期 (Distribution)、下跌期 (Markdown) 通过 ATR 实现波动性自适应——根据当前市场状况调整灵敏度 实时信息面板显示检测到的市场阶段、置信度和适应速度 多指标集成:结合 ADX、RSI 和 MACD 精确识别市场阶段 快速/缓慢参考区域,用于可视化自适应行为 使用方法:
指标会根据市场自动调整适应速度——在强趋势时反应更快,在盘整阶段更慢。可视化面板帮助理解当前的市场阶段。所有参数(周期、颜色、灵敏度)都可根据您的交易风格自由设置。
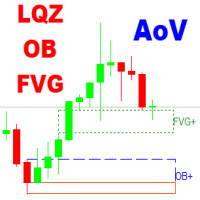
The Area of Value Detection indicator automatically identifies and highlights key institutional price zones, including Liquidity areas, Order Blocks, and Fair Value Gaps (FVG). It is designed to help traders visualize market imbalances and potential points of interest (POIs) used by smart money participants.
Main Features Liquidity Zones: Detects clusters of equal highs/lows and liquidity pools where stop orders are likely accumulated.
Order Blocks: Highlights potential bullish and bearish or

Time & Sales Tick Indicator 是一款专为 MetaTrader 5 平台设计的实时报价与成交监控指标。
该工具能够在图表上实时显示每笔交易的价格、成交量与时间信息,帮助交易者观察市场的细微波动与订单流动。
功能说明 在图表中的独立面板上实时展示价格、成交量与成交时间,便于跟踪市场动态。 可根据用户自定义的时间或数量间隔对成交数据进行分组。 系统自动对价格变动进行颜色区分:上涨以绿色显示,下跌以红色显示,使趋势变化一目了然。 面板可自由放置在图表的任意角落,支持调整大小、字体、透明度和刷新速度。 与所有交易品种和时间周期兼容,可在 MetaTrader 5 平台上稳定运行,不影响主图性能。 适用于分析市场活跃度、监控流动性以及辅助短线或高频交易策略。 此指标为交易者提供了更直观的市场视图,使其能够在高波动市场中更好地识别短期机会并改进决策效率。

True Range Normalized Momentum ( TRNM) The TRNM is a volatility and momentum oscillator designed to identify real shifts in price strength , filtering out random market noise.
It combines the True Range with statistical normalization techniques to provide a clear, responsive signal of the current momentum strength and direction . ️ Concept and Functionality TRNM measures the effective volatility of an asset using the True Range and transforms these values into a normalized momentum indicator ,

Z-Corr — это инструмент, разработанный для анализа корреляции между двумя валютными парами. Индикатор в реальном времени отображает отклонения в движении инструментов, помогая трейдеру определить моменты, когда валютные пары начинают расходиться, и своевременно открыть позицию для получения прибыли на их последующем схождении. Основные возможности: Отображает два инструмента и сравнивает их движение. Линии и гистограммы показывают текущую динамику отклонения пар. Жёлтая гистограмма сигнализирует

MARKET SENTIENCE PRO - INSTITUTIONAL GRADE MARKET INTELLIGENCE INDICATOR Copyright 2025, Amuyunzu OVERVIEW Market Sentience Pro is a comprehensive, institutional-grade trading indicator designed to decode market behavior by combining smart money concepts, market structure analysis, liquidity zone detection, and trend confirmation into a unified system. This all-in-one solution helps traders anticipate market movements before they occur by displaying a clear, layered view of institutional footpri

Simple Delta – 客户说明 Simple Delta 是一个简洁高效的 MetaTrader 5 成交量德尔塔指标,在每根蜡烛上方显示归一化的买卖压力。 您将获得 该指标分析实时 Tick 数据以计算德尔塔(买入量减去卖出量),并在每根蜡烛上方显示单一归一化数值(-10 到 +10)。 正值 表示买方占优(以您选择的买入颜色显示), 负值 表示卖方压力(以您选择的卖出颜色显示)。 主要特点 即时可视化:每根蜡烛一个数值 — 无杂乱,只有可操作的数据 6 种专业配色主题 + 完全可自定义颜色 当前蜡烛每 2 秒实时更新 可调文本位置以适应您的图表布局 优化适用于 M5 和 M15 时间框架 非常适合希望进行干净、无干扰的订单流分析而不想让图表被复杂指标淹没的交易者。

LiquidX Pro - Precision Reversal Engine "Professional multi-confluence reversal detector that identifies high-probability tops and bottoms using institutional liquidity sweeps, volume exhaustion, and momentum divergence" Overview LiquidX Pro - Precision Reversal Engine is a sophisticated, professional-grade indicator designed for serious traders who want to catch high-probability market reversals with institutional precision. Stop chasing breakouts that fail—start trading reversals that pay. Thi
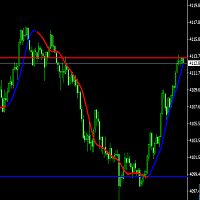
This is a professional trader's breakthrough system indicator that can be used for trading in various categories. Using the Hull moving average to create trend charts and provide price pressure and support positions, it provides traders with trading references for each cycle. Welcome to use it, if you have any questions, please contact us. The last 50 candlesticks for price pressure and support settings can be reset according to your needs
FVG Box– The Ultimate Fair Value Gap Indicator for MetaTrader 5
Developed by LiquidWave | Mohd Firuz Fahmi (Moff17) Precision Trading with Automated Fair Value Gaps
FVG Box is the next-generation Fair Value Gap (FVG) detection indicator designed for serious traders who rely on smart money concepts and institutional imbalance zones . With ultra-smooth performance and real-time updates, it automatically scans your chart to highlight potential liquidity gaps and trading opportunities wi

The Current Price Line indicator displays the current price as a real-time horizontal line on the chart. Features of the Current Price Line Unlike standard buy/sell lines, it is unaffected by spreads, enabling precise price identification. It instantly identifies reactive price zones (such as resistance/support lines), facilitating high-precision entries. It delivers high performance for scalping and day trading. Simultaneous display of lines across multiple timeframes supports multi-timeframe a

DS Candle Percent Panel —— 一眼掌握全局市场动态 DS Candle Percent Panel 是一款先进的指标,可在 实时 显示价格相对于 每根K线开盘价 的百分比变化, 支持从 M1 到 D1 的所有主要周期,并包括自定义周期 H2 与 H6 。 使用本工具,您 无需再切换多个图表 即可清楚了解市场在不同周期的方向变化。 所有信息都以 清晰、直观、即时 的方式呈现在图表上的 紧凑而优雅的面板 中。 主要功能 显示每个周期的 价格百分比变化 (M1、M5、M10、M15、M30、H1、H2、H4、H6、D1)。 每秒自动更新 ,实时反映市场波动。 半透明背景面板,带有 动态颜色 (绿色表示上涨,粉色表示下跌)。 智能标题,自动显示 当前交易品种和周期 。 简洁轻量的设计, 性能优化 ,几乎不占资源。 交易者优势 轻松识别 多周期间的趋势差异 (例如 H1 上涨而 M15 回调)。 在一个图表中获得 整体市场趋势概览 。 帮助快速做出 入场与出场决策 ,界面直观易读。 特别适合使用 SMC(Smart Money Concepts) 、 价

Here our more valuable tools
SMC Trend Trading , Easy SMC Trading , Institutional SMC Architect Volume Analysis Tools , Volume flow Profile , Market volume profile , FVG with Volume , Liquidity Heatmap Profile , Volume Spread Analysis Purpose : Measures market pressure by analyzing tick movements, volume, and speed within a time window. How it works : Calculates weighted price changes, considers tick velocity and volatility, and applies EMA smoothing. Trading use : Strong po

Instantly identify key price action signals with an intuitive visualization indicator:
Pin Bar: The Rejection Candle. Green for a bullish close, red for a bearish close. Defined by a long wick and a small body, signaling a strong price rejection.
Inside Bar: The Consolidation Candle. Highlighted in blue, this pattern occurs when a candle trades entirely within the range of the previous one. It represents a period of market indecision and compression.
Fakey Bar: The Failed Breakout

OrderFlow Pro - Institutional Order Flow Detector Professional Order Flow Analysis for MT5 OrderFlow Pro is an advanced technical indicator designed to detect and analyze institutional order flow in real-time. The indicator provides traders with comprehensive insights into market dynamics by identifying buying and selling pressure, volume imbalances, absorption zones, trapped traders, and delta divergences. KEY FEATURES Order Flow Detection: Real-time buy and sell pressure calculation with perce

MA MTF Fijo: Smooth Curves, Clean Charts
Eliminates the visual "steps" of multi-timeframe moving averages.
Fixed MA MTF: It offers a smooth and professional line of any higher timeframe directly on your current chart.
Key Points:
No Steps: Real and smooth curve between candles (Goodbye to rough straight lines). High Performance: Optimized code; does not slow down your MetaTrader 5. Maximum Versatility: Supports all 21 timeframes and all methods (SMA, EMA, SMMA, LWMA). Multi-Market: Ideal fo

Swing and Liquidity Sweep Finder is a powerful tool designed to automatically detect swing points and liquidity sweeps on your chart.
It helps traders identify where the market is likely to grab liquidity before reversing, showing both internal and external liquidity zones with high accuracy.
This indicator is ideal for ICT and Smart Money Concept traders who rely on swing structure and liquidity manipulation for their entries and exits.
Our Team Services: If you are want to see our products cl

Composite MA Indicator - Comprehensive Guide Description:
The Composite MA indicator is a sophisticated multi-timeframe trend analysis tool that calculates the average value of multiple moving averages across a user-defined period range. It provides comprehensive market trend visualization through both a color-coded composite moving average line on the chart and an Excel-style panel displaying trend direction across 21 different timeframes. The indicator uses canvas technology for smooth GUI r

Magic History is a detailed trade visualization indicator designed to bring the full story of your trading activity directly onto the chart. If you’re a developer or trader who uses magic numbers, this is made for you. Smart pagination - never lose track of your trades again. Pagination means dividing content into separate pages instead of showing everything all at once.
In the context of your Magic History indicator:
Pagination is a system that lets you view your trades in sections (pages) — f
Advanced ZigZag Histogram with Divergence Detection and Order Flow Simulation ZigDeltaSwingPro is a comprehensive technical analysis indicator for MetaTrader 5, built on the classic ZigZag algorithm and enhanced with modern features such as divergence detection, dynamic histogram visualization, swing pattern recognition, and simulated order flow insights. Designed for scalpers and swing traders alike, it leverages MT5’s internal tick volume to deliver actionable signals—no external data feeds r
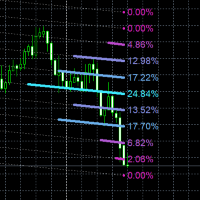
Linear Regression Volume Profile指标将线性回归分析与成交量分布剖析相结合,创建了一个先进的市场结构可视化工具。基础从对指定数量历史K线的线性回归计算开始,计算定义趋势线通过价格行为轨迹的斜率(倾斜度)和Y轴截距值。这条回归线作为分析成交量分布的中心轴,自动适应当前趋势方向,而不是保持水平静止状态。然后指标围绕此回归线计算基于ATR的通道,通道宽度由用户定义的比率乘以200周期平均真实波幅值确定,确保剖析级别按比例适应当前市场波动性。成交量分布分析通过将此通道划分为多个水平级别(默认回归线上方7个和下方7个)进行,其中每个级别代表沿回归角度倾斜的特定价格区域。对于计算周期内的每个历史K线,指标检查该K线的高低范围触及了哪些价格级别,并将相应的成交量累积到这些级别中。生成的成交量分布通过从每个级别延伸的彩色水平条可视化,颜色在最小成交量(紫色)和最大成交量(黄色)之间插值,基于每个级别占总累积成交量的百分比。方向箭头出现在计算周期中最旧的K线处,对于正回归斜率(指标反向逻辑中的下降趋势)向上指,对于负斜率(上升趋势)向下指,提供计算趋势方向的即时视觉确认。剖
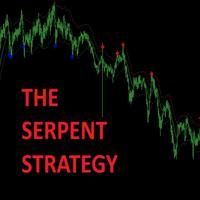
Trade Like a Serpent — Calm, Precise, Lethal. The Serpent Strategy equips you with a visual edge — clarity in confusion, precision in volatility, and confidence in timing.
Let your trades strike like a serpent — swift, silent, and accurate. Overview The Serpent Strategy is a powerful custom-built MetaTrader 5 indicator designed to identify high-probability trade zones using a unique combination of market volatility, trend direction, and momentum confirmation.
It visualizes price action in th
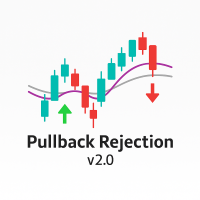
Overview Pullback Rejection v2.0 is a professional-grade visual indicator that spots continuation setups after pullbacks using Heiken Ashi logic and multi-EMA trend bias.
It is designed for scalpers and intraday traders who want clean, rule-based BUY and SELL signals aligned with trend direction only — no repainting, no noise, no counter-trend traps. Trading Concept The indicator combines EMA 7, EMA 50, and EMA 200 to define directional bias: Bias Condition Trades Allowed Bullish EMA7 > EMA200

İşte Çince çevirisi: 在反转发生之前捕捉它 这个指标不做什么 这不是买卖信号生成器。它不会自动告诉您何时进入或退出交易。 这个指标做什么 Early Reversal Detector 识别价格行为的变化,精确定位最佳入场点。 它如何工作 该指标在单独的面板中创建蜡烛图,看起来与主图表上的价格蜡烛图相似 - 但有一个关键区别: 常规图表蜡烛图 随着每一个tick形成。 Early Reversal Detector 蜡烛图 仅在价格跳跃达到您指定的阈值量时形成。 例如:如果您在EURUSD上将阈值设置为"5",则指标仅在价格在tick之间移动0.00005或更多时才记录tick。较小的移动将被完全过滤掉。 为什么这很重要? 通过过滤噪音并仅关注重大价格变动,您可以看到价格行为背后的 真实 压力。这揭示了大多数交易者错过的关键信息: 即使大量成交量进入与当前趋势相反的方向,价格通常仍会在原始方向上继续移动1-2根K线,然后才会反转。 Early Reversal Detector 在实际反转在主图表上发生之前大约1-2根K线就捕捉到这种变化。 这个指标背后的故事 我最

ICT Unicorn Hunter – Multi-Timeframe Smart Setup Detector IMPORTANT: This is a Multi-Timeframe Scanner, looking for 'Unicorn' setups. A Unicorn in this definition is a liquidity sweep, market structure shift and creation of a Fair Value Gap overlapping with the last opposite-close candle before the liquidity sweep (breaker). This scanner does NOT provide visualisation of the Unicorn on the chart.
For visualisation, use the Unicorn Tracker indicator, which is designed to work with the Unicorn

# 上涨下跌及盘整K线 - 专业形态识别
## 概述
上涨下跌及盘整K线是一个专业的K线形态识别系统,旨在帮助交易者发现高概率的供需区域。该指标自动识别并突出显示构成机构交易策略基础的三种关键K线类型:上涨K线(强劲的买盘压力)、下跌K线(强劲的卖盘压力)和盘整K线(盘整区域)。
## 主要功能
**自动形态识别**
- 识别上涨蜡烛图,表明强劲的上涨动能
- 检测下跌蜡烛图,表明强劲的下跌压力
- 高亮显示底部蜡烛图,标记盘整和潜在反转区域
- 实时标签系统,支持 RBD、DBR 和 RBR 形态
**完全自定义设置**
- 可调整每种蜡烛图类型的百分比阈值
- 自定义配色方案,提升视觉清晰度
- 可配置标签显示选项
- 微调参数,以匹配您的交易风格
**多时间周期兼容性**
- 适用于从 M1 到 MN1 的所有时间周期
- 无缝适配任何市场工具
- 非常适合超短线交易、日内交易和波段交易
**高级警报系统**
- 平台原生警报,带有弹出通知
- 声音警报,确保及时关注
- 电子邮件通知,让您随时随地掌握最新信息
- 推送通知至移动设备

MQL5 博客 = https://www.mql5.com/en/blogs/post/776162 MT4 版本 = https://www.mql5.com/en/market/product/188797 MT5 版本 = https://www.mql5.com/en/market/product/154022
CONTRARIAN ZONES [tambangEA] 是一款专业的市场区域指标,旨在通过结合波段结构(swing structure)、动能状况、波动率、成交量特征、价格拒绝(rejection)特征以及区域交互历史,来识别潜在的反转区域。
与传统的支撑和阻力指标不同,CONTRARIAN ZONES 不会同等对待每一个波段水平位。每个区域都通过多因素评分模型进行评估,并在价格与其发生交互时进行持续监控。
该指标侧重于两种主要的市场结构:
BUY-DIP 区域(逢低买入区)——围绕符合条件的波段低点形成的潜在看涨反转区域。
SELL-RIP 区域(逢高卖出区)——围绕符合条件的波段高点形成的潜在看跌反转区域。
其目标是帮助交易者识别价格可能出现过度延

机构流动性压缩指标 该指标通过布林带宽度、成交量和平均点差的标准化测量,实时检测流动性收紧情况,以识别价格突破前的压缩阶段。 显示方式:
专业独立窗口,包含“Compression Score”柱状图与“Threshold”阈值线。 主要特点 早期检测: 在价格波动前识别压缩区域。 多因素测量: 结合布林带宽度、成交量与平均点差的标准化数据。 实时更新: 每个行情跳动(tick)即时刷新。 清晰显示: “Compression”柱状图与虚线“Threshold”参考线。 兼容性: 适用于 MT4 与 MT5 平台。 使用方法 将指标添加至目标品种图表。 根据波动性与交易时段调整阈值与权重。 解读: 当分数较高时,表示出现流动性压缩,需关注潜在突破。 参数说明 BB_Period / BB_Dev: 计算布林带宽度。 Norm_Period: 近期波动性标准化周期。 Vol_Period: 成交量标准化周期(按 tick 计)。 Spr_Period: 平均点差标准化周期(MT5 使用历史数据,MT4 使用即时代理)。 Weight_Width / Weight_Volume / We
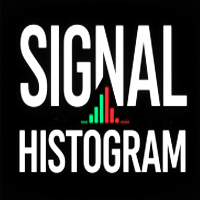
Signal Histogram 是一个可靠的技术指标,适用于 MetaTrader 5 平台,旨在通过比较收盘价与移动平均线来视觉确定当前趋势。指标在单独窗口显示直方图:绿色柱状图表示价格高于平均水平,而红色柱状图表示价格低于或等于平均水平。这种方法允许快速评估趋势方向并识别潜在的反转点。指标在价格与移动平均线交叉时提供交易信号,这对于剥头皮交易和日内交易特别有用。所有信号均无重绘,因为它们仅在柱状图关闭后形成,确保稳定性和在历史数据上客观评估有效性的可能性。为了提高准确性,Signal Histogram 使用时间过滤器:您可以配置交易时段窗口,以排除噪音时期并专注于市场最活跃的部分。这使指标特别适合偏好在特定时间交易的交易者。指标支持推送通知和警报,即使不在显示器旁也能不遗漏重要时刻。
Signal Histogram 的主要优势之一是您可以在一个图表上同时安装多个其副本,使用不同的设置,例如周期为 20、50 和 100(参见截图 2)。这将同时显示价格相对于短期、中期和长期趋势的行为。例如,如果价格高于所有三条线,这通常意味着市场正在稳步上涨。而如果线条开始“发散”或
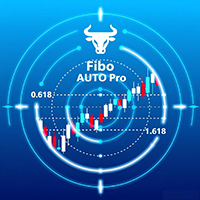
Fibo AUTO Pro:重新定义斐波那契分析——更智能、更直观、更高效 产品概述 Fibo AUTO Pro 是一款专为现代交易者设计的专业级技术分析指标。它基于经典的斐波那契回调理论,进行了全面的智能化增强,旨在解决传统绘图工具在效率、可视化和精准度上的痛点。Fibo AUTO Pro 不仅仅是一个画线工具,更是您洞察市场关键价位、制定精密交易策略的智能伙伴。 核心功能详解 极致灵活的个性化配置 自定义关键水位 :不再受限于默认的斐波那契比率。您可以根据自己的交易策略,轻松添加(如0.886, 0.906)、删除或修改任何回调线与扩展线,打造完全属于您个人的分析模板。 视觉风格自定义 :支持对每一条水平线的颜色、线型和粗细进行独立调整,让最重要的支撑阻力位(如核心的0.618)在图表上脱颖而出。 智能多色视觉系统 自动分区着色 :Fibo AUTO Pro 会自动为不同的斐波那契水平(如0.382, 0.5, 0.618, 0.786)分配鲜明且协调的颜色。这种视觉编码让您在任何时间周期下,都能瞬间识别不同级别的价位,极大提升了图表的多维度信息可读性。 直接价格显示 告别悬停与计
Mean Reversion Probability – 统计性均值回归指标 简短说明
机构级指标,根据历史超延伸分析,计算价格回归到200周期均线(MA200)的统计概率。以量化精度识别市场疲劳区域。 主要功能
高级统计分析 – 基于500+历史延伸数据计算真实概率
概率评分 (0–99%) – 精确量化回归均线的可能性
疲劳检测 – 测量超延伸的持续时间与强度
多资产标准化 – 自动适配外汇、指数、黄金、加密货币、差价合约
智能警报 – 罕见但高度可靠的信号(概率 >80%,持续时间 >15 根K线)
专业级界面 – 清晰、结构化的机构风格设计 方法学
指标实时分析: 价格与MA200的标准化距离(以ATR计) 自上次回归以来的延伸时长 达到最大延伸的时间 与历史平均值比较 概率计算: 距离评分(最高60%):当前值与历史比值 持续评分(最高40%):延伸时间与平均时间比 疲劳加成(+15%):当持续时间 >1.5×最大延伸时间 极端加成(+10%):当距离 >2.5 ATR 推荐用法
机构级策略: 等待概率 >70% 且 距离 >1.5 ATR 通过较长延伸时间确认(绿色

ARB 是一种指标,用于通过自适应 ATR 通道系统和精确的多因素评分模型(0–100)识别高概率的突破机会。
它结合了波动率、成交量、动能以及多周期趋势分析,提供经过筛选、直观且可实时操作的交易信号。 运行原理 该指标基于 Adaptive Range Breakout(自适应区间突破) 的概念,这是一种现代化的突破交易方法,可根据市场波动率(ATR)和价格的动态结构自动调整阈值。
每个信号都会通过加权评分来评估其质量和可靠性,然后再确认。 评分系统组成(0–100) 每个因素都会对总体评分作出贡献,以评估信号强度: 因素 权重 描述 通道中的位置 40% 测量价格在当前 ATR 区域中的位置 接近突破程度 25% 评估价格距离关键阈值的远近 成交量确认 15% 将当前成交量与移动平均值进行比较 高级别趋势(HTF) 15% 检查是否与更高级别周期的趋势一致 近期动能 5% 融入短期价格运动的动量变化
Enhance your trading strategy with this indicator from tr1cky.com This indicates buying and selling strength. Look for correlation on multiple timeframes for best indication and confidence in your trade. This indicator is simply RSI-MFI for buying and MFI-RSI for selling and is used in the successful expert advisors by tr1cky,com that just use this indicator for execution.

Hi Traders,
On purchase this tool we will give lifetime free updates for this tool
you can contact me how to use this tool better or your suggestion for improvement
This tool will work on any accounts
Where When Enter Exit – Trade Plotter helps traders easily see, track, and review their sell trades directly on the chart.
It clearly shows where you entered, when you exited, and why , so you can quickly learn from every trade. Key Features Auto Plot Entries & Exits –
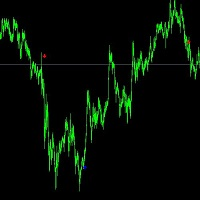
The 5-minute trend buying point reference for gold has an accuracy rate of 90%. All signals are not redrawn, Parameters need to be adjusted for different varieties and periods. The default value for gold trading is the 5-minute period. You can carefully study what direction guidance is suitable for you. We hope you can make money and it is worth referring to for professionals and novice traders. Stop loss is at the end of the line, real-time signal. Welcome to use it. If you have any question

Hidden Trend Channel Project 17 Tool
SPECIAL NOVEMBER SALE is now finished. Price goes back to normal.
This is an Automated Tool for Multi Timeframe Trend Channel Analysis Visualization with Intelligent Range Market, Trending Market, Reversal, Breakout Detection. It draws multiple Trend Channels with multiple sub-trendlines levels inside the channel for perfectly give you the trader, the crystal clear Trend channels where price trend direction is moving.
This tool is accurately useful for T
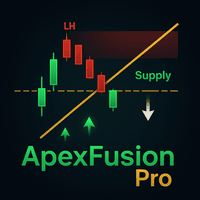
Reach the apex of precision trading with ApexFusion Pro — a next-generation indicator that fuses RSI divergence , diagonal support & resistance trendlines , Order Blocks , and Fair Value Gaps (FVG) into one visual system. Built for professional traders, it reveals the hidden balance between momentum and liquidity , showing where institutions accumulate, where reversals form, and where the true market flow begins. Key Features: Detects RSI divergences (bullish & bearish) with visual signals Dr
MetaTrader市场是独有的自动交易和技术指标商店。
阅读MQL5.community用户备忘更多地了解我们提供给交易者的独特的服务:复制交易信号,自由职业者开发的自定义应用程序,通过支付系统完成的自动付款和MQL5云网络。
