 MetaTrader 5
 专家
专家
 指标
指标
 程序库
程序库
 实用工具
实用工具
 窗口小部件
窗口小部件
 规则
规则
适用于MetaTrader 4的免费技术指标 - 28
 下面列出的技术指标信号对MetaTrader 4平台的开仓交易和平仓交易起着至关重要的作用。
指标的本质就是一种交易品种的数学转换,旨在预测价格变化。
下面列出的技术指标信号对MetaTrader 4平台的开仓交易和平仓交易起着至关重要的作用。
指标的本质就是一种交易品种的数学转换,旨在预测价格变化。 
Follow The Labels 指标 — 这是一个多功能 MT4 指标,旨在为交易者提供跨多个维度的市场状况综合可视化概览。它将趋势分析、前一日的价格水平、随机指标动量以及拒绝信号整合到一个易于阅读的界面中。 主要功能: 多时间框架 MA200 趋势滤波器 (H1→M15) 显示 MA200(LWMA)在三个时间框架上的对齐情况:H1、M30、M15。 显示整体趋势标签:看涨、看跌或混合。 当趋势对齐发生变化时,可选择弹窗、推送或邮件提醒。 前一日趋势 + 随机指标摘要 + 拒绝箭头 整体趋势:看跌。 标签 1:前一日价格上涨。 标签 2:前一日随机指标下跌。 分析前一日的价格走势和随机指标生成摘要。 标签显示前一日是看涨、看跌还是中性。 拒绝箭头(买入/卖出)每天仅绘制一次,基于蜡烛影线行为。 标签在图表上保持可见,方便快速参考。 Ultimate Levels:前一日高/低 + 中线 + 垂直线 绘制前一日的最高价、最低价和中线。 添加标记前一日开始和当日结束的垂直线。 价格突破或测试这些水平时提供警报(弹窗、推送、邮件)。 Ultimate Stochastics(独立子窗
FREE
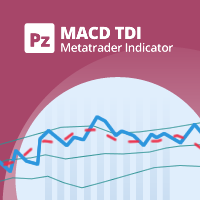
This indicator implements the logic behind Traders Dynamic Index to the classic MACD Indicator. It helps to find powerful trende changes and ignore meaningless ones. It is simply the classic MACD indicator plotted with volatility bands on top designed with the sole purpose of being able to ignore trend changes that do not follow an over-extension or over-contraction of the market. The indicator alerts on trend changes after the volatility bands have been breached and implements alerts of all ki
FREE
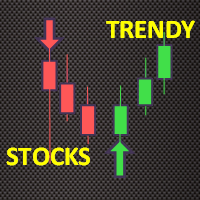
Trendy Stock is a price following indicator that uses Stochastic to show when the price is out of the oversold or overbought areas. The algorithm allows you to stay longer in a trend where the bulls or bears are in control. The indicator changes color immediately the price exits oversold/overbought state. In short, the downtrend [red] bars start to paint when the buying pressure decreases while the uptrend [green] bars form as the buy pressure kicks in. For MT5 version, follow :: https://w
FREE

[NEW RELEASE] Horse All in Signal – WinWiFi Robot Series ต้อนรับปีใหม่ 2026 ด้วยความมั่งคั่งและพลังที่คึกคักเหมือนม้าศึก! สัมผัสประสบการณ์การเทรดเหนือระดับกับอินดิเคเตอร์ตัวล่าสุดจาก WinWiFi Robot Series ในชื่อ "Horse All in Signal" เครื่องมือที่จะเปลี่ยนกราฟของคุณให้กลายเป็นสนามทำกำไร ด้วยระบบ AI อัจฉริยะที่สแกน Price Action ในทุกช่วงเวลา คุณสมบัติเด่น (Key Features): AI Price Action Engine: วิเคราะห์พฤติกรรมราคาแบบ Real-time แม่นยำทั้งในช่วงตลาดมีเทรนด์ (Trend) และช่วงพักตัว (Sideway)
FREE

This indicator filters the Zigzag indicator to calculate the main support and resistance
levels.
Variables
minimum gap between peaks : is the distance (GAP) between the peaks of
the Zigzag
peaks sensitivity : Minimum number of nearby peaks
look back: it means that it has to test the last 50 peaks in the Zigzag
object name perfix: a prefix for level’s line name on chart
FREE

Stochastic 3 Zonas Combina tres Stochastic configurables en una sola ventana para ofrecer una lectura rápida del momentum del mercado en diferentes velocidades ademas de poder configurar tus colores y periodos demanera mas rapida y configurables. El indicador muestra tres configuraciones principales: Stochastic rápido: 8,3,3 Stochastic medio: 21,10,10 Stochastic lento: 100,10,10 Cada Stochastic tiene sus propias zonas de color independientes, permitiendo detectar rápidamente cuándo el precio en
FREE

FORBEX Symbol Changer
One Click Away. If you experience any issues, have questions, or would like to learn more about the system and its methodology, please feel free to get in touch. Please contact me, and I will guide you through the entire installation process via AnyDesk to ensure everything is installed correctly and fully ready to use even before the purchase. FORBEX Philosophy Built by traders for traders, FORBEX tools focus on simplicity, efficiency, and practical workflow improvements
FREE

Rung 趋势指标。该指标识别并用不同颜色标记价格变动的主要趋势,同时消除噪音和与主要趋势相反的短期价格变动,而不对其作出反应。 指标是确定市场当前趋势的工具。在默认设置下,上升(“看涨”趋势),指标用绿线标记,下降趋势(“看跌”)趋势 - 当价格在通道中移动时,用红线标记为横向或持平的价格走势,指标没有反应。走廊或横向价格变动的值可以通过指标设置进行调整。
指标设置说明 限制点 - 走廊的大小,以点为单位。 coefficient_smoother - 平滑系数。 警报 - 显示包含用户数据的对话框。 Text_BUY - 购买信号的自定义文本。 Text_SELL - 卖出信号的自定义文本。 Send_Mail - 向在“邮件”选项卡上的设置窗口中指定的地址发送电子邮件。 主题 - 电子邮件的主题。 Send_Notification - 向移动终端发送通知,其 MetaQuotes ID 在“通知”选项卡的设置窗口中指定。 该指标表示最后一根柱线的趋势变化,该柱线正在形成并且可以改变其方向,因此等待固定柱线的信号很重要。
FREE

Trade Details Tracker is a lightweight yet powerful chart-panel designed to give traders instant visibility into their open positions. Instead of checking multiple terminal tabs, this indicator displays real-time trade statistics directly on the chart , helping you manage risk, monitor exposure, and make faster decisions. Key Features Real-Time Trade Overview
Instantly view Buy & Sell trade counts for the active symbol. Automatic Breakeven Calculation
Volume-weighted breakeven price for
FREE
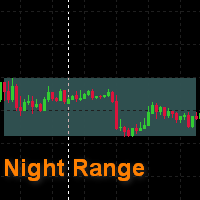
This is a simple indicator that draws a night range. The start and the end of a working day are specified in hours, color rectangles are adjusted as well. It helps to view the history in search for regularities , excluding unpredictable night time. It can be used to search for a breakthrough of the night range. It is drawn as a background , and does not cover a chart and other indicators .
FREE

MQLTA Candle Timer is an indicator that can show you the details about a symbol/pair and alert you before the close of a candle. Used in swing trading and not only, it can help your strategies knowing and be ready before the close of a candle.
How does it work Simply add the indicator to the chart and set the notifications options. You can load a minimalistic interface or a full interface. The alert will be sent once per candle.
Parameters All the parameters, that you can see in the picture, a
FREE

This is a regression tree indicator for MT4/MT5.
This indicator classificate nodes on the time period so that the deviation becomes smaller,
and displays regression line and channel for each node.
It's free!
Attached CartDemo.ex4 and CartDemo.ex5 is a Demo version and has the following limitations:
Can't use HighSpeed method (default method is RandomForest)
Maximum number of bars is 260 (increase from 200)
There is no expiration date and can be started many times, but it stops after an hour.
FREE
Altopium Trend is an indicator that identifies short-term trends. The signals it generates can be used to open long or short positions or can be integrated with other indicators/strategies. This is a trend indicator, be careful during narrow sideways phases. I recommend using it as a short-term trend indicator, complemented by other indicators that show the best times to enter the market.
Wait for the bar to close to confirm the signal.
FREE

VolumEdge Pro Scanner: индикатор статистического анализа объёмов и волатильности
VolumEdge Pro Scanner — профессиональный инструмент количественного анализа для трейдеров, использующих статистические аномалии для поиска высоковероятных торговых сетапов. В отличие от стандартных индикаторов объёма, отображающих сырые значения или простые скользящие средние, данная утилита рассчитывает точные процентные распределения и отслеживает последовательности однонаправленных свечей для фильтрации рыночно
FREE

This indicator is one of the useful tools for traders who trade on currency pairs and based on the strength of each currency they can make a correct decision or confirmation in the positions. It has been calculated for all the minor currency pairs supported by the broker and displays the values of the major currencies. These currencies are displayed horizontally or vertically according to the trader's config when executing the indicator. One of the trading strategies that can be used is to cho
FREE
Version History : Date Version Changes 6/20/2022 1.00 Initial release 6/21/2022 1.10 Add global variables for Minimum (SYMBOL_volume_min) and Maximum (SYMBOL_volume_max) History Volumes Description : RedeeCash Volumes Indicator is the Volumes indicator that you have come to trust for market entry and exit with the added benefit of exposing key metrics as global variables. Including global variables in an indicator permits easier interaction with expert advisors (EA) and scripts. When attaching
FREE
Check out other great products from https://www.mql5.com/en/users/augustinekamatu/seller
This indicator is the best so far at estimating reversal points especially on high time frames. It does not repaint and is based on a combination of moving averages computed using custom functions. No inputs required, it is simple plug and play. The principles used ensure that it can be used on CFDs, Commodities and Stock with incredibly great results. With proper money management and portfolio balancing
FREE

Session Killzone Indicator
Indicator that helps you to identify the killzone times of both London and NewYork sessions which usually is the most times for high volatility and taking liquidity from the market. Killzone times are configurable through indicator parameters. The indicator adjusts the range of the killzones based on the daily trading range.
FREE
The purpose of this new version of the MT4 standard indicator provided in your platform is to display in a sub-window multiple timeframes of the same indicator. See the example shown in the picture below. But the display isn’t like a simple MTF indicator. This is the real display of the indicator on its timeframe. Here's the options available in the FFx indicator: Select the timeframes to be displayed (M1 to Monthly) Define the width (number of bars) for each timeframe box Alert pop up/sound/ema
FREE

A powerful trend analysis tool for traders of all levels Super Trend Analyzer is a technical analysis tool that uses the Relative Strength Index (RSI) and Moving Average (MA) indicators to identify trends in the market. It is a versatile tool that can be used by traders of all levels of experience.
How does it work An uptrend begins when the main trend line and the auxiliary trend line cross from below and the lower minor oscillator is on the rise. A downtrend begins when the main trend line an
FREE

The implementation of the impulse system described by Dr. Alexander Elder. The indicator generates signals according to the following pattern: Moving average and MACD histogram increase - green bar, it is forbidden to sell; Moving average and MACD histogram have different directions - gray (or empty) bar, the ban is removed; Moving average and MACD histogram decrease - red bar, it is forbidden to buy.
Indicator Parameters EMA - period of the indicator's moving average MACD Fast - period of the
FREE

"Giant" is a flexible system in relation to trading strategies. It consists of two high-quality indicators that are installed on five different timeframes of the same currency pair (see screenshot). It monitors the trend and gives signals to open. The system passed a large number of checks and showed high accuracy. Indicators are sold separately. The second word in the main name is the indicator itself. This issue sells the indicator "Attention" .
FREE

The Stochastic RSI (StochRSI) is a technical indicator that combines the characteristics of the Relative Strength Index (RSI) with the Stochastic Oscillator, resulting in a more sensitive tool that generates a higher number of trading signals. Developed by Tushar Chande and Stanley Kroll, the indicator was designed to overcome a perceived limitation of the traditional RSI: the low frequency of overbought and oversold levels activation (commonly 80 and 20), especially in less volatile assets. How
FREE

----- Chinese / 中文说明 ----- KT 快速风控计算器 (KT Quick Risk Calculator) 是一款专为 MetaTrader 4 打造的专业级辅助工具。 它完美解决了 MT4 原生十字光标无法直接计算金额的痛点,旨在通过流畅的交互体验,大幅提升您的复盘与交易计划效率。 【核心功能】 本工具允许您以“所见即所得”的方式,在图表上交互式测量任意两点间的距离,并基于您设定的手数,即时显示该段距离在当前账户币种下的潜在盈亏价值(或风险金额)。 【主要特点】 智能交互 (Smart Interaction) :告别繁琐的菜单,只需按住键盘 [Ctrl] 键 + 鼠标左键拖拽,即可激活测量。 即时数据 (Instant Data) :在拖拽过程中,实时显示点数 (Points) 以及对应的账户货币价值 (Value)。 全品种支持 (Universal Support) :内置智能算法,完美支持黄金 (XAUUSD)、原油、股指及所有外汇货币对,无需手动配置合约参数。 图表整洁 (Clean Interface) :测量结束后松开鼠标,测量线与数据标签自动消失
FREE

"Giant" is a flexible system in relation to trading strategies. It consists of two high-quality indicators that are installed on five different timeframes of the same currency pair (see screenshot). It monitors the trend and gives signals to open. The system passed a large number of checks and showed high accuracy. Indicators are sold separately. The second word in the main name is the indicator itself. This issue sells the indicator "Nicely" .
FREE

Investment Castle Supply & Demand — Zones That Don't Repaint
Price flows between supply and demand. This non-repainting indicator maps those zones for you by counting how many times each level has been tested and retested in the past, so you trade from the areas the market actually respects.
What it does for you Non-repainting zones: levels are based on real, historical tests and retests — they don't redraw on you. Trade from strength: see the supply and demand areas where price is most likely
FREE
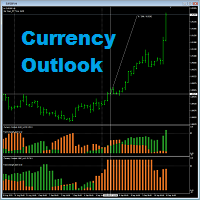
Currency Outlook is an indicator that can help us "Trade the right pair in the right direction and at the right time". This indicator analyzes prices of all cross currency pairs of the selected currency and report the result to us in form of double colours histogram diagram. The maximum height of the histogram diagram of the indicator is 100. The indicator is exclusively programming for AUD, CAD, CHF, EUR, GBP, JPY, NZD and USD. A feature for calculating trade lot size has been added to th
FREE

This is an implementation of the market cycle indicator described by Raghee Horner in the book "Forex Trading for Maximum Profit" . The current state of the market can be determined by analyzing the inclination angle of the exponential moving average (EMA) running on a period of 34 bars. If the EMA inclination is defined as the direction of the hour hand on the dial from 12 to 2 hours, then an uptrend is considered to be present; from 2 to 4 hours, the market consolidates; from 4 to 6 hours, a d
FREE

What is the Market Sessions Indicator? The Market Sessions Indicator is a technical analysis tool designed for the MetaTrader 4 platform. It visually represents the trading hours of major financial markets (Asia, Europe, USA, and other key sessions) on the chart. By marking each market session with colored rectangles, it helps traders understand which markets are active and their impact on price movements. What Does It Do? Visualizes Market Sessions : Displays key trading sessions such as Asia,
FREE
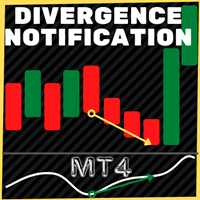
This indicator plots in the candles the divergence found in the selected indicator and can also send a notification by email and / or to the cell phone.
Works on all TIMEFRAMES. Meet Our Products
He identifies the divergences in the indicators:
Relative Strength Index (RSI); Moving Average Convergence and Divergence (MACD); Volume Balance (OBV) and;. iStochastic Stochastic Oscillator (STOCHASTIC).
It is possible to choose the amplitude for checking the divergence and the indicator has to b
FREE
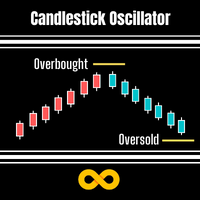
Candlestick Oscillator is a truly unique Oscillator that uses the concepts of within candlestick trading called the Record Session High. This is a method of analysing candlesticks to gauge when a trend might be wearing out and therefore ready for reversal or pause. We call it a record session high when we get 8 or more previous candles that have higher closes. We call it a record session low when we get 8 or more previous candles that have lower closes.
We don't rely on the typical Oscillation
FREE

MMD 的收支平衡線
盈虧平衡線對於使用允許同時雙向交易的策略(例如 MMD 方法)的人來說是一個有用的指標。 該指標在玩統計模型和在累積和分配區域平均位置時很有用。 該指標通過對三組頭寸求和來繪製水平:包含在買入中的頭寸、包含在賣出中的頭寸和包含的所有頭寸。
功能說明:
Show BUY BELine - 顯示或隱藏買入頭寸的收支平衡水平 BUY BELine Style - 定義 BE 級別的線條樣式,用於 BUY 位置 BUY BELine Color - 指定 BE 水平線的顏色,用於 BUY 位置 Buy BELine Width - 定義 BE 水平線的粗細,用於 BUY 位置
Show SELL BELine - 顯示或隱藏賣出頭寸的收支平衡水平 SELL BELine Style - 定義 BE 級別的線條樣式,用於 SELL 項目 SELL BELine Color - 為 SELL 位置指定 BE 水平線的顏色 SELL BELine Width - 為 SELL 項目指定 BE 水平線的粗細
Show BUY+SELL BELine - 顯示或隱藏所有
FREE

该指标在图表上显示重要的技术水平。 这些水平充当价格走势的支撑或阻力。
最重要的等级是 100 和 50 分的倍数。 您还可以以 25 点的倍数显示级别。
当价格达到该水平时,将显示警报或推送通知。
MT5 版本 https://www.mql5.com/zh/market/product/69740 设置 Show Levels 100 pips - 以 100 点的倍数显示水平 Show Levels 50 pips - 以 50 点的倍数显示水平 Show Levels 25 pips - 以 25 点的倍数显示水平 Color Levels 100 pips - 可被 100 点整除的级别的线条颜色 Color Levels 50 pips - 可被 50 点整除的级别的线条颜色 Color Levels 25 pips - 可被 25 点整除的级别的线条颜色 Send Alert - 发送通知 Send Push - 发送推送通知
FREE
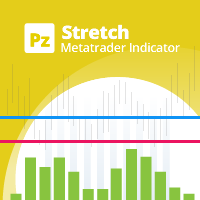
The Stretch is a Toby Crabel price pattern which represents the minimum average price movement/deviation from the open price during a period of time, and is used to calculate two breakout levels for every single trading day. It is calculated by taking the 10 period SMA of the absolute difference between the open and either the high or low, whichever difference is smaller. This value is used to calculate breakout thresholds for the current trading session, which are displayed in the indicator as
FREE

交易实用必备工具指标 波浪自动计算指标,通道趋势交易 完美的趋势-波浪自动计算通道计算 , MT4版本 完美的趋势-波浪自动计算通道计算 , MT5版本 本地跟单复制交易 Easy And Fast Copy , MT4版本 Easy And Fast Copy , MT5版本 本地跟单复制交易 模拟试用 Easy And Fast Copy , MT4 模拟账号运行 Easy And Fast Copy , MT5 模拟账号运行 顺势指标又叫CCI指标,CCI指标是 美国 股市 技术分析 家唐纳德·蓝伯特(Donald Lambert)于20世纪80年代提出的,专门测量股价、外汇或者贵 金属 交易是否已超出常态分布范围。属于超买超卖类指标中较特殊的一种。波动于正无穷大和负无穷大之间。但是,又不需要以0为中轴线,这一点也和波动于正无穷大和负无穷大的指标不同。 相对强弱指标RSI是根据一定时期内上涨点数和下跌点数之和的比率制作出的一种技术曲线。能够反映出市场在一定时期内的景气程度。由威尔斯.威尔德(Welles Wilder)最早应用于期货买卖,后来人们发现在众多的图表技术分析中,
FREE

MidPrice_A — The Hidden Power of the Market in a Single Number Looking for a way to see the true market direction without noise, lag, or overloaded charts?
MidPrice_A is a minimalistic yet powerful tool that reveals the pure price impulse , based on a professional market movement logic. What does MidPrice_A do? Unlike traditional indicators that rely on closing prices and often lag behind, MidPrice_A analyzes the candle mid-price and measures how far the market has actually shifted over the last
FREE
Binary Options Assistant (BOA) BURN Signals Indicator provides signals based on Ana Trader Binary Options Strategy. Indicators: MACD & Stochastic
Stop missing trades, stop jumping from chart to chart looking for trade set-ups and get all the signals on 1 chart! U se any of the BOA Signals Indicator with the Binary Options Assistant (BOA) Multi Currency Dashboard .
All BOA Signal Indicator settings are adjustable to give you more strategy combinations. The signals can be seen visually and
FREE
This multimeter is a smaller version of the full scanner here: https://www.mql5.com/en/market/product/123072
This multimeter is for people interested in TDI Line Crossings. And who only use a single currency symbol/pair with multiple timeframes. If you want multiple currencies, then please look into the scanner.
It is for showing Cross of various TDI elements: PriceLine, Trade Signal Line and Market Base Line And for getting alerts, so you can be prepared for finding good trade setups before t
FREE

Using multiple timeframes for analysis with Mtf MACD Standard can provide several significant benefits for traders: Comprehensive Market View: By applying Mtf MACD Standard across different timeframes, traders gain a broader perspective on market dynamics. This allows them to identify trends, patterns, and potential reversal points that might be more apparent or consistent across various scales. Enhanced Pattern Recognition: Multiple timeframes help in identifying repeating patterns or structure
FREE

ATR on Prices is simply an ATR indicator that plot a line for Resistance and Support using the Average True Range calculation. You can set the ATR daily periods, to be calculated. As well you can set the reference price to add and subtract the ATR measure to obtain the ATR Top and ATR Bottom lines, using the Open Price (that is fixed) or the Middle (HL/2) price (that will vary on the day) Or adding the ATR to the daily low and subtracting it from the daily high . You can use full ATR measure or
FREE

Tester Periods is the useful indicator for visual strategy tester which extend chart periods. Its designed for the trading utility Trade Shell (included Trade Shell SMC ).
Run the Trade Shell on the visual tester. Then put the Tester Periods indicator on the chart. If you wanna see timeframes M1, M5, M10, M15 , for example, then you have to run visual tester on M1 and to define multipliers like that: TimeFrame_Periods_Multiplier = 1,5,10,15 If you wanna see timeframes M5, M20, M30, H1, for
FREE
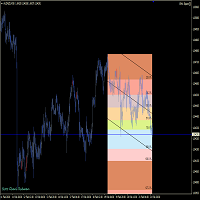
This tools is design to easily forecast the projection of the current trend through the inputs of Zigzag and get out of the market when the trend do not the ability to maintain it's volatility to go further... the indicator gets the initial and final price from the value of zigzag automatically by adjusting the intdepth of zigzag. You can also switch from Projection to Extension from the inputs tab of indicator.
FREE

5/35 Oscillator to be used with our Elliott Wave Indicator as part of the overall strategy on trading the 5th wave. The Elliott Wave Indicator Suite is designed around a simple but effective Swing Trading Strategy. The Indicator Suite is great for Stocks, Futures and Forex trading on multiple timeframes You can find the main Elliott Wave Indicator here https://www.mql5.com/en/market/product/44034
FREE

I was looking for a lean symbol changer. I could not find any. Normally other products hide lot's of screen space. So I developed a very lean symbol changer Just click on the 2 currencies you want to combine. The order does not matter. If you miss some pairs, you can add up to 5 custom symbols. Please make sure, your broker support your custom symbols. Drag an drop the panel with the green button.
In future I plan to include suffix and prefix als well.
FREE

Stoch Cross 448 Scanner Scan 64 pairs x 7 timeframes for stochastic golden/dead crosses — all from a single chart. | User Manual
------------------------------------------------------------------------ 1. Overview ------------------------------------------------------------------------ Stoch Cross 448 Scanner is a MetaTrader 4 indicator that monitors stochastic cross signals across 64 currency pairs and 7 timeframes simultaneously, displaying all results in a single panel.
Drop it onto any
FREE

Indicator automatically draw bullish and bearish engulfing without any rules. Bearish and Bullish engulf is well known area for supply and demand area marking. This indicator can be used in any strategy that required supply demand zone. Show Last Engulf : Enable this option to show unfresh engulfing Candle to calculate : set 0 will load all history bar and can use up more memory Bearish Engulfing Colour : Pick any colour that suit Bearish Engulfing Colour : Pick any colour that suit
-Use this
FREE

Trend indicator derived from T3 moving averages. The cloud is bounded by a fast T3 and slow T3 lines. Buying/Selling opportunities above/below cloud. The fast and slow T3 MA lines can also be used as dynamic support/resistance for more aggressive entries. Use default values for best settings. The number of look back bars is user defined. This indicator can be used in combination with other strategies such as price action. Suitable for all time frames. Prerequisites: T3IndiSlow and T3IndiFast in
FREE
如果你象这个项目一样,就有5个饥饿审查。 大量贸易要求我们寻找多种工具/工艺品,以寻找多种工具。
找到新的机会,这一指标将帮助你具体勾画具体的具体机会。
数众多或多其配件的职等自动更新。
随着价格的变化,这项任务本来会引起恶意。 例如,在日本财团,你可以有4个关于该指标的事例。
图谋: 每0.01 每隔100英尺长。 每种价格以每隔0.0075年关闭25个酒吧。 每种价格以50英尺的长度为准。 每种价格在0.0025年关闭,时间为25个酒吧。 这种做法将类似于一个规则者,你可以看到这一非常例子。
屏幕。 此外,你可以确定不同的肤色和线风格。
这使视觉程度更加容易。
FREE
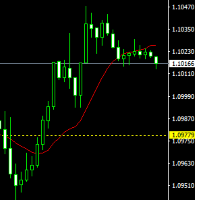
The indicator draws lines (with line objects) to the close prices of the previous day close, on selected timeframes. The indicator uses the closing price of the past day to draw a horizontal line, it can help you determine the direction of the market at the moment, which is necessary for making trades.. Parameters
Line Color Line style Line width Set on the top
FREE

该指标创建一个相对于其他图表指标的通道: 指标 + ATR 和指标 - ATR 。了解价格是否超出您的基准线非常有用。 ATR 水平可以用乘数进行调整。 此版本比其 MT5 版本更复杂,以避免某些 MT4 限制:您需要引入基线的 名称 、 参数 (以逗号分隔的字符串)和 缓冲区 。确保您的基线在 一个 缓冲区中包含所有必要的值(或者您可能需要放置多个实例)。
不支持 基线上的字符串参数,无论引入什么值,都将始终使用默认值。 对于枚举数,使用他们的位置(从 0 开始,对于大多数人来说)。例如对于 MA 模式:sma=0; EMA=1; smma=2; lwma=3
作为一个优势,此指标还显示原始基线,因此您将在同一指标中拥有所有 3 行。您可以使用特殊名称标签访问 MT4 本地指标:在这种情况下,有用的是“<MA>”和“<ICHIMOKU>”(用于 kijun-sen)。还有更多可用,但它们在图表中没有多大意义(也许你也可以从布林带中得到一些东西:<BB>)。
还有一个MT5版本
FREE

Unlike classic indicators that analyze a specific currency pair, this tool analyzes and compares the individual strength of each base currency against all other major currencies in the market. How the algorithm works:
The indicator calculates the strength of 8 major currencies (USD, EUR, GBP, AUD, NZD, CAD, CHF, JPY) by analyzing 28 currency pairs. Instead of using a standard price delta, it calculates the quote increment for each bar and multiplies it by the tick volume. The strength is then s
FREE

ForexFanclub(FFC) : For detailed instructions and our official website, please visit my profile ! InteractiveMA: Real-Time Moving Average Control Stop wasting time opening settings dialogs just to tweak your Moving Average. InteractiveMA puts complete control of your trend analysis directly at your fingertips, allowing you to cycle through MA types and periods instantly on the chart. Whether you are a scalper needing rapid adjustments or a long-term trader refining your entry, this tool ma
FREE

每位交易者都熟悉这套流程:打开指标设置,改一个数字,点确定,眯着眼盯图,觉得不对,再打开设置。如果你用 MetaTrader 4 交易,这套流程你已经重复了很多年——而 Stochastic 比任何其他振荡指标都更折磨人:三个周期加两条水平线,等于要调对五个数字,而每换一种组合就要再跑一趟设置窗口。Stochastic Live Tuner 终结了这一切。 这是经典的双线慢速 Stochastic(%K 与 %D),而且可以 直接在图表上实时调参 。图表上会出现一个小面板,带五个滑块:%K 周期、%D 周期、Slowing,以及两条水平线。拖动其中任何一个,指标都会在你注视之下立刻重算并重绘。5,3,3 还是 14,3,3?80/20 还是 75/25?这些问题几秒钟就能在你自己的图表上得到答案,而不用去翻论坛帖子。 一个按钮切换 %D 方法。 直接在面板上循环切换 %D 的平滑方式——SMA、EMA、SMMA、LWMA。改动在按下的瞬间就体现在图表上。 真正的 Stochastic,不是套壳。 指标使用自有的经典慢速 Stochastic 实现:在 slowing 窗口上计算 %K
FREE

Shadow Height mt4 阴影指示器。
将烛台阴影的大小(以点为单位)显示为直方图。在三种模式下工作,用户可选择。 指标设置说明 Mode - 指标操作模式,三种模式:第一种高度 - 上下烛台阴影的显示模式;第二个区别 - 烛台阴影差异的显示方式,上下烛台阴影之间的差异;第三个优势是一个交易日的烛影累积差异,该模式不超过4小时。 Shadow Height mt4 阴影指示器。
将烛台阴影的大小(以点为单位)显示为直方图。在三种模式下工作,用户可选择。 指标设置说明 Mode - 指标操作模式,三种模式:第一种高度 - 上下烛台阴影的显示模式;第二个区别 - 烛台阴影差异的显示方式,上下烛台阴影之间的差异;第三个优势是一个交易日的烛影累积差异,该模式不超过4小时。
FREE

Most performance stats live scattered across the terminal's History tab — win rate isn't shown anywhere, profit factor needs a calculator, and there's no clean way to hand a summary to a prop firm, a signal subscriber, or your own records. Trade Report Generator reads your account's closed-trade history directly from the terminal and turns it into two things: a live on-chart summary panel, and a one-click, fully self-contained HTML report you can open in any browser or print straight to PDF. On-
FREE

This indicator calculates gann support and resistance prices with use gann pyramid formulation and draw them on the chart. And If you want, Indicator can alert you when the current price arrive these pivot levels. Alert Options: Send Mobil Message, Send E-mail, Show Message and Sound Alert Levels: S1, S2, S3, S4, S5, R1, R2, R3, R4, R5 Inputs: GannInputPrice: Input price for gann pyramid formulation. GannInputDigit: How many digit do you want to use for calculation formula. (The number and the
FREE

智能趋势线提示, 专业趋势线, 支撑线和阻力线提示
特点: 自动与点击模式,可将任意新绘制的线转换为提示线 (趋势线或水平线); 在较高时间帧内隐藏来自低时间帧的线,避免在图表上显示过多不同时间帧的线,从而造成混乱; 自动切换时间帧,当在较低时间帧里点击较高时间帧的线时; 自动展平水平线,如果用户使用趋势线来绘制支撑或阻力线; 自动支撑至阻力反转,反之亦然; 自动线颜色, 描述, 线形和宽度设置; 当价格触及某条线,则该线闪烁 (直到用户在图表上点击关闭); 当触及某线,该图表自动置上; 连声提示,夜间和日间模式声音类型 (直到用户在图表上点击关闭); 单声提示并弹出消息框; 移动通知; 邮件通知; 图表上的控制台; 自动隐藏控制板; 图表剪裁.
如何使用: 加载指标至图表; 控制台将出现在图表上; 使用 MetaTrader 趋势线或水平线工具,在您希望的价位绘制一条线; 如果自动模式启用, 新的线将被自动转换为提示线, 如果点击模式启用, 新线在点击后转换为提示线。
当价格触及支撑或阻力线,将会发生什么: 指标将图表带到其它图表的上面; 指标将切换到该线所属的时间帧; 该线开
FREE
Powered by SVX Strategies Quant Team This indicator is a Smart Trend Regime Filter that changes its state based on internal market strength. Automated Trading Options:
Stop guessing the trend. Use our official algorithms for automated execution: Copy "Friday Pulse" (Conservative) Copy "SVX AI Systems" (High Growth) HOW IT WORKS
It fuses the smoothness of an EMA with the sensitivity of the RSI to filter out noise. Color Logic: Green Line: Bullish (RSI > 55). Buyers are in control. Red Line: Bea
FREE

Cat趋势VZ是一个不断改进的指标,具有准确和有利可图的入场信号。
Cat Trend vz指标线根据趋势方向改变颜色,指标在价格反转点绘制箭头。
此外,Cat趋势VZ指标实现了关于箭头外观的声音和文本警报。
重要提示:指标不重绘。
猫趋势VZ的主要特点: 分析函数
它可以在任何货币对和时间框架上使用; 指标不重绘; 这是其他指标的一个很好的补充; 不需要过滤器进入; 图形功能
占据图表上最小数量的位置; 柔性酊剂; 简单易学;
猫趋势VZ的主要特点: 设置
长度-平滑深度; 相位是在-100内变化的参数。.. +100,影响过渡过程的质量; 移位-指示器沿时间轴的移位; 输入价格海关-计算指标的价格选择(0-"关闭",1-"开放",2-"(高+低)/2",3-"高",4-"低"); JMA移动线No.1-设置JMA的第一个移动平均线; JMA移动线2号-设置第二个JMA移动平均线; CCF移动平均线-设置CCF移动平均线; Cjcf移动平均线-设置CJCF移动平均线; 平均周期MA-平均MA的周期; 计数条-要读取的条数; 线路显示
行-显示行真/假;
FREE

Multi Timeframe Indicator includes a lot of functions and can be considered as a universal helper for a trader. It's main objective is to display up to 10 indicators at a time using just one small brick per each of them. These indicators involve Awesome Oscillator, CCI, DeMarker, MACD, RSI, RVI, Stochastic, Larry Williams' Percent Range, Bulls Power and Bears Power. An important function of the indicator is an ability to monitor signals from different timeframes. You can choose different combina
FREE

Trend Rising 是自定義 MT4 (Metatrader 4) 指標,最適合剝頭皮 TF M30 及以下,使用基於多個時間框架的 Bill William 指標分析趨勢和動量模式。結果,它確定了適用於大多數貨幣對的趨勢的開始和結束。 Trend Rising 指標是基於 Accelerator Oscillator 和 Awesome Indicator 開發的。
主要特徵 用顏色顯示趨勢的開始和結束。 使用 base-TF H1 輕鬆識別趨勢強度(強牛市和熊市)。 識別市場調整。 (當前圖表的弱勢和可能的逆轉) 當建議的條目發佈時,在圖表上繪製 SL 級別。 獲取圖表中發生的每一次趨勢變化的警報。
趨勢上升的優勢 使用所有貨幣對(外匯、加密貨幣、指數和商品) 使用所有時間範圍。 (推薦時段:M30及以下TF) 警報生成器。 (彈出警報、推送通知警報等) 未重新粉刷 100% 免費指標
接觸 如果您有任何疑問或需要幫助,請通過私信與我聯繫。
作者 Safwan Daud,馬來西亞貿易分析師。青年商品交易員(YCT)創始人
FREE
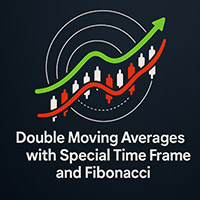
Double Moving Averages with Special Time Frame and Fibonacci (DMA_Special_TF_with_Fibo) Author: Mir Mostofa Kamal
Version: 1.00
Platform: MetaTrader 4 (MT4) Overview Double MA With Special Time Frame with Fibo is a powerful, all-in-one custom indicator designed for traders who want to combine moving average crossover strategies with multi-time frame logic and Fibonacci retracement levels . It intelligently adapts its behavior based on the current chart time frame and adds visual and audibl
FREE
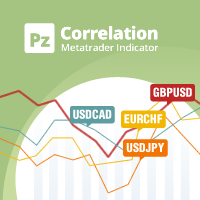
In the world of finance, correlation is a statistical measure of how two securities move in relation to each other. Correlations are used in advanced portfolio management. This indicator measures how different securities move in relation to a reference one, thus making portfolio management easier. [ Installation Guide | Update Guide | Troubleshooting | FAQ | All Products | Get Help ] Avoid concurrent trades in highly correlated instruments Find trading opportunities among highly correlated
FREE

Power Trend Free - the indicator shows the trend strength in the selected period.
Input Parameters The indicator has three input parameters: Period - a positive number greater than one, it shows the number of candlesticks used for calculations. If you enter one or zero, there will be no error, but the indicator will not be drawn. Applied Price - the standard "Apply to:" set meaning data used for the indicator calculation: Close - Close prices; Open - Open prices; High - High prices; Low - Low p
FREE
This is Demo Version of PipsFactoryMonthly This indicator depends on High and Low price of Currency in last Month and then i made some secret equations to draw 10 lines.
Features You will know what exactly price you should enter the market. You will know when to be out of market. You will know you what should you do in market: Buy Sell Take profit and there are 3 levels to take your profit Support Resistance Risk to buy Risk to Sell
Signal Types and Timeframe Used You can use this indicator ju
FREE
The Commitments of Traders Ratio Indicator is one of these things you never thought about it before you really see the magic behind it. The indicator shows the Ratio of long/short positions released by the CFTC once a week.
If you have a look on the Sreenshot you can see two (three) zones of interest. Zone 1: The Switches (Red -> Green, Green -> Red) Zone 2: MA cross Zone 3: If you combine this with the COX indicator an additional zone will appear. You also can experiment with Ratio crossing MA
FREE

Umagads Candle Timer MT4:纪律交易者的专业精准计时工具 在快速波动的交易市场中,精确掌握蜡烛图的收盘时间是区分成功交易与错失机会的关键。 Umagads Candle Timer MT4 是一款专为追求卓越执行力的交易者设计的高效实用程序。无论您是进行 M1 的超短线头寸交易,还是在日线图上进行波段交易,此工具都能为您提供所需的实时数据。 核心功能详情: 智能时间显示: 系统会根据当前周期自动调整格式。在内盘交易(M1-M30)中显示“分:秒”,而在小时图或更高周期中提供更详细的时分秒显示。 视觉紧急系统: 当蜡烛图进入最后 10 秒倒计时,计时器颜色会变为橙色。这种视觉线索能帮助交易者在关键时刻保持高度集中。 动态位置调整: 计时器可以漂浮在价格线旁边,也可以固定在图表的四个角落。我们优化了 MT4 的坐标算法,确保即使在屏幕边缘,文字显示也清晰完整。 全面警报覆盖: 支持桌面弹窗、手机推送(iOS/Android)和电子邮件警报。您可以自定义提前预警时间,默认设置为收盘前 30 秒。
FREE
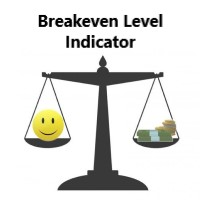
This indicator shows the breakeven line level for the total number of open positions of the current symbol with P/L value and total volume. This indicator is helpful to decide the exit level when using a trading grid strategy. The style of the breakeven line is customizable to choose the color, line shape and font size of the positions description. Send mobile notification when crossing a positive P/L target
FREE
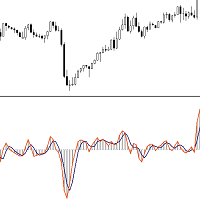
This Indicator is based on Mr. Dan Valcu ideas.
Bodies of candles(open-close) are the main component used to indicate and assess trend direction, strength, and reversals.
The indicator measures difference between Heikin Ashi close and open.
Measuring the height of candle bodies leads to extreme values that point to trend slowdowns. Thus quantifies Heikin Ashi to get earlier signals.
I used this indicator on Heiken Ashi charts but, it's possible to choose to calculate Body size based on Heik
FREE

RaysFX WPR Strategy Indicator RaysFX WPR Strategy è un indicatore di strategia di trading basato sul calcolo del WPR (Williams Percent Range). Questo indicatore utilizza tre lunghezze diverse per il calcolo del WPR e pesa i risultati per fornire un valore complessivo del WPR.
Caratteristiche: - Calcola il WPR utilizzando tre lunghezze diverse (9, 33, 77) - Utilizza un sistema di pesi per combinare i tre valori del WPR in un unico valore - Genera alert in base al numero di alert impostato dall'
FREE
您知道为什么MetaTrader市场是出售交易策略和技术指标的最佳场所吗?不需要广告或软件保护,没有支付的麻烦。一切都在MetaTrader市场提供。
