Conheça o Mercado MQL5 no YouTube, assista aos vídeos tutoriais
Como comprar um robô de negociação ou indicador?
Execute seu EA na
hospedagem virtual
hospedagem virtual
Teste indicadores/robôs de negociação antes de comprá-los
Quer ganhar dinheiro no Mercado?
Como apresentar um produto para o consumidor final?
Indicadores Técnicos Grátis para MetaTrader 4 - 28

IntradayMagic прогнозирует характер ATR и тиковых объёмов на 1 сутки вперёд. Индикатор не перерисовывается и не отстаёт. Используя Intraday Magic вы можете значительно повысить качество торговли и избежать излишних рисков. По его показаниям можно детектировать кризисные состояния рынка и моменты разворота тренда, уточнять моменты и направления входов. Это бесплатная ознакомительная версия ограничена символами (парами) включающими GBP. Никаких иных ограничений нет. Для других пар вы можете исполь
FREE

The Shenzhen Stock Exchange Session's Hours
This indicator facilitates observing the currency pair's quotations during subsequent parts of the stock exchange session live. Before the session starts, a rectangle is drawn on the chart but not filled in with color. It means the extent of the session duration. Before the first bar enters the rectangle of the session, a sound signal or pop-up window will notify us that the session will just start. When the price graph crosses the edge of the sessi
FREE

This indicator displays the signals based on the values of the classic Money Flow Index (MFI) indicator on the price chart. The volume is considered during the calculation of the MFI values. The MFI can be used for determining the overbought or oversold areas on the chart. Reaching these levels means that the market can soon turn around, but it does not give signal, as in a strong trend the market can stay in the overbought or oversold state for quite a long time. As with most oscillators, the s
FREE
MAS Indicator can be used in all currency pairs and at any timeframe, it is suitable for any trading speed. In addition, it's relatively easy to trade with the MAS Indicator. This indicator produces two signals: BUY Signal: arrow deep sky blue SELL Signal: arrow red
Indicator parameters MA Method – type of moving average MA Shift – shift moving average Fast - fast period moving average Slow – slow period moving average RSI – value rsi Confirm – value confirm Flat – value flat Colors - colors o
FREE

This is an original trend indicator. The indicator draws three lines in a separate window. Its values vary from -1 to +1. The closer the indicator is to +1, the stronger is the ascending trend. The closer it is to -1, the stronger is the descending trend. The indicator can be also used as an oscillator for determining the overbought/oversold state of the market. The indicator has one input parameter Period for specifying the number of bars to be used for calculations.
FREE

CAD INDEX
The Currency Index Project is ONE part of a thorough Forex study. Many people do not know the theoretical basis that drives currency exchange rates to move on the market. With this set of tools you will be able to have a more complete view of the entire market by analyzing not only the single currency of an exchange, but all the exchange rates that make up that currency by looking at a single window!
The indicator faithfully represents the real index of a single currency present in
FREE
Version History Date Version Changes 07/09/2022 1.10 Initial released Description The RedeeCash RSI is your typical RSI indicator with the three latest RSI calculations exposed as global variables for easier integration with scripts and expert advisors. Code Sample To invoke this indicator from an EA or script, call the iCustom metatrader function, iCustom ( Symbol (), PERIOD_CURRENT , "Market/RedeeCash RSI" , 14 , 1 , 0 ); string RSIVarName = StringConcatenate ( Symbol (), "_rsi" ); string RSIP
FREE

Indicator for fast navigation through financial instruments. When you click on the button, you go to the chart of the financial instrument, the name of which was written on the button. In other words, the indicator opens or unfolds an existing chart window. For each chart, you can customize the name of the financial instrument, text color and background color; in total, you can customize symbols buttons that you trade often. The indicator can be installed on any charts for which you need to swit
FREE
This indicator combines the best features of a trend indicator and an oscillator. Effective trend detection and short-term price fluctuations.
Operating principle: The indicator analyzes price direction using one of many standard oscillators. If the oscillator indicates a change in the direction of price movement, the indicator signals this by placing a small arrow on the chart opposite the bar on which the oscillator gave the corresponding signal. At the same time, the main signal of the indi
FREE
This indicator is based on the idea of a popular Trend Trigger Factor indicator (TTF). The indicator determines a price movement direction comparing high and low of the current candle with high and low of a price for a longer period.
The indicator parameters: Long_TTF_Bars - number of candles to calculate the price movement direction for a longer period of time (cannot be less than 2) Short_TTF_Bars - number of candles to calculate the price movement direction for a shorter period of time (can
FREE
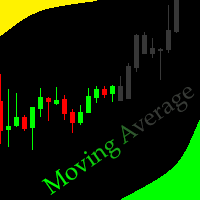
This indicator allows to hide moving average (on all MT4 timeframes) from a date define by the user with a vertical line (Alone) or a panel (with "Hidden Candles"). Indicator Inputs: MA Period MA Shift MA Method MA Apply To Information on "Moving Average" indicator is available here: https://www.metatrader4.com/en/trading-platform/help/analytics/tech_indicators/moving_average ************************************************************* Hey traders!! Give me your feeds! We are a community h
FREE

The presented indicator marks signals on the price chart with arrows in accordance with the data of the Hull Momentum AM indicator. The indicator gives a signal and sends a notification to the mobile terminal and email. The indicator is part of a series of indicators - Hull Line AM, Hull Momentum AM, Hull Candles AM, Hull Signal AM . For a better understanding of the operation of each of the indicators, it is recommended to start working with them by using them together on one chart. The Hull M
FREE
A quick indicator with simple settings that does not take up much space in the working window and is displayed as simply as possible. The indicator analyzes the ratio of maximum and minimum prices for selected periods. Visually, the indicator is similar to its first version (Chainsaw AM), but a completely different principle is used for calculation. The indicator allows you to clearly determine the medium/short-term trend and support/resistance levels at points where the trend direction changes.
FREE

This indicator displays Stochastic osc signals on the price chart and allows the user to receive notifications of such signals. The Stochastic indicator is a classic and proven indicator of the technical analysis of the markets. Despite its age, it is still relevant today. Depending on the settings, the indicator allows you to work effectively on various TFs and any markets. Signals are given on fully formed bars and are not redrawn.
Custom Parameters: Stochastic_Price (0-1) - The applied pric
FREE
The presented indicator gives signals about the price exiting the Keltner channel, as well as about the price returning to the channel. Keltner channel is a technical indicator consisting of two bands above and below the moving average of the price indicator, the width of which is determined as a share of the average price change over the period. The author of this technique is Chester W. Keltner, who published it in his book How To Make Money in Commodities in 1960. The Keltner channel has unde
FREE
Double Smoothed Stochastics – DSS Bressert is an oscillator introduced by William Blau and Walter Bressert. The calculation of DSS Bressert values is similar to the stochastic indicator. The confirmation of the indicator's signal is the overcoming by the price of the high/low of the bar on which the signal was given by the indicator.
Settings: Price - the price at which the indicator is calculated; EMA_Period - smoothing period; Stoch_Period - oscillator period;
OB_Level - overbought level;
FREE

The indicator is an interpretation of the Average Directional Movement Index (ADX) allowing you to determine if there is a price trend. It was developed by Welles Wilder and described in his book "New concepts in technical trading systems". The indicator determines entry points and uses crossing of ADX +/- lines and growth or fall of the main ADX line. When the indicator crosses the zero line, the trend is changed. If the oscillator's value is 1 - the price grows, the trend remains; If the oscil
FREE

This indicator calculate the minimum,maximum,average and relative (to points of the bar) spread in the chart applied period. The indicator must be applied to one or more different period on a Pair and analyze the spread for all the Pairs available by the Broker. The csv output for one minute chart is something like this https://gofile.io/?c=K5JtN9 This video will show how to apply the indicator https://youtu.be/2cOE-pFrud8 Free version works only for GBPNZD
FREE
The presented indicator gives signals about the price leaving the Donchian channel, as well as about the price returning to the channel. Donchian channel - a technical indicator developed by Richard Donchian, is a variation of the trading interval breakout rule. It is built by taking the highest (high from High) and lowest (low from Low) prices for the previous n periods, followed by marking the area between them on the chart. Donchian recommended using his indicator for daily timeframes with an
FREE
The presented indicator allows you to visualize the direction of the trend while cutting off minor price fluctuations. The indicator's customizable parameter (Filter) determines the number of points for the current financial instrument that the indicator cuts off in the process of determining the trend. Despite its simplicity, the indicator can be useful for both beginners and experienced traders. The indicator marks trend reversal points and can send notifications of such signals to the termina
FREE

The Toronto Stock Exchange Session's Hours
This indicator facilitates observing the currency pair's quotations during subsequent parts of the stock exchange session live. Before the session starts, a rectangle is drawn on the chart but not filled in with color. It means the extent of the session duration. Before the first bar enters the rectangle of the session, a sound signal or pop-up window will notify us that the session will just start. When the price graph crosses the edge of the sessio
FREE

The indicator accurately identifies a short-term trend both on trend and flat markets. The confirmation of the signal is the overcoming by the price of the high/low of the bar on which the signal was given. Signals are given on fully formed bars and are not redrawn. Calculations are based on the system of Moving Averages. The indicator is highly sensitive. Use it together with other technical analysis indicators.
Settings: Sensitivity - amount of bars for the indicator calculation (1 or higher
FREE
This indicator displays signals about the standard MACD crossing the zero value, as well as about crossing the signal line. The indicator does not redraw. Signals are shown on fully formed candles. The indicator can send notifications of its signals to the terminal and email. Custom Parameters: Fast_EMA_Period - fast moving average period; Slow_EMA_Period - slow moving average period; Signal_Period - signal line period; MACD_Price - the price at which the indicator is built;
Alerts - show a
FREE
The indicator improves the idea implemented in the standard Bulls and Bears indicator. This indicator displays the difference between the High and Low for the current period of time and the values of the channel constructed at the maximum and minimum prices, which are smoothed by Laguerre method. The growth of the indicator values above zero indicates that the High for the current period is greater than the average of the High prices. This situation in most cases indicates an increase in the
FREE
One of the basic rules of trading is that the trend is your friend. The presented indicator is one of the best solutions for building your own trading system. Basic rules for its use: Green line - buy trades are allowed; Red line - sell trades are allowed. The indicator displays signals confirming the development of a bullish and bearish trend using the ADX oscillator algorithm. Average directional movement index (ADX) determines a price movement direction comparing its high and low with high an
FREE

This indicator displays the signals based on the values of the classic RSI indicator on the price chart. The RSI can be used for determining the overbought or oversold areas on the chart. Reaching these levels means that the market can soon turn around, but it does not give signal, as in a strong trend the market can stay in the overbought or oversold state for quite a long time. As with most oscillators, the signals are generated when leaving these areas. This indicator allows to display three
FREE

This indicator is a combination of classic trend indicator and signals of the slow digital filter. The indicator has no configurable parameters. The signals are displayed on completed bars and are not redrawn. It shows high efficiency on periods less than 1 hour. The usage principle is intuitive - trade in the direction shown by the fan of moving averages. Enter once the price exceeds the High/Low of the bar where the signal was formed. Exit on the opposite conditions.
FREE
The presented indicator marks signals on the price chart with arrows in accordance with the data of the FATL Momentum AM indicator. The indicator gives a signal and sends a notification to the mobile terminal and email. The FATL Momentum AM indicator is the difference between the current price and the price some number of periods ago. The difference from the classic indicator Momentum is the preliminary smoothing of prices by an adaptive digital filter - FATL. Confirmation of the indicator signa
FREE

The Shanghai Stock Exchange Session's Hours
This indicator facilitates observing the currency pair's quotations during subsequent parts of the stock exchange session live. Before the session starts, a rectangle is drawn on the chart but not filled in with color. It means the extent of the session duration. Before the first bar enters the rectangle of the session, a sound signal or pop-up window will notify us that the session will just start. When the price graph crosses the edge of the sessi
FREE

The Bombay Stock Exchange Session's Hours
This indicator facilitates observing the currency pair's quotations during subsequent parts of the stock exchange session live. Before the session starts, a rectangle is drawn on the chart but not filled in with color. It means the extent of the session duration. Before the first bar enters the rectangle of the session, a sound signal or pop-up window will notify us that the session will just start. When the price graph crosses the edge of the session
FREE
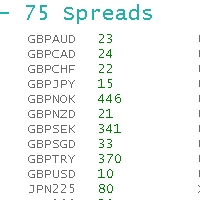
ObiForex 75 Spreads Discover a powerful indicator showcasing instant spreads for 75 currency pairs. Unlock valuable insights for informed trading decisions and optimize your strategies. The indicator features 3 columns, providing a comprehensive view of the spreads. Spread reading can be effectively used with macroeconomic news. Share your strategies! For optimal performance, install the indicator on the USDJPY currency pair. Experience the capabilities of ObiForex 75 Spreads and elevate your tr
FREE
This indicator displays candle prices on the chart, colored according to the data of a linear regression of various prices (at the user's choice) for a selected period of time. The user has the option to select two different price types and two different time periods. The indicator will display the moments of coincidence of the directions of the linear regression.
Usage: After the full formation of a candle colored in the opposite color to the previous candle, place a stop order at the high /
FREE

This indicator maps price crossover with Simple Moving Average (SMA) for each candle. Works like a SMA but has non-repaint characteristic. How to Use: As stated before, this indicator works like a SMA. Use this to determine trend. When price is above this line then the uptrend is expected (downtrend if price below the line). 2 of these indicator (with different periods) can also generate buy/sell signal like 2 SMAs. When the lower period SMA crosses higher period SMA from below, then buy signal
FREE

CHF INDEX
The Currency Index Project is ONE part of a thorough Forex study. Many people do not know the theoretical basis that drives currency exchange rates to move on the market. With this set of tools you will be able to have a more complete view of the entire market by analyzing not only the single currency of an exchange, but all the exchange rates that make up that currency by looking at a single window!
The indicator faithfully represents the real index of a single currency present in
FREE

NZD INDEX
The Currency Index Project is ONE part of a thorough Forex study. Many people do not know the theoretical basis that drives currency exchange rates to move on the market. With this set of tools you will be able to have a more complete view of the entire market by analyzing not only the single currency of an exchange, but all the exchange rates that make up that currency by looking at a single window!
The indicator faithfully represents the real index of a single currency present in
FREE
This indicator is an oscillator built on the principle of the classic Momentum. The indicator is part of a series of indicators - Hull Line AM, Hull Momentum AM, Hull Candles AM, Hull Signal AM . The indicator represents the difference between the current price and the price some number of periods ago. The difference from the classic indicator Momentum is the preliminary smoothing of prices according to the method proposed by Alan Hull.
Using the indicator: It should be taken into account tha
FREE
The presented indicator colors the chart candles in accordance with the data of the Hull Momentum AM indicator. Coloring of candlesticks depends not only on the location of the oscillator histogram above or below zero. The location of the histogram relative to the signal line is also important. The indicator is part of a series of indicators - Hull Line AM, Hull Momentum AM, Hull Candles AM, Hull Signal AM . For a better understanding of the operation of each of the indicators, it is recommended
FREE

Infometer индикатор для вывода информации в одном из углов - сколько пунктов (пипсов) или в валюте депозита профита во всех отрытых ордеров данного торгового инструмента. В меню индикатора внесены такие данные 1. Угол вывода информации. 2. Цвет вывода информации. 3. вывод валюты депозита и пипсов. 4. Выбор вывода информации - профит и пункты - профит -пункты. На белом фоне автоматически информация выводится черным цветом на других фонах цвет вывода информации определяется в меню.
FREE
One of the standard ways to determine the direction of price movement at a particular moment is to calculate a linear regression for the values of such a price over a certain period of time. This indicator displays a line on the price chart based on the values of the linear regression of the selected price for the selected period of time. The indicator is as simple as possible and can be used within any trading strategy. The indicator is not redrawn on fully formed bars. Settings: Ind_Period - T
FREE
This indicator is a line constructed based on the maximum/minimum values that go beyond the channel from the maximum/minimum prices for a longer period. In fact, two types of channel are used simultaneously: The first one is built based on the highs/lows for the selected period (Ind_Period); The second one is built based on the smoothed value of the maximum/minimum price values (Smoothing_Channel, Shift_Channel). To calculate the indicator, the highest/lowest value of the two channels is tak
FREE

This indicator displays the moment when the TTF oscillator crosses the zero value, and the moment when the TTF oscillator crosses its smoothed value. Crossing the zero value by the TTF oscillator is a buy/sell signal. If the TTF oscillator crosses its smoothed value, it is a signal of a trend change. The signal is given after the end of the formation of the candle. The signal is confirmed when the price crosses the high/low of the bar on which the signal was given. The indicator does not redraw.
FREE

This indicator displays the signals of a highly effective oscillator - Laguerre Osc 2 AM - on the price chart. The presented indicator uses the Laguerre filter to build an oscillator. The indicator has the possibility of double additional smoothing, which can be useful for small values of the Gamma parameter. The indicator gives three types of signals: Exit of the oscillator from the overbought / oversold zone; The oscillator crossing the middle of the value between the overbought/oversold
FREE
The presented indicator is a trend indicator that displays with a colored line the current direction of price movement and the support/resistance zone in the form of a cloud. The indicator also marks points of change in price direction with arrows that appear after the bar is fully formed. The arrows are not redrawn. The rules for using the indicator are simple: We open a position when the price overcomes the high/low of the bar marked with an arrow in the direction opposite to the cloud. Arrow
FREE

This indicator displays the signals based on the values of the classic CCI indicator on the price chart. The CCI can be used for determining the overbought or oversold areas on the chart. Reaching these levels means that the market can soon turn around, but it does not give signal, as in a strong trend the market can stay in the overbought or oversold state for quite a long time. As with most oscillators, the signals are generated when leaving these areas. This indicator allows to display three
FREE
This indicator displays DSS Bressert AM signals on the price chart. The calculation of DSS Bressert values is similar to the stochastic indicator. The confirmation of the indicator's signal is the overcoming by the price of the high/low of the bar on which the signal was given by the indicator. Settings: Price - the price at which the indicator is calculated; EMA_Period - smoothing period; Stoch_Period - oscillator period;
OB_Level - overbought level; OS_Level - oversold level;
Show_Move -
FREE
This indicator displays on the price chart signals about the standard MACD crossing the zero value, as well as about crossing the signal line. The indicator does not redraw. Signals are shown on fully formed candles. The indicator can send notifications of its signals to the terminal and email. Custom Parameters: Fast_EMA_Period - fast moving average period; Slow_EMA_Period - slow moving average period; Signal_Period - signal line period; MACD_Price - the price at which the indicator is built
FREE
The indicator generates signals for opening positions. The principle of operation is to compare the current closing price with the closing price range for a longer period. The signals are confirmed when the price exceeds the High/Low of the bar where the indicator generated the signal. Maintenance of an open position is carried out on a smaller TF. Indicator signals to open an opposite position on a smaller TF are a signal to close the deal. This indicator does not repaint or not recalculate.
FREE
This indicator is an implementation of the "One shot - one hit" principle. In the course of work on the creation of this product, an attempt was made to achieve the maximum balance between the sensitivity of the indicator and the effectiveness of its signals. This tool is as reliable and effective as a 45 caliber revolver, but in the same way it requires discipline and understanding of the conditions and purpose of use from its user. The indicator has only one adjustable parameter that determine
FREE
This indicator is a combination of classic trend indicator and signals of the fast digital filter. The indicator has no configurable parameters. The signals are displayed on completed bars and are not redrawn. It shows high efficiency on periods greater than 1 hour. The usage principle is intuitive - trade in the direction shown by the fan of moving averages. Enter once the price exceeds the High/Low of the bar where the signal was formed. Exit on the opposite conditions.
FREE

The indicator is based on the elements of Bill Williams' trading system. Sell signals are formed when MACD and OsMA values are falling simultaneously (Bill Williams calls these indicators АО and АС in his book), while buy signals appear when both indicators are rising. Thick and thin colored histograms match MACD and OsMA values. If the histogram is greater than 0, the indicator value is rising. Otherwise, it is falling. Positions should be opened when the price exceeds the bar's high or low, at
FREE
This indicator displays the Laguerre Osc AM indicator signals on the price chart. The presented indicator uses the Laguerre filter to build a classical type oscillator, similar in its appearance and method of application to the regular MACD. At the same time, this tool is much more flexible in settings compared to the usual MACD and, thanks to the Laguerre filter, is more sensitive to price movements. Laguerre Osc allows you to choose the parameters in such a way as to be effective for almost an
FREE
This indicator displays DSS Bressert AM signals on the price chart. The calculation of DSS Bressert values is similar to the stochastic indicator. The confirmation of the indicator's signal is the overcoming by the price of the high/low of the bar on which the signal was given by the indicator. Settings: Price - the price at which the indicator is calculated; EMA_Period - smoothing period; Stoch_Period - oscillator period;
OB_Level - overbought level; OS_Level - oversold level;
FREE
DF Signal AM - this is an indicator that marks on the chart the moments when the price direction changes. The indicator uses adaptive digital filters for analysis. Digital filters are (simplified) a way to smooth data. Unlike traditional moving averages, a digital filter will be more effective in most cases. The indicator does not redraw, the signal is generated after the candle is completed. It is optimal to use the indicator signals as signals to open a trade when the price overcomes the maxim
FREE

This indicator displays the moment when the DeMarker oscillator crosses its smoothed value. If the DeMarker oscillator crosses its smoothed value, it is a signal of a trend change. The signal is given after the end of the formation of the candle. The signal is confirmed when the price crosses the high/low of the bar on which the signal was given. The indicator does not redraw.
Custom Parameters: DeM_Period (>1) - DeMarker indicator period; MA_Period - period for smoothing DeMarker indicator va
FREE

The indicator analyzes TTF and ATR data to define the current trend and allow traders to gain maximum profit from strong price movements. The indicator is intuitively clear: line direction change - trend direction change. Change of the line color warns of a coming direction change.
Customized parameters:
Ind_Period (>1) - TTF calculation period; Sensitivity (>1) - ATR sensitivity. Alerts - show a dialog box containing user data; Send_Mail - sends an email using an address specified on the Em
FREE

This indicator displays the moment when the TTF oscillator crosses the zero value, and the moment when the TTF oscillator crosses its smoothed value. Crossing the zero value by the TTF oscillator is a buy/sell signal. If the TTF oscillator crosses its smoothed value, it is a signal of a trend change. The signal is given after the end of the formation of the candle. The signal is confirmed when the price crosses the high/low of the bar on which the signal was given. The indicator does not redraw.
FREE
This indicator is based on the idea of a popular Trend Trigger Factor indicator (TTF). The indicator determines a price movement direction comparing high and low of the current candle with high and low of a price for a longer period. Parameters: Long_TTF_Bars - number of candles to calculate the price movement direction for a longer period of time (cannot be less than 2) Short_TTF_bars - number of candles to calculate the price movement direction for a shorter period of time (cannot be less tha
FREE
The presented indicator displays a trend line and support/resistance line on the price chart. A change in the direction of the trend line indicates a change in the medium-term trend. A trend line above the support line is a buy signal. A trend line below the resistance line is a sell signal. Specific rules of using the indicator are set out in the comments to it.
FREE

This technical indicator is a Momentum indicators built using a fast adaptive digital filter - FATL. In a simplified sense, an adaptive digital filter is a moving average with effective smoothing. Using a digital filter allows you to smooth out sharp fluctuations with minimal signal delay. Using the indicator: It should be taken into account that the values of the indicator on the zero bar (which has not finished forming yet) may change, so decisions should be made after the end of the bar for
FREE

This indicator is a combination of classic trend indicator and signals of the fast digital filter. The indicator has no configurable parameters. The signals are displayed on completed bars and are not redrawn. It shows high efficiency on periods greater than 1 hour. The usage principle is intuitive - trade in the direction shown by the fan of moving averages. Enter once the price exceeds the High/Low of the bar where the signal was formed. Exit on the opposite conditions.
FREE
The presented indicator marks signals on the price chart with arrows in accordance with the data of the T3 Momentum AM indicator. The indicator gives a signal and sends a notification to the mobile terminal and email. The indicator is part of a series of indicators - T3 Line AM, T3 Momentum AM, T3 Candles AM, T3 Signal AM . For a better understanding of the operation of each of the indicators, it is recommended to start working with them by using them together on one chart. The T3 Momentum AM
FREE
This indicator is a moving average built using the triple exponential smoothing method (T3). The indicator is part of a series of indicators - T3 Line AM, T3 Momentum AM, T3 Candles AM, T3 Signal AM .
The indicator has minimal lag and allows you to effectively follow the trend direction. The indicator is not redrawn on fully formed bars. The indicator is supplemented with signals and notifications to the terminal and e-mail.
The application of the indicator is identical to the application o
FREE
The indicator marks control points on the price chart, overcoming which by the price is a signal to open a deal. At the points marked by the indicator, the maximum or minimum price values go beyond the price channel built on the basis of price values for a longer period. After overcoming such points, the price is likely to continue moving in the same direction. The indicator does not redraw and, despite its simplicity, can be quite an effective trading tool.
Adjustable parameters: i_Period
FREE
A quick indicator with simple settings that does not take up much space in the working window and is displayed as simply as possible. The indicator analyzes the divergence of the current closing price and the data obtained by smoothing the price series with two different (fast/slow) digital filters. The indicator allows you to clearly determine the medium/short-term trend and support/resistance levels at points where the trend direction changes. Indicator: does not redraw; has the ability to sen
FREE
The indicator analyzes the difference between the current price and the standard MA data. The indicator is not redrawn on the formed bars. To confirm the signal of the indicator, it is necessary to wait for the price to overcome the high (for buying) or the low (for selling) of the bar where the indicator changed color. The indicator is easy to use and configure. The indicator is effective as an element of any trend trading strategy. Custom Parameters: MA_Period - MA period; MA_Shift - MA shift;
FREE
This indicator displays RVI indicator signals. The main point of Relative Vigor Index Technical Indicator (RVI) is that on the bull market the closing price is, as a rule, higher, than the opening price. It is the other way round on the bear market. So the idea behind Relative Vigor Index is that the vigor, or energy, of the move is thus established by where the prices end up at the close. To normalize the index to the daily trading range, divide the change of price by the maximum range of price
FREE
The indicator colors candlesticks of the price chart in accordance with the data of two CCI indicators from different timeframes. If both CCI indicators are above 0, the indicator paints the candle in the color that signals about price growth, and vice versa. The indicator allows to efficiently follow the trend, track short-term price rollbacks, and also to identify price reversals. The indicator does not redraw.
Settings CCI1_Period ( >1) - period of the fast CCI osc; CCI1_Price - price of th
FREE
The indicator identifies the strength of the trend based on the points where the WPR indicator exceeds the overbought and oversold levels. The indicator does not redraw. This indicator:
Suitable for all markets; Not redrawn; Intuitive and simple; It can be useful for both beginners and experienced traders; Allows you to identify market entry points where there is a high probability of a significant price movement sufficient for a successful transaction; Settings: Ind_Period (>1) - period of
FREE
The indicator identifies the strength of the trend based on the points where the CCI indicator exceeds the overbought and oversold levels. This indicator: Suitable for all markets; Not redrawn; Intuitive and simple; It can be useful for both beginners and experienced traders; Allows you to identify market entry points where there is a high probability of a significant price movement sufficient for a successful transaction; Settings: Ind_Period (>1) - period of the indicator; Price - price f
FREE
The indicator identifies the strength of the trend based on the points where the RSI indicator exceeds the overbought and oversold levels. The indicator does not redraw. This indicator:
Suitable for all markets; Not redrawn; Intuitive and simple; It can be useful for both beginners and experienced traders; Allows you to identify market entry points where there is a high probability of a significant price movement sufficient for a successful transaction; Settings: Ind_Period (>1) - period of
FREE
Você sabe por que o mercado MetaTrader é o melhor lugar para vender as estratégias de negociação e indicadores técnicos? Não há necessidade de propaganda ou software de proteção, muito menos problemas de pagamentos. Tudo é providenciado no mercado MetaTrader.
Você está perdendo oportunidades de negociação:
- Aplicativos de negociação gratuitos
- 8 000+ sinais para cópia
- Notícias econômicas para análise dos mercados financeiros
Registro
Login
Se você não tem uma conta, por favor registre-se
Para login e uso do site MQL5.com, você deve ativar o uso de cookies.
Ative esta opção no seu navegador, caso contrário você não poderá fazer login.