 MetaTrader 5
 专家
专家
 指标
指标
 程序库
程序库
 实用工具
实用工具
 窗口小部件
窗口小部件
 规则
规则
适用于MetaTrader 4的免费技术指标 - 35
 下面列出的技术指标信号对MetaTrader 4平台的开仓交易和平仓交易起着至关重要的作用。
指标的本质就是一种交易品种的数学转换,旨在预测价格变化。
下面列出的技术指标信号对MetaTrader 4平台的开仓交易和平仓交易起着至关重要的作用。
指标的本质就是一种交易品种的数学转换,旨在预测价格变化。 
DMI Show High Low: Visualize Key Market Levels in Real Time 100% free, functional, and without limitations! The DMI Show High Low is an essential tool for traders, designed to display High, Low, and Close levels of a selected timeframe directly on your chart. Ideal for identifying key market zones, this indicator helps enhance your decision-making and trading precision. Parameters: Timeframe: Select the timeframe for displaying High, Low, and Close levels. Default: D1 (Daily) Display Close Line:
FREE

Alert TIME LINE indicator warns that the price has reached a specified time level.
Drag the indicator onto the chart, press the SET TIME LINE button, move the line that appears to the desired time, when the chart reaches the specified time, an alert will be triggered.
This indicator is used as an auxiliary tool when trading time zones, using the free TIME LINE Forex System , see the results and screenshots below.
You can get the system for free in the technical support chat https://t.me/Cycl
FREE

Displays previous months Highs & Lows. You can set the number of months to display levels for, also the line style, color and width. This is very useful for traders using the BTMM and other methods like ICT. I'll be creating similar indicators for MT5 for the BTMM. Send me your suggestions to my Telegram: https://t.me/JDelgadoCR Take a look at my other products at: https://www.mql5.com/en/users/jdelgadocr/seller
FREE
Spread Sekanas: The True Cost of Your Trade Stop guessing with pips and points. Start seeing the real , proportional cost of the spread with the Spread Sekanas indicator. The traditional spread, measured in pips, is misleading. A 2-pip spread on EUR/USD is completely different from a 2-pip spread on GBP/JPY or a $2 spread on Gold. This makes it impossible to consistently compare your real trading costs across different instruments. The Spread Sekanas indicator solves this problem by measuring th
FREE
The ATR Strategy Multiplier is designed to help traders assess market volatility using the Average True Range (ATR) across multiple timeframes. It calculates and displays ATR values along with recommended Stop Loss (SL) and Take Profit (TP) levels based on the ATR. These levels are essential for setting risk management parameters and optimizing trading strategies.
Parameters: Indicator Parameters : ATR Period : Determines the period over which the ATR is calculated. Timeframe : Select the time
FREE

Based on a combination of indicators, PS Acid Fulx is an excellent indicator for knowing when to buy or sell on any asset and temporaryity. The indicator myself I have used it as a tool for my analysis when trading Forex. It is a useful and easy-to-understand trend indicator. If you combine it with your own analyses you will surely get a good result in your operation.
FREE
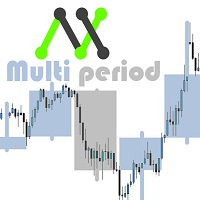
With this customizable indicator you will be able to observe other timeframes besides the usual one. This way you will get to know better the general environment in which the price moves and probably will be better your effectiveness. *It is important that the timeframe in the indicator is greater than that set in Metatrader. I'll share more indicators for free soon. If you have any specific ideas of an indicator that you want to have you can write me a private message directly. Opinions, review
FREE

There are time periods in the market, when trading is highly likely to be unprofitable. This indicator warns you about such non-trading situations and helps you preserve your money and time.
Parameters Remind about non-trading periods: Expiration week - remind about the expiration week Consumer index day - remind a day before the release of Consumer index day NON FARM - remind a day before the release of NON FARM Christmas - remind a day before Christmas New Year Days 25.12 - 15.01 - remind abo
FREE

经过7年的时间,我决定免费发布一些我自己的指标和EA。
如果您觉得它们有用,请 通过五星评级表达支持!您的反馈将继续带来免费工具! 也查看我的其他免费工具 这里
_________________________________ 日内强度指数(III)——精准外汇交易分析工具 精心开发的 MQL4 日内强度指数是一个尖端工具,旨在增强外汇交易分析。该指标采用独特的方法分析基于日内价格变动的资金流动,为交易提供深入的买卖压力分析。 主要特点: 高级分析 : 采用公式 [(2 × 收盘价 - 最高价 - 最低价) / (最高价 - 最低价)] × 成交量,全面展示市场动态。 市场动能 : 准确衡量日内买卖动力,对理解短期市场运动至关重要。 趋势识别 : 帮助发现潜在的趋势反转和市场强度,对及时决策至关重要。 以量衡量的洞察 ️: 整合成交量数据,提供比仅基于价格的指标更细致的视角。 使用和信号解读: 设置 ️: 轻松将 III 指标集成到您的 MetaTrader 4 平台中。根据您的具体交易策略调整设置。 日内分析 : 持续监控
FREE

Dark & Light Themes for MT4.
The Dark & Light Themes indicator helps you switch the MT4 chart display between dark and light color schemes. It also includes a watermark showing the current currency pair (symbol) and the active timeframe.
This simple and clean interface makes it more comfortable for traders to analyze charts using any indicator.
FXDragunov Indonesia.
FREE
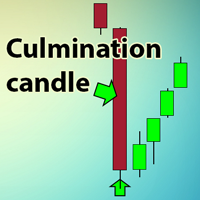
The indicator searches for the largest candles with minimum wicks for the last X candles. Sometimes, such candles mark the presence of a strong buyer, who quickly and strongly pushes the price in the right direction. However, most often, these are culmination candles, especially at the end of a prolonged trend when a single large candle knocks out stop losses of the most persistent traders and the price reverses instantly. The indicator allows you to open a position on the very edge of the marke
FREE

This indicator is a perfect tool able to compare which brokers have the lower latency. It shows us immediately which brokers are slower or faster. When you see the dot icon on the line, it means this broker is the faster one and the red line (Broker_A) is the slower one. See the example on the screenshot.
How It Works? This indicator shares the prices information to and from the "shared" common data folder. It compares all the prices. The price is based on average by (Ask + Bid) / 2. There are
FREE

Introduction This Indicator Is Based On Average Price/Maximum Price Moves, And Using Moving Bollinger Bands And Moving Averages.
The Advantage Of Using It With YOUR own Analysis Will Confirm Potential Supports And Resistances While it Compliments With Your Analysis
The Indicator Is Non-Repainting
AND Along With Our Special Trend METRE that Changes With The Conditions OF A Bullish Or Bearish Trend....
Recommend Time-Frames: H1 H4 M15
Usage: The Indicator Is Very Profitable If Use
FREE
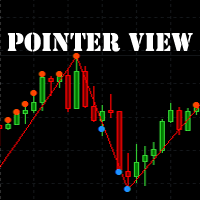
The indicator marks the points on the chart where the standard ZigZag indicator has drawn its top or bottom. With this indicator, you can easily understand where the top or bottom was formed, and where it was redrawn. The indicator gives an alert when a new point appears. Warning! Parameter Applied Price - expands the possibilities of building the indicator. It is possible to build at OPEN, CLOSE and standard HIGH/LOW prices. Input parameters ----------- Depth - period of the ZigZag ind
FREE

Free version of https://www.mql5.com/en/market/product/44606 Simple indicator to calculate profit on fibonacci retracement levels with fixed lot size, or calculate lot size on fibonacci levels with fixed profit. Add to chart and move trend line to set the fibonacci retracement levels. Works similar as default fibonacci retracement line study in Metatrader. Inputs Fixed - select what value will be fix, lot or profit (available in full version, lot is set on free version) Fixed value - value t
FREE
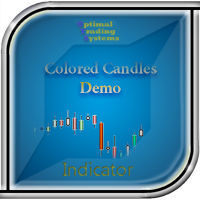
The demo version of the Colored Candles indicator - calculates the parameters of each candle, as well as its volume. After that, it paints the candles depending on their strength and direction. Bullish candles are colored green and bearish candles - red. The greater the power of the bulls or the bears, the brighter the color. You can change the colors if you want. The indicator helps to analyze the price movement, as well as market entry points. The more accurate signals are formed on the higher
FREE

The indicator marks bars with a simple trend definition“ each subsequent high above/below the previous one and each subsequent low above/below the previous one ”. Charles Dow
Formula:
Max – The current maximum Min – The current minimum MaxK – Maximum per period MinK – Minimum per period Min>MinK & Max>=MaxK – Symbol on top Max<MaxK & Min<=MinK – The symbol on the bottom
Input parameter:
Number of bars in the calculated history Period for current timeframe The distance to the symbol Se
FREE
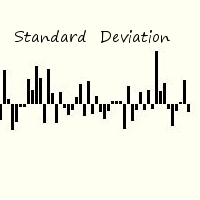
Standard deviation of returns is a popular way to view how the return of one bar relates to history. By knowing that you can better understand the magnitude of any return. The signal is calculated by taking the prior periods returns, adjusting for volatility of the returns of the last twenty periods, and dividing by the standard deviation. It is displayed in a separate panel as a histogram.
FREE

The FX Secretary indicator is a mini assistant for MT-4. His functional duties include - notifying the trader about closing deals with profit or at a loss. In the settings there is only one parameter in which you can change the language of the voice message. So far, the indicator speaks only two languages. In the future, it is possible to expand the functionality with an increase in languages and a set of words. Use for health!
FREE

The indicator represents 4 moving averages, shifted back. Created, like any moving average indicators, in order to see the approximate balance of volatility and the number of bulls and bears. The difference from other Moving Averages is that an attempt is made here to bring the moving averages of different periods to a common denominator, respectively, to bring the number of traders trading on different timeframes to a common denominator. The indicator is distributed as is.
MnojitelMA1, Mnojit
FREE

The indicator detects market efficiencies and inefficiencies by studying price movements and marks candles where the best efficiencies occurred. The most 'efficient' candles are indicated with a vertical bar histogram. Taller bars represent these candles. The highs and lows of these candles are supply and demand areas, important levels that will be retested in the future. It can be used on all time frames with the same settings.
FREE

RJT SALAMANDER, the indicator as in a video game
VERSION 2
Pilot your PRICE spaceship inside the cavern and avoid the collision against the stalactites (green) and stalagmites (red), dodging these obstacles to win.
When these objects are forming (or disappearing) then you must make the decision how to move your ship (just like in a video game)
Depending on the market and the size of the candles/bars you can adjust the calculation of stalactites and stalagmites (based on the last bars) in the
FREE

Add indicator "Symbol Name Drawer " on chart. Indicator creates text object with name of current symbol.
You can change symbols on chart and indicator automatically changes text.
Free to use. Simple tool.
If you have any suggestion you can write me about it in comments. I try to improve this tool in future versions. Thanks for using my indicator. If you want to order something special in mql4 or mql5 message.
FREE

This indicator is an utility for have always under control, how much time is left at the end of the bar setted.
The utility show on the lower right of the chart, the countdown to the end.
When the remaining seconds is = to the seconds set in the input, the color of remaining seconds on chart, change color and play a warning sound to warn you that the bar is about the end. When the remaining seconds is < to the seconds set in the input, the utility play a beep to warn you that the bar is in co
FREE

Pipsurfer Tide Meter is a Momentum Indicator that is designed to help trades know which way the "Tide" is turning. This indicator is a great supporting indicator to the pipsurfer main indicator that is listed in MQL5 under "Pipsurfer Indicator"
The Strategy Behind the Tide Meter is that youll see the blue bars and the red bars. Blue bars are for bullish momentum Red bars are for bearish momentum Use price action to find a trading zone then wait for the tide meter to change color then you ent
FREE
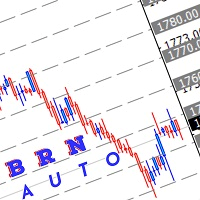
Use this indicator to draw multiple horizontal line to nearest round number Range for round number can be adjust manually depend how user want to use it Selection of colour also can be adjust manually Hope this indicator can help somebody in their trading.
How to use this: Mostly I use this indicator for break, retest and entry. example:- current price XAUUSD :1740.00 which mean the closest level are 1750.00 and 1730.00 Wait for price to break this level. then wait for retracement if price maki
FREE
"Visual Range - Spread Indicator". This Indicator is an Essential Tool for Manual trading. it helps to avoid "off price" and "bad" entries caused by abnormally High spreads. ...................................................................................................................... At the Market Opening and News Reports - the Size of the Spread can go temporarily widely High. The Indicator shows the current Size of the Spread visually on the chart and its distance from the current pr
FREE

Uncomplicated straightforward indicator that shows the maximum account drawdown since the indicator was added to the chart. The indicator does not take transaction history into account since it is impossible to calculate drawdown from historical entries en closures of trades. The indicator will be free in this basic form. Eventually it will be developed but the focus is to keep it plain and simple.
FREE
In addition to the MA of the set period, the MAs of the two higher timeframes with the same period are displayed on the chart simultaneously (though in a simulated way). No matter which timeframe you switch to, it will display the MA for that timeframe as well as the MAs for the two higher timeframes. Additionally, it will show the 200 MA as well!
To display the MA for the higher timeframes on the current chart, you need to set the MA calculated using the Moving Average indicator. If you try to
FREE

T hinking encompasses a flow of ideas and associations that can lead to logical conclusions . Although thinking is an activity of an existential value for humans , there is still no consensus as to how it is adequately defined or understood. Thinking allows humans to make sense of, interpret, represent or model the world they experience, and to make predictions about that world. It is therefore helpful to an organism with needs, objectives, and desires as it makes plans or
FREE
Dynamic Trading Dashboard for MT4 This powerful MT4 trading dashboard offers traders a comprehensive view of current and historical trading performance in an intuitive and visually organized format. With its precision-engineered design, the dashboard provides a seamless blend of real-time insights and historical analysis. This trading dashboard is perfect for meticulous traders who seek a precise, all-encompassing tool to manage open and closed positions while gaining insights into past perform
FREE
Moving averages change on the move. The indicator automatically selects the period for calculating moving averages. The more directional the movement, the longer the averaging period. When the trend slows down, the period of the moving averages decreases and they become faster. This allows you to react faster to a trend change.
The indicator works well in a trend or at a trend reversal point. In the sideways direction, the indicator can be used the other way around, for example, when a fast m
FREE
Tool converted from tradingview. A simple indicator that plots difference between 2 moving averages and depicts convergance/divergance in color coded format.
Anything <= 0 is red and shows a bearish trend whereas > 0 is green and shows bullish trend.
Adjust the input parameters as following for your preferred time frame :
4-Hr: Exponential, 15, 30
Daily: Exponential, 10, 20
Weekly: Exponential, 5, 10
FREE

Trend indicator with oscillator. Displays price area between two moving averages and an oscillator. An uptrend is indicated in red, a downtrend in blue. Settings: Slow MA Period - Slow MA period Fast MA Period - Fast MA period Smoothed Data - Smoothing data Show Area MA - Display MA price areas Show Oscillation - Display MA oscillation Move Oscillation to Slow MA - Display an oscillator on a slow MA Color Up - Uptrend color Color Down - Downtrend color Size Arrow - The size of the oscillator ic
FREE
Rectangle Control простой индикатор который отображает на графике панель для рисования прямоугольников с различными настройками, будет удобен тем кто рисует на графике зоны поддержки, сопротивления. Прямоугольник можно нарисовать с заливкой или без, различной толщины и цвета. А также выбрать таймфрейм на котором нарисованный прямоугольник будет отображаться. При нажатой кнопке алерт будет срабатывать оповещение (если прямоугольник находиться ниже цены на верхнем его краю, если прямоугольник нах
FREE

Adaptive MA is a simple modification of the moving averages (MAs) that allows displaying an average value line based on multiple MAs on the chart. The parameters allow you to set any number of MA periods. The number of parameters is equal to the number of moving averages applied in calculation.
At first, it may seem that nothing new has been invented and there is no sense in this approach. However, this impression is deceptive. As we know, the trends have different duration. Have you ever tried
FREE

The Elsna ATR is a custom MetaTrader 4 indicator that combines two key features into one clean chart overlay: Average True Range (ATR) Display Calculates the current ATR value for the selected period (default = 14). Can show the value in pips or price units . Candle Countdown Timer Displays a live countdown showing how much time remains until the current candle closes. Updates every second, even when the market is quiet. This indicator helps traders quickly gauge market volatility
FREE
Indicator for fast navigation through financial instruments. When you click on the button, you go to the chart of the financial instrument, the name of which was written on the button. In other words, the indicator opens or unfolds an existing chart window. For each chart, you can customize the name of the financial instrument, text color and background color; in total, you can customize symbols buttons that you trade often. The indicator can be installed on any charts for which you need to swit
FREE

Introducing the “Symbol Cost Info MT4” indicator – your ultimate tool for staying ahead in the forex market! This innovative indicator is designed to empower traders with real-time cost information, directly on their charts. Here’s why every trader needs the “Symbol Cost Info MT4” in their arsenal: Real-Time Spread Monitoring : Keep a close eye on the spread for any currency pair, ensuring you enter the market at the most cost-effective times. Pip Value at Your Fingertips : Instantly know t
FREE

GBP INDEX
The Currency Index Project is ONE part of a thorough Forex study. Many people do not know the theoretical basis that drives currency exchange rates to move on the market. With this set of tools you will be able to have a more complete view of the entire market by analyzing not only the single currency of an exchange, but all the exchange rates that make up that currency by looking at a single window!
The indicator faithfully represents the real index of a single currency present in a
FREE

The indicator displays the signals of the RSX Oscillator. The main type of signal is given when the oscillator exceeds the 0 value. If the "Sensitivity" parameter increases above zero, the main signal will also be given when overbought/oversold levels are overcome, defined as zero plus sensitivity and zero minus sensitivity. An additional signal is given when the direction of the oscillator line changes. It is optimal to use the indicator signals as signals to open a trade when the price overcom
FREE

This indicator will show week and monthhigh low, very useful to understand the market sentiment. To trade within the range/ break out. Low- can act as support- can used for pull back or break out High- can act as resistance- can used for pull back or break out Breakout strategy refers to the day trading technique that provides traders with multiple opportunities to go either long or short . The main idea is to identify the trend in its most juicy state followed by a trending move.
FREE
This is a Demo version of PipsFactoryInd it is works only NZD/USD but full version is works on all currency pair.
This indicator is a collection of three indicators, it is 3 in 1: PipsFactoryDaily Click Here PipsFactoryWeekly Click Here PipsFactoryMonthly Click Here
This indicator depends on High and Low price of currency in the (Last day / Last week / Last Month) depends on user input, and then I made some secret equations to draw 10 lines.
Features:
You will know what exactly price you shoul
FREE
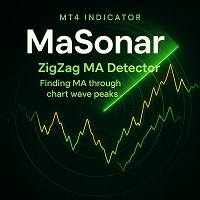
MaSonar is a powerful indicator designed to automatically detect and display the relevant Moving Averages (MA) that align with the peaks of a ZigZag. It quickly searches for the most suitable MA at each ZigZag peak, helping you analyze the market trend and its momentum with ease. Please try the new, even more convenient version of " MaSonic ". Key Features: ZigZag Peak Matching: Automatically identifies and displays the MAs that match the ZigZag peaks. Quick Button Search: Simply press a button
FREE
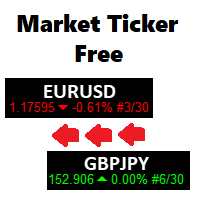
A scrolling Market Ticker that displays price changes from all symbols in the Market Watch list. Provides an easy snapshot of symbol prices, and keeps scrolling automatically while you trade and analyse the chart.
Options include: - MTF, eg choose to show price changes of the daily chart, or the hourly - use the live candle or the recently completed - font and background coloring
FREE

Analyze volatility by clicking on a specific candlestick, which triggers the display of horizontal grid lines centered around the candlestick’s closing price, spaced by multiples of the calculated ATR. A vertical line highlights the selected candlestick, and an optional text label can display the ATR value in pips above the candlestick. The indicator is lightweight, using no buffers, and relies on chart objects for visualization. It includes error handling for invalid candlestick selections and
FREE

OrderCalc opens a window in the chart with the data of your orders:
Position size, stop loss, take profit, profit/loss
Only the positions for this symbol are displayed. If several positions exist, these are totalled and displayed in the last line. If you work with pyramids, you can see at a glance how big the total profit or loss is.
The indicator is invisible at the beginning, only when a position is opened does a window open containing the data for the order. In some cases the content is e
FREE

Everything is very simple here. I have never understood indicators without external parameters. And the Awesome Oscillator is no exception. Now you can customize this indicator to suit your needs and strategies.
Reference: The Awesome Oscillator indicator shows the distance in points between two moving averages (fast and slow).
The AO_Robex indicator has in its parameters a change in the period of moving averages. The default parameters are the same as in the standard indicator.
FREE

My Account Brokers Details This indicator displays the account data and broker terms regarding its operation. For example, broker name, account number, financial leverage, account currency, automatic trading approval, minimum lot, lot step, maximum number of lot, margin call, stop out and many other important data. It is easier to display such data on the chart in one moment with a click of the mouse, than to look for it in the contract or call the broker.
FREE

Индикатор рассчитывает волатильность относительно свечи заданной в настройках, в заданном диапазоне. period -диапазон для расчета максимум минимум. point - номер свечи от которой будет рассчёт (нуль текущая цена). По всем вопросам можно обратиться на сайте через форму обратной связи или в комментариях в ютюб. Также на сайте есть другие работы ссылка в индикаторе на вкладке общее .
FREE
New Release! Hello Everyone! I've just released Acronix, a new bot with live 2025 AND 2026 results. Find more about it here: https://www.mql5.com/en/market/product/201513 .
Introduction and Description The commodity channel index (CCI) is an oscillator originally introduced by Donald Lambert in 1980. Since its introduction, the indicator has grown in popularity and is now a very common tool for traders in identifying cyclical trends not only in commodities but also equities and currencies. The
FREE
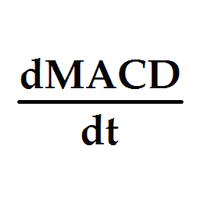
Индикатор выводит первые производные двух MACD. По умолчанию, желтая MACD является более быстрой, чем синяя MACD. В настройках можно задать подходящие вам параметры для каждой из MACD. Одновременное изменение знака производных может являться дополнительным сигналом разворота. Входные параметры
Yellow MACD fast EMA period Yellow MACD slow EMA period Blue MACD fast EMA period Blue MACD slow EMA period
FREE

Индикатор сглаженного Moving Average (xMA)
Входные параметры: xMA Period - период усреднения xMA Method - метод усреднения ( 0-SMA | 1-EMA | 2-SMMA | 3 - LWMA) xMA Price - используемая цена ( 0 - CLOSE | 1 - OPEN | 2 - HIGH | 3 - LOW | 4 - MEDIAN | 5 - TYPICAL | 6 - WEIGHTED) xMA Color - цвет индикаторной линии xMA Width - толщина индикаторной линии
Принцип работы
Индикатор перерассчитывает стандартный технический индикатор Moving Average (дважды усредняет получаемые значения iMA). Период с
FREE
The JagzFX Gap Indicator acts as your vigilant companion, scanning the market with precision and alerting you to the presence of gaps as soon as a new candle is formed. Set your desired gap size, and the indicator will highlight both filled and unfilled gaps, on any symbol and on any timeframe. By analysing the presence of unfilled gaps, you gain valuable insights into market behaviour, allowing for more informed trading decisions. Combine JagzFX Gap Indicator with JagzFX OnePin to create a ma
FREE

RaysFX Trade Info Ciao a tutti, sono entusiasta di presentarvi il nostro ultimo indicatore, RaysFX Trade Info . Questo strumento è stato progettato per fornire informazioni dettagliate sulle vostre operazioni di trading direttamente sul vostro grafico MT4. Caratteristiche principali Informazioni in tempo reale : RaysFX Trade Info fornisce informazioni in tempo reale sulle vostre operazioni aperte e chiuse. Potete vedere il profitto in punti, in valuta e in percentuale. Personalizzabile : L’in
FREE

## Daily SR Navigator: Your Daily Trading Map Navigate the market with precision using the power of the Daily Open Price! Are you tired of manually drawing Support & Resistance (SR) lines every day, only to find them inaccurate? Daily SR Navigator is the smart solution to automate your technical analysis, providing key levels that are relevant and respected by the market, especially for XAUUSD (Gold) . This indicator was born from a unique discovery: a special mathematical formula for projecting
FREE

EUR INDEX
The Currency Index Project is ONE part of a thorough Forex study. Many people do not know the theoretical basis that drives currency exchange rates to move on the market. With this set of tools you will be able to have a more complete view of the entire market by analyzing not only the single currency of an exchange, but all the exchange rates that make up that currency by looking at a single window!
The indicator faithfully represents the real index of a single currency present in a
FREE
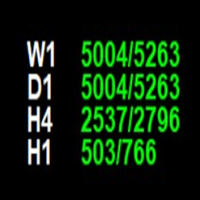
The **Point of Week Indicator** is a powerful MetaTrader 4 indicator that displays point values for multiple timeframes (W1, D1, H4, H1) directly on your chart. It calculates the position of the close price within the candle's range and displays it as a point value, along with the total range of the candle.
## Features
- Displays point values for 4 timeframes: **Weekly (W1), Daily (D1), 4-Hour (H4), and Hourly (H1)** - Shows point value and total range in format: `"point_value/range_value
FREE
The ZoomChart indicator works with two charts - the current chart on which it is launched and the next one. The indicator translates the second chart to the time where the first one is now. Thus, the second chart depicts the same situation on the first chart (where the indicator is launched), but on a different time-frame. In other words, this indicator serves as a magnifying glass or, on the contrary, reduces the chart to display the situation on a larger time-frame.
The ZoomChar indicator au
FREE

This indicator simplifies the process of creating chart templates by allowing you to save your current chart settings to a template with just one click of a button. The indicator adds a button directly to the chart that automatically saves the template with a given name and prefix, making it easy to organize and use templates.
The main functions of the indicator are:
Creating a template of the current chart with a single click on the button. Possibility to specify a prefix for the template na
FREE
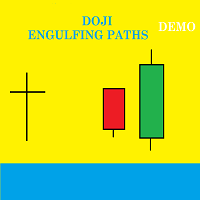
Presentation Doji Engulfing Paths enables to get signals and data about the doji and the engulfing patterns on charts. It makes it possible to get opportunities from trends, and to follow the directional moves to get some profits on the forex and stocks markets. It is a good advantage to take all the appearing opportunities with reversal signals and direct signals in order to obtain some profits on the forex market. With the demo version, only the signals starting with the 20th candle or bar are
FREE

Overview Inspired by Tradingview’s falconCoin, The Market Cipher indicator is a momentum oscillator used to detect overbought/oversold conditions and potential trend reversals. Traders can also use it to spot divergences between price action and momentum for early entry or exit signals. Configuration Guide Core Indicator Settings The indicator calculates momentum using a short-term and a longer-term average. Momentum is plotted as a wave oscillating between overbought and oversold thresholds. Ov
FREE
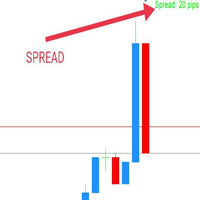
WaSpread MT4 Indicator shows the current spread in pips with color.
* Set the Spread Threshold and the color to identify when the current spread is below or above the Spread Threshold.
* Set X axis and Y axis and chose the Corner and the Anchor to position the Spread Label on the chart.
* Write the font and the font size for more confort.
* Activate alert if the current spread is above the spread threshold.
* For more precision, the user can choose to show the decimal numbers.
* The user
FREE

Multi-Asset Forex Scanner
This indicator allows you to scan multiple assets at once, sending you configurable alerts when any asset touches daily pivot levels 1, 2 or 3.
The original code was just modified to send alerts to MT4 Desktop, MT4 Mobile or Email. (Credits for the original code go to Carlos Oliveira)
In order to receive mobile or Email alerts you must configure Notifications and Email sections in the MT4 platform.
In addition to pivots, this indicator also shows ATR, Volume, RSI,
FREE

Dynamic MA Trend Zone – Dynamic Moving Average Trend Zone
The Dynamic MA Trend Zone is a visually compelling indicator that dynamically tracks changes in market trends. By displaying moving averages on three different price levels (close, high, and low), it creates a color-coded trend zone that clearly indicates the trend’s direction and strength.
Features and Functions:
- Trend Direction Color Coding: The indicator automatically color-codes the trend zones based on whether the candle’s clos
FREE

Индикатор показывает максимальное отклонение от скользящей средней за заданный период. Границы канала могут послужить своего рода зонами перекупленности/перепроданности, от которых может произойти откат цены к центру канала. За этими уровнями и стоит искать дополнительные сигналы для входа в сделку. В настройках индикатора всего 2 параметра - период, за который будет расчитываться индикатор и метод усреднения скользящей средней.
FREE
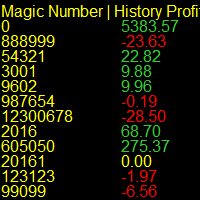
Running multiple EA's on your account and confused by who's winning and who's loosing? Try this indicator that report's in real time on the Magic Numbers in your account by reading the History_trades along with the Open_trades. Note: Manual trades are grouped under Magic Number "0". For a better visual report, run it on a symbol that you don't execute trades on, switch the history bars to "Line Charts" and set it's color to Black.
FREE

Designed to mark a specific price and time point on an MT4 chart based on a single mouse click, synchronizing this data across all timeframes for the same symbol. Its primary purpose is to help traders pinpoint and track critical levels or events (e.g., support/resistance or entry points) with persistent visual markers. The indicator uses dashed lines for price and time crosshairs, accompanied by labels that dynamically adjust to stay within chart boundaries, ensuring clarity regardless of win
FREE

Информационная панель, которая выставляет уровни покупки продажи и цели для профита на текущий день. Уровни рисуются согласно движению валюты за вчерашний день. Панель вмещает в себя информацию о валютной паре, тенденции на рынке, время до закрытия бара, управление капиталом, рекомендуемый лот, профит в пунктах, а также уровни для покупки и продажи инструмента. Для заключения сделок использовать только отложенные ордера на пробой. Входные параметры Lots - установить текущий лот Risk - риск в про
FREE

具有双线信号、双级系统、多时间框架支持、可自定义视觉信号和高度可配置警报系统的高级TSI(真实强度指数)。
自由职业编程服务、更新和其他TrueTL产品可在我的 MQL5主页 获取。
非常欢迎您的反馈和评价!
什么是真实强度指数(TSI)? 真实强度指数(TSI)是由William Blau开发的动量振荡器。它对价格动量(当前收盘价与前收盘价之差)应用双重指数平滑,从而有效过滤市场噪音并揭示潜在趋势方向。 TSI在-100和+100之间振荡,由两条线组成:TSI主线和信号线(TSI的移动平均线)。正值表示看涨动量,负值表示看跌动量。两条线之间的交叉以及穿过高/低水平线的运动是主要的交易信号。 功能特点: 具有双级系统(高位和低位超买/超卖区域)的双线TSI(主线和信号线) 具有三个独立可配置信号缓冲区的视觉信号标记(箭头、垂直线) 高级信号检测:两条线的方向变化、线交叉、水平交叉、峰谷 具有时间范围过滤的可配置警报功能(电子邮件、推送、声音、弹出窗口) 具有插值、多种颜色模式和用于EA集成的iCustom缓冲区访问的多时间框架(MTF) 输入参数: 基本设置: TSI参数: 长周
FREE
MetaTrader市场提供了一个方便,安全的购买MetaTrader平台应用程序的场所。直接从您的程序端免费下载EA交易和指标的试用版在测试策略中进行测试。
在不同模式下测试应用程序来监视性能和为您想要使用MQL5.community支付系统的产品进行付款。
