 MetaTrader 5
 专家
 指标
 程序库
 实用工具
 窗口小部件
 规则
适用于MetaTrader 4的免费EA交易和指标 - 35
 EA交易自动执行市场交易,而指标可使您更准确地分析报价并预测价格行为。
通过这些应用程序,您将能够更明智地在MetaTrader 4执行交易,抓住更多的交易机会。

Мультивалютный советник использует в торговле четыре индикатора, фильтрация ложных сигналов можно выбрать по каждому из индикаторов. Mr Fibo EA - торговая стратегия на основе торговли от уровней. На каждом ретрейсменте предусмотрено построение двух типов расширений и проекций, двух типов временных проекций, а также встроен стрелочный индикатор каналов Дончиана и три индикатора для фильтрации ложных сигналов. Перестроение ретрейсмента осуществляется при пробитии максимума или минимума, а также ур
FREE

Constant Trader 是一款全自动、专业的交易机器人。 专为外汇市场设计的 EURUSD。
EA 不需要配置参数。 准备好处理 EURUSD M30。 您只需要决定拍品的选择。
它有一个智能算法,可以检测趋势,过滤掉市场噪音。 专家根据趋势方向创建订单。
输入和输出订单由可以在任何 MT4 平台上找到的三个指标的组合给出:Bolinger Bands、Standard Deviation 和 Stochastic。
每笔交易都受到止损保护,这在波动性增加的时候带来了资本安全。
EA 在 1 年的 EURUSD 历史数据(2022-2023)中进行了测试。 在使用真钱之前,请先下载并自行测试。
该智能交易针对 EURUSD M30 进行了优化。 每一对都有自己的特点。
推荐: EAMagic - EA 的幻数,它允许顾问仅使用其头寸。 每个图表必须有不同的值。
本EA无需配置参数。
确保您拥有此平价欧元的已下载和可测试历史记录
FREE

The MA ribbon is not a single indicator but rather an overlay of multiple moving averages (typically four to eight or more) of varying lengths plotted on the same price chart. Visual Appearance: The resulting lines create a flowing, ribbon-like pattern across the price chart. Components: Traders can use different types of moving averages, such as Simple Moving Averages (SMA) or Exponential Moving Averages (EMA), and adjust the time periods (e.g., 10, 20, 30, 40, 50, and 60 periods) to suit t
FREE

Triple Brain EA is Your Smart, Safe, Profitable, Martingale, Hedging MT4 Auto Trading Forex Expert Advisor The Triple Brains Expert Advisor (EA), brought to you by GoStart.Biz, is an avant-garde trading tool meticulously crafted to augment your trading arsenal. Featuring a potent mix of sophisticated strategies including martingale recovery, hedging, and multi-dimensional trade management, this EA is tailored to empower the MetaTrader 4 platform users. System Compatibility and Requirements: Des
FREE
该 EA 使用 平均方向指数 (ADX) 指标进行交易。它提供了许多入场策略和灵活的头寸管理设置,以及许多有用的功能,例如可定制的交易时段和鞅模式。 [ 安装指南 | 更新指南 | 故障排除 | 常见问题 | 所有产品 ] 易于使用和监督 它实现了 4 种不同的进入策略 可定制的盈亏平衡、止损、止盈和追踪止损 适用于 ECN/非 ECN 经纪人 适用于 2-3-4-5 位符号 交易可以符合 NFA/FIFO 标准 实现鞅特征 按外汇交易时段过滤交易 内置资金管理 可用的四种进入策略如下,可以单独启用或禁用。 ADX 超过 25 时交易(+DI/-DI 决定方向) ADX 确认的交易分形突破(+DI/-DI 决定方向) 使用 ADX 水平交易 +DI/-DI 交叉 交易+DI/-DI交叉 此外,它还实现了四种不同的资金管理模式: 手动交易手数:EA 将在每笔交易中交易固定手数 自动计算手数:EA 将在每笔交易中承担账户的 % 风险 Martingale:交易失败后,EA 将手数翻倍 逆鞅:交易获胜后,EA 将手数翻倍
输入参数 ADX 设置 - 此参数组包含 ADX 设置。 交易设置
FREE

3 strategies with RSI! Alerts! Signal freshness check! The indicator is based on the classic RSI. I recommend watching my advisor - Night Zen EA It includes 3 strategies: Entry of the RSI indicator into the overbought zone (for buy trades) / oversold (for sell trades) Exit of the RSI indicator from the overbought zone (for sell trades) / oversold (for buy trades) Touching the overbought limit (for sell trades) / oversold (for buy trades) The indicator provides alerts. To enable them in the s
FREE

G2 DASHBOARD PRO by Ida Bagus Putu Mahardika PROFESSIONAL TRADE EXECUTION & MANAGEMENT DASHBOARD G2 Dashboard Pro is a comprehensive trading management tool that revolutionizes how you place and manage orders. No more manual calculations or switching between windows – everything you need is in one interactive, draggable dashboard directly on your chart. KEY ADVANTAGES 1. CHART-BASED PENDING ORDER PLACEMENT Click on the chart to set your entry price visually Support for all order types: Buy
FREE
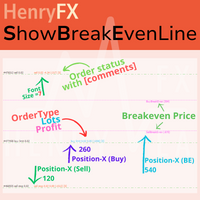
This indicator can help easy to management your order on screen.
FREE Version, included: - " Show Breakeven Price "
Show Breakeven Line Pro : : https://www.mql5.com/en/market/product/58289
Input Parameter: " Label Prefix "
:: [ ] Description; " Position-X-Dis "
:: [ ] Description; " Position-Y-Dis "
:: [ ] Description; " Show Market Price "
:: [ ] Description ; " Price Up Color "
:: [ ] Description; " Price Down Color "
:: [ ] Description ; " Position-Y-D
FREE

VisualRiskTool VisualRiskTool is a professional trade execution panel and risk management utility designed for MetaTrader. It streamlines the process of opening and managing positions by automating complex lot size calculations and providing a visual interface for setting stop-loss and take-profit levels directly on the chart. Core Functionality: Precision Risk Management The primary goal of VisualRiskTool is to eliminate manual calculation errors. By defining a fixed risk percentage (e.g., 0.5%
FREE

VTB High Watermark Drawdown INFO Indicator for MT4 Advanced Account Monitoring & Drawdown Information Dashboard VTB High Watermark Drawdown INFO is a professional account monitoring indicator designed to display drawdown statistics, account performance, and risk management information directly on the chart. This indicator does not interfere with trading activity. It does not open or close positions, modify orders, or block trading. Its sole purpose is to provide a clear and comprehensive account
FREE

Sentinel Pro V is a professional-grade MetaTrader 4 Expert Advisor designed for traders who demand precision and mobility. By combining three layers of RSI and Stochastic analysis with custom trendline tracking, this bot ensures you stay informed of every critical market move via instant Telegram notifications. Key Specialized Features 1. Triple-Level RSI & Stochastic Alerts Unlike standard bots, Version 2 allows you to set three distinct alert zones for both RSI and Stochastic indicators. This
FREE

Sirr Smart AI Express 3 for MT4 EA is an automated and easy to use expert advisor that has the Stochastic indicator working in combination with RSI and MACD filters built in. We have spent a lot of time testing many expert advisors . After years of testing and development, the result is an dynamic EA that is very active with trades and capital management. Our product is also fully compatible with PipFinite Trend Indicator PRO as well. The EA has been designed for trading with the popular symb
FREE

我们只在 MQL 市场上销售产品,如果您看到某处以更便宜的价格转售,那一定是 假冒的。 并且 100% 确定性能不是真实的 .也不会得到我们的支持。我很高兴加入我们的游戏,不要冒险购买 假冒版本 。 允许提升性能 ,购买后请联系我了解如何获得免费版本的指标和每日分析。 升级 4.0 到所有对也很好用。 如果你想提高你的 手动交易技巧 , YOLO是你训练手动交易的好工具,如果你的决定不是太可怕,YOLO会帮助你TP,你就可以开始你的下一个决定了 购买免费版指标后PM我 说明:这里 信号监视器: 这里 与指标的最佳匹配: 这里
YOLO的概念:
您每天都投票,如果您的决定与我通过单击“买入”或“卖出”-> 开始交易在 YOLO 中编码的趋势相匹配! 这是为了长期保护您的帐户(根据我的信号,每月超过 140%) YOLO 是一种安全的鞅策略,但易于在 XAUUSD 和所有货币上使用。也供手动用户使用图表上的面板进行交易。
全自动交易方向与趋势,以防止大幅回撤 交易面板供用户选择方向 所有隐藏的 TP 和隐藏的盈亏平衡价格 移动应用订单控制 (
FREE

Gold Confluence by Bongkah is a manual trading assistant for Gold (XAUUSD) on MetaTrader 4. The product provides a dashboard that combines several technical market conditions into a single visual interface. It is designed to support traders who use their own trading methods, such as Price Action, Support and Resistance, Supply and Demand, trendlines, breakouts, or other technical approaches. The product does not execute trades automatically. Trade entries, exits, Stop Loss, Take Profit, positio
FREE
Indicator "Time to Bar End" (TimeToBarEnd)
This technical indicator is designed to accurately track the time remaining until the current candle closes on the chart. It displays a countdown in minutes:seconds format, which is particularly useful for intraday traders and scalpers who need to know the exact closing time of the current candle. The indicator updates in real-time and offers flexible customization of its appearance. The settings include: choice of position from four chart corners, adj
FREE

This Ea is for the sole purpose of protecting your account.
When the basket of operations present in the terminals reach a set profit in currency terms, the expert will close all trades.
It will replicate the same behavior if the loss limit is reached.
It is a simple but at the same time useful expert advisor for safeguarding the account and always keeping it active.
It can be placed on any time frame or graph, the important thing is that it is inserted only once.
FREE

ADR 10 mostra l'intervallo medio di pips di una coppia Forex, misurato su un numero di 10 giorni . I traders possono utilizzarlo per visualizzare la potenziale azione dei prezzi al di fuori del movimento medio giornaliero.
Quando l'ADR è al di sopra della media, significa che la volatilità giornaliera è superiore al normale, il che implica che la coppia di valute potrebbe estendersi oltre la sua norma.
L'ADR è utile anche per il trading di inversioni intraday. Ad esempio, se una coppia di val
FREE
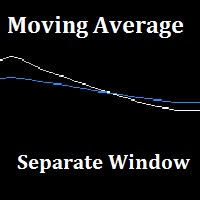
"Separate Moving Average" is a custom indicator made from the combination of 2 moving averages in a different window (the indicator window) for the goal of removing the clutter from the price chart, the indicator also has arrows to show the moving average cross either long or short. All the moving average parameters are customizable from the indicator input window.
FREE
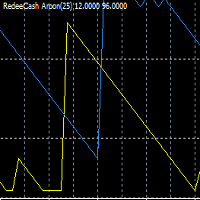
Version History Date Version Changes 07/08/2022 1.00 Initial Release Description The Aroon indicator is a technical indicator that is used to identify trend changes in the price of an asset, as well as the strength of that trend. In essence, the indicator measures the time between highs and the time between lows over a time period. The idea is that strong uptrends will regularly see new highs, and strong downtrends will regularly see new lows. The indicator signals when this is happening, and
FREE

Идея индикатора очень проста и скорее всего пригодится тем, кто используют линейный график для технического анализа. Что-бы устранить "неровности" (-: линейного графика и был написан этот индикатор. Линия графика соединяет цены закрытия свечей, как и в классическом линейном графике, но игнорирует цены, которые шли в направлении линии и новый экстремум возникает только тогда, когда цена закрытия последней свечи явно ниже или выше предыдущего значения. Это облегчает визуальное восприятие при поиск
FREE

Check out other great products from https://www.mql5.com/en/users/augustinekamatu/seller
This indicator is the best so far at determining the currency strength of each pair. It provides stable values and is highly adaptive to market changes. It is a great tool to add to your arsenal to make sure you are on the right side of the trend at all times. No inputs required, it is simple plug and play. A Winning Trading Strategy This article describes the components and logic needed to develop a tra
FREE

I thought I would make the product free! It already generates enough income for me, so there is no point in asking for money for it.
This EA identifies signs of trend strength and looks for corrections as a result of them. Only one trade per time. Each trade includes take profit and stop loss. The Ea does not use averaging, martingale, grid or other high-risk methods. CALM SLEEP - You can rest easy, this EA won't wipe out your deposit. Balance protection: “Calm Sleep” mode, auto lot (margin c
FREE
High, Low, Open, Close — isn't this too much? Sometimes you need a unique history of prices. But if choose one thing, you lose the rest. Smoothing also leads to data loss. Often you lose one of the most important market details: information about extremes. It is due to the preservation of information about the highs and lows, the correct "smoothing" for the history of price is a zigzag. But zigzags also have drawbacks — they do not provide intermediate values. The Price Line indicator solves thi
FREE

Virtual Assistant MINI VIRTUALL ASSISTANT = MAKE YOUR TP AND SL VIRTUAL! Tool meant to control your stop loss and take profit by converting them to virtual SL/TP (with support for TRAILING) Convert all SL and TP to virtual so your exits on trades are hidden from your broker!
Run this EA on any graph, choose 1MIN timeframe (VA is autosaving data only on new bar detected, so graph TF equals to VA autosave period) !!! When using virtual trade exits, stable connection is needed for order executi
FREE

Use this indicator to ensure all your open charts are constantly displaying the same time frame. Change the time frame in any one chart and watch the others instantly change to the same time frame. Also allows scrolling of candles in one chart to be replicated in all other synchronized charts. Analyze correlation between different symbols by linking charts together on the same time frame Display a vertical marker move across all your open charts, so you can quickly compare price action at the sa
FREE

The indicator allows you to trade binary options. The recommended time frame is М1 and the expiration time is 1 minute. The indicator suitable for auto and manual trading. A possible signal is specified as a arrows above/under a candle. You should wait until the candle closes! Arrows are not re-painted Trade sessions: TOKYO section (Half end) and LONDON section (First half) Currency pairs: EUR/USD Working time frame: M1 Expiration time: 1 minute. The indicator also shows good results when using
FREE

The indicator allows you to trade binary options. The recommended time frame is М1 and the expiration time is 1,2,3 minutes. The indicator suitable for auto and manual trading. A possible signal is specified as a arrows above/under a candle. You should wait until the candle closes! Arrows are not re-painted Trade sessions: TOKYO section (Half-end) Currency pairs: USD/JPY Working time frame: M1 Expiration time: 1,2,3 minutes. The indicator also shows good results when using the martingale strateg
FREE
This indicator uses Bollinger Bands lines to detect markets trend. It's a very useful tool for manual trading. Furthermore it is possible to use the indicator with ATR as a filter , as well as the option to pop up an alert when a reverse trend occurs. The readings are very simple to use and understand. Indicator works best on H1 timeframe.
You can to get source code from here .
Parameters BarsCount - How many bars used to show the line. BBperiod - Period of Bollinger Bands. BBdeviations - Devi
FREE

Fractals ST Patterns is a modification of Bill Williams' Fractals indicator. Unlike a standard Fractals indicator, Fractals ST Patterns allows setting any number of bars to find a fractal. This simple indicator corresponds to the parameters specified in the ST Patterns Strategy ( https://stpatterns.com/ ) . Structural Target patterns are the market itself, which is consistently divided into components. For the formation of ST Patterns , no trend lines, geometric proportions of the model itself,
FREE
Простая утилита MQLTA Draw Grid поможет вам нарисовать сетку на вашем графике. Она полезна при изучении графика и моделирования сетки.
Как она работает? Утилита будет создавать горизонтальные линии в зависимости от заданных параметров
Как использовать этот инструмент Установите индикатор на график, выбрав параметры по умолчанию. Выберите начальную точку, значения минимума и максимума диапазона и стиль. В появившейся графической панели вы сможете создавать и удалять сетку, а также изменять неко
FREE

大猩猩通道VZ是在长期观测的基础上修改的通道指标。
信号交易指标既可以作为显示趋势通道的指标,也可以作为输入信号源之一,需要额外的滤波。 通过正确的方法,至少80%的成功交易。
大猩猩通道VZ的主要特点: 分析函数
它可以在任何货币对和时间框架上使用; 指标不重绘; 这是其他指标的一个很好的补充; 图形功能
占据图表上最小数量的位置; 柔性酊剂; 简单易学; 主要特点
打开/关闭警报的能力; 电子邮件警报,以消息和移动通知的形式; 发射大猩猩频道VZ: 启动指示器,调整最佳酊剂。
大猩猩通道VZ设置:
展览及展览
检查条-通道指示器大小(最佳值:150-200); 灵活性-信号调谐(最佳值:5-20); 偏差-通道宽度(最佳值:1.618-3); 中央线-显示中央虚线真/假; Cacl点-信号数(推荐全息触摸); 警报
警报消息-文本警报真/假; 警报声音-声音警报真/假; AlertEmail-发送警报到电子邮件true/false; AlertMobile-向智能手机发送通知真/假; 评论-上角左评论真/假;
FREE

EA Mastermind – The Smart, All-in-One Trading Solution It’s time to stop relying on luck for your trading success.
Meet EA Mastermind — a premium, next-generation trading suite engineered by the BATIK Team , a collective of professionals in market analytics, algorithmic engineering, and intelligent trading design. EA Mastermind isn’t just another Expert Advisor — it’s a revolutionary ecosystem that fuses three intelligent systems into one seamless framework: AI Mastermind Signal Analyzer – deliv
FREE
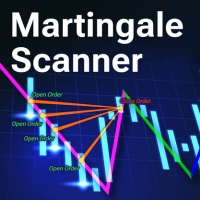
Martingale Scanner: Smart Trade Analysis for Martingale Strategies The Martingale strategy is a high-risk, high-reward approach that requires precise execution and careful risk management. Without the right tools, traders may struggle to analyze market conditions and adjust trade sizes effectively. Martingale Scanner is designed to simplify and optimize this process, providing traders with a structured way to apply the strategy efficiently across different currency pairs. Why Use Martingale Scan
FREE

Trading Keys is an advanced and easy to use risk calclator. Features: Drag and drop visual lines to take profit/stop loss/ entry levels. Risk calculation based on account balance / quity percentage per trade. Profit protection and trailing toggle button Auto break even toggle button Risk calculation for prop firms based on drawdown level How to setup your Trading Keys? Add trading keys to your chart Setup the parameters Save the chart as default template "Default.tpl" How to use Trading keys? C
FREE

This Utility is a tool to manage level of profits or losses for each order without using stop loss or take profit. The Utility applies virtual levels to close orders in profit or loss. You can use the robot to manage manually opened orders or manage orders opened by another EA.
You can to get the source code from here .
Parameters OrdersManage - orders to manage (all orders of all symbols or orders on the current chart). Stop Loss Pips - virtual stop loss level. Take Profit Pips - virtual take
FREE
Советник "Rounding Levels RSI Trade" торгует по индикатору RSI, используя фильтр в качестве круглого ценового уровня, который свеча должна пересечь одновременно с уровнем индикатора RSI. Настройки советника: Индикатор RSI:
RSI_Period = 14; используемый период индикатора
RSI_Shift = 1; номер свечи выбранного графика, с которой советник берет сигнал, 0 -ориентируемся по текущему бару (не рекомендуется) 1 - ориентируется по предыдущему бару и так далее
applied_price = 0; испольщуемая цена
PRICE_C
FREE
The GTAS BSI is an indicator designed to provide the trend direction and buy/sell signals, using combination of momentum indicators. This indicator was created by Bernard Prats Desclaux, proprietary trader and ex-hedge fund manager, founder of E-Winvest.
Description The BSI indicator is represented as a histogram under the price chart. +100 (green) value indicates a bullish trend. -100 (red) value indicates a bearish trend. When the BSI turns to +100 (green), it gives a potential buy signal. Wh
FREE

K线终结者 - 精准把握每一秒的倒计时工具 核心摘要: 还在为不确定当前K线何时结束而焦虑吗?‘K线终结者’是您交易工具箱中不可或缺的利器!它通过一个清晰、直观的倒计时器,实时显示当前活跃K线剩余的精确时间,帮助您避免在K线转换的混乱时刻做出仓促决定,从而更从容地入场、离场或管理订单。 1. 产品概述 “K线终结者”是一款轻量级、高效率辅助指标。它的核心功能是 实时计算并显示当前周期下最后一根K线的剩余时间 。无论您是短线交易者、剥头皮高手还是波段操作者,这款工具都能为您提供至关重要的时间维度信息,让您的交易决策更加精准和自信。 它不仅是一个简单的倒计时器,它是一位无声的交易助手,是您提升交易精准度和专业度的秘密武器。在瞬息万变的市场中,每一秒都至关重要。 2. 主要功能与特点 实时精准倒计时: 在主图表上以清晰的大字体动态显示当前K线剩余的分钟和秒数,让您对时间流逝一目了然。 可定制化显示 :您可以随意将倒计时
FREE

一笔套息交易可以安静地攒三个月的隔夜利息,然后在一周之内被价格波动吃光。
关键不在于隔夜利息有多少,而在于它相对这个品种的波动够不够大。终端里那一列原始数字回答不了这个问题:它们的计价单位不同,合约大小不同,而品种之间的波动幅度更是差着数量级。这些数字之间本来就无法直接比较。
Swap Scanner 把每个品种折算成以存款货币表示的同一个数字,按一手的名义价值年化成百分比,再放到该品种自身的年化波动率旁边。两者相除就是 EFF 一列——你为每一分利息承担了多少价格波动。面板不开仓、不修改、不平仓,也不产生交易信号。
swap 数值会因品种不同而以不同单位公布:点数、基础货币、保证金货币、存款货币、年化利率百分比,或持仓重开时附加的点数。Swap Scanner 读取终端为每个品种报告的计息模式,将各种模式统一归结为以账户货币表示的单一数值,使不同行的数值可以直接相互对照。换算基于 tick 价值与合约大小推导,因此对带有经纪商前缀或后缀的品种同样适用。
面板列说明
- SYMBOL:经纪商提供的品种名称。 - SWAP L 与 SWAP S:多头与空头持仓的每日 swap
FREE
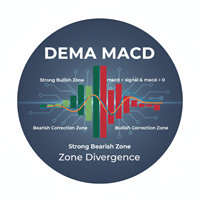
Indicator: The DEMA MACD Zone Divergence This is a powerful, multi-timeframe trend-following indicator based on the Moving Average Convergence Divergence (MACD) , but enhanced using Double Exponential Moving Averages (DEMA) for reduced lag. Its main function is to paint the background of the price chart with color-coded rectangular zones, clearly signaling the current momentum phase and potential shifts in market control (bullish or bearish). Core Purpose To visually map the strength and phas
FREE

该指标在图表上显示圆形水平。 它们也被称为心理、银行或主要参与者级别。 在这些水平上,多头和空头之间存在真正的斗争,许多订单的积累导致波动性增加。 该指标会自动调整到任何工具和时间范围。 当80水平被突破然后测试时,我们买入。当20级被突破然后测试时,我们卖出。目标是00。 注意力。由于强大的支撑 。 和阻力位,价格可能略低于 00 水平。
输入参数 。
Bars Count - 线条长度(以条为单位) 。 Show 00 Levels - 显示或不显示 00 级 。 Show 10, 90 Levels 。 Show 20, 80 Levels 。 Show 30, 70 Levels 。 Show 40, 60 Levels 。 Show 50 Levels 。 N Lines - 限制图表上级别数的参数 。 Distance 00 Levels - 层间距离(自动或手动) 。 Line Position - 图形前面或后面的线 。
Visual Button - 按钮显示(启用/禁用) 。 Corner - 按钮锚定角度
FREE

您是否曾把 MetaTrader 4 的 ADX 与书本或其他平台上的数值做过对比,却发现它们对不上?这是有原因的。MT4 内置的 ADX 使用指数平滑 —— 它并不是 Welles Wilder 发表的那个公式,而且与 MetaTrader 5 不同,MT4 也没有单独的 "ADX Wilder" 可供选择。ADX Live Tuner 解决了这个问题:它是 MetaTrader 4 上教科书式的 Wilder ADX,并在此之上加入了 Live Tuning 实时调参流程。 这是一款完整的三线 ADX(+DI、-DI 和 ADX 线),您可以 直接在图表上实时调整 。图表上会显示一个小面板,带有 ADX 周期和 趋势阈值 的滑块 —— 阈值就是那条区分"趋势"与"震荡"的虚线。拖动任意滑块,指标会立即重新计算并重绘,全过程尽收眼底。到底 20、25 还是 30 才是真正标记您所交易品种可操作趋势的阈值 —— 几秒钟内就能在自己的图表上得出答案,而不必去论坛翻帖子。 真正的 Wilder ADX,而非简单封装。 本指标采用自主的教科书实现:TR、+DM 与 -DM 按周期进行 Wil
FREE

TMA Classic – 三角移动平均指标简介 TMA Classic 是一款非常简洁且轻量的指标,采用 三角移动平均(Triangular Moving Average) 以一条平滑的线条显示。它能够有效滤除过多的噪音,捕捉价格的中心趋势,有助于判断趋势方向及区间震荡。 由于仅显示单线,该指标在图表上具有很高的可视性,不会与其他指标或蜡烛图价格数据发生冲突。 主要特点 实时显示三角移动平均线,平滑且连贯 抗短期噪音干扰,直观展现趋势流动 设计简洁轻便,适合同时监控多个货币对及时间周期 可作为趋势判断的辅助工具,帮助筛选入场时机 计算原理详解 三角移动平均(TMA)是通过对简单移动平均(SMA)进行二次平滑计算得到的。该方法生成的曲线比单一SMA更平滑,有效过滤随机短期波动,更清晰反映价格整体走势。 定义 TMA(n) = SMA( SMA(Close, n), n ) 参数 n:周期(例如20)
Close:收盘价(可根据需要修改)
SMA:简单移动平均 在交易中,价格位于TMA线之上时通常代表上涨趋势,位于下方时代表下跌趋势,可作为趋势方向和强度的参考。 参数设置 参数名 说明
FREE

️ Real Flow Defense Levels:真实流防御水平 Real Flow Defense Levels 指标是一个专有工具,旨在直接在您的主交易图表上识别和绘制 重要、高可信度的价格区域 。它使用动态的、基于成交量的分析,来确定市场先前展示出 最强防御或活动集中 的位置。 这些绘制的线条充当 动态的支撑和阻力位 ,突出显示了主要参与者最有可能进场或捍卫其头寸的价格。与静态的水平线不同,这些水平线会随着时间调整,根据近期的高影响力活动反映出当前的市场结构。 主要特点 动态支撑与阻力 自动识别并绘制多达 四个关键防御水平 ,这些水平曾发生过强烈的成交量活动,标志着市场关注的关键区域。 实时相关性 该指标持续监控最近的交易活动,以确保所绘制的水平线与 当前市场环境保持相关性 。 可配置的权重 包含 可选的加权因子 ,允许交易者强调发生在 一天中特定时间 或具有 更高成交量影响 的水平。 视觉优先级和水平层级 四个水平中的每一个都被分配了独特且可自定义的颜色,以帮助交易者确定其重要性。这些水平根据市场活动强度进行排名: 一级 代表 最强 的防御区域(最高成交量/影响)
FREE

Trends are like the "Saint Graal of traders": it can give you an higher win rate, a better risk to reward ration, an easier position management and so on...
But it is really hard to determine the trend with accuracy, avoiding fase signals, and with the right timing, in order to take massive movements. That's why I created the Trend Validator: a new and EASY tool that will make identifying trend and build new strategy a really easier work.
ANATOMY OF THE SOFTWARE
The indicator is composed by 3
FREE
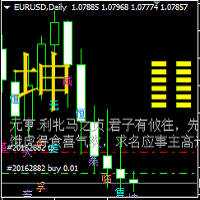
周易易经64卦卦象变化指标
1.卦象指标说明: (1)本64卦卦象变化指标是根据中国古代文化中"易经"哲学的阴阳转化思想,融合金融交易K线图每一蜡烛图K线周期多空相互博弈的结果,用中国最古老的预测编码方法,以易经64卦象的形式,将卦象的每一爻的阴阳和蜡烛K线图的阴阳结合在一起,实时绘制在交易图表的每一根K线图的上下, 以表示未来的K线的走向趋势。 (2)指标在窗口的左上侧只显示当前蜡烛K线所对应的卦名,卦象及卦的预示意义,非当前K线的卦象指标是在K线的每个蜡烛上下标注了对应的卦名。 (3)本指标的重大创新意义:在于突破传统的三根或者两根K线的组合预测,而是用六根K线的组合装成卦象进行多空的预示。通过卦象的变化,交易者一定会得到新的交易灵感. (4)本指标适合所有时间框架.卦名卦象随K线的变化自动更新。
FREE

这是一个标准的布林带指标。 我为它在左下角增加了一个快捷的控制面板,在同时开启多个不同参数的该指标时,控制面板可以快捷开关不同参数的指标,以便于同时结合多个指标观察。 比如可以结合Period为20,Period为30的同时快速切换观察。 参数说明: Indicator ID: 指标的唯一ID。当启动多个实例的时候该ID必须唯一不能重复。 Control Panel Pos X: 指标控制面板的X位置。 Control Panel Pos Y: 指标控制面板的Y位置。 Control Panel Dislpay Name: 指标控制面板显示的文字内容。 Period: 计算布林带中线的平均周期。 Shift: 指标线按图表时间偏移量。 Deviations: 与主线的标准差数 。
FREE

Lossy Mt4 trading expert advisor is rich of parameters that can help you to trade and hit targets it has excellent prediction strategy and many options that serve tp and sl in different shapes like in pips and in money also chart will be shown by arrows and lines and control panel as shown in screenshots you can use for any pair it is multi currency and high quality trend EA
FREE

Индикатор "Trend zone" Помощник трейдеру, показывает на графике текущую тенденцию. Он надеюсь станет незаменимым индикатором в ваше трейдинге. Индикатор не перерисовывается и не меняет свои значения про переключение временных периодов The "Trend zone" indicator is a trader's assistant, shows the current trend on the chart. I hope it will become an indispensable indicator in your trading. The indicator does not redraw and does not change its values about switching time periods
FREE

基于股票软件黄金线指标改编。可根据需要调整参数值。具体使用规则请参考相关股票软件说明。 ////////////////////////////////////////////////////////////////////////////////////////// //股票公式源码如下:
VAR1:=(HIGH+LOW+OPEN+CLOSE)/4;
黄金线:EMA(3*VAR1-2*SMA(VAR1,2,1),13); //////////////////////////////////////////////////////////////////////////////////////////
声明 1 指标计算均基于价格变化而来, 不保证使用此指标的盈利性,作者不对使用此指标的任何损益负责。 2 本指标免费使用。
FREE
Your attention is invited to the indicator Price Action Indicators. It doesn't need settings. And also it is not tied to more than one indicator, which makes it not vulnerable to different accounts or brokers.
Add one setting PERIOD
Regards, Mikhail
Вашему вниманию предлагается индикатор Price Action Indicators. Ему не нужны настройки. А также он не привязан не к одному индикатору, что делает его не уязвимым перед разными счетами или брокерами.
С Уважением Михаил
FREE

Script to create arrows and lines on chart of history positions traded on account for the symbol where you launch the application. From inputs you can select: - Magic number (default is -1; -1 = all magics number) - "From" date and time (default is 1970.01.01 00:00; all positions) - "To" date and time (default is 1970.01.01 00:00; all positions) - Color for buy open positions (arrows and lines between open and close) - Color for buy closing positions (arrows) - Color for sell open positions (arr
FREE

***IMPORTANT: This free indicator works with the paid for Strong Weak Forex Expert Advisor. The EA also depends on the following custom indicators: Strong Weak Parabolic Strong Weak Symbols Strong Weak Values Strong Weak Indicator Download them for free in the Market. The EA will not work without it. These are all custom indicators which the Strong Weak Forex Expert Advisor relies on to generate trading signals. If you have any problems with installation send me a message.
FREE

The panel displays the list of all orders (market and pending) along with their details, including magic numbers and commentaries. The panel can be moved around the chart. For market orders, the profit listed includes the associated commission and swaps. There aren't any important input parameters, but you can control the panel's initial location via them.
FREE
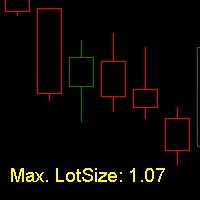
LotSize Indicator Discover the appropriate lot size to use in your trades based on the available margin. This indicator provides valuable information for risk management. If the indicator shows a value of 0, it means that your balance or available margin is insufficient for trading. It is important to maintain adequate margin levels for safe trading practices. This indicator is exclusively designed for the MT4 platform, a popular and reliable trading platform in the market. With the LotSize Indi
FREE
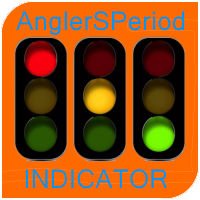
The oscillator indicator " AnglerSPeriod " is one of a series of three calculators of the angular deviation of the price chart of a trading instrument.
INPUT PARAMETER: DRAWs =128 - Number of bars to display the indicator in the chart history; PeriodIND =14 - calculation period of the indicator in the number of bars.
The values of the indicator indicators are degrees . The presence of a Strong price Movement begins with a value of +-45 degrees, and can not exceed +-90 degrees. A Good Trading
FREE

*This is tradingview indicator converted to mql5*
The Trend Magic Indicator is a popular technical analysis tool used to identify the direction of a market trend and potential trend reversals. It is a versatile indicator that can be applied to various financial instruments and timeframes. The Trend Magic Indicator consists of a combination of moving averages and a volatility-based filter. It aims to smooth out price fluctuations and provide a clearer visualization of the underlying trend. Here
FREE
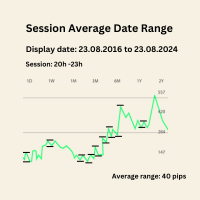
Session Average Date Range: Analyze and average the low - high of specific trading sessions within custom date ranges, offering insights into price movements and market behavior over selected periods. The "Session Average Date Range" tool is an advanced analytical utility designed to empower traders and analysts by allowing them to dissect and evaluate the high and low range of specific trading sessions within a user-defined date range. This tool provides a flexible and precise approach to analy
FREE

Auto Close is an expert advisor that can assist you with your money and risk management rules. The EA can monitor your Balance, Equity, Margin, Global Profit and Global Loss and alert you in case any of these reaches a specified threshold. Free version with limited features can be found https://www.mql5.com/en/market/product/29179
How does it work Load the Auto Close EA in the chart and set the parameters you want to keep monitored. If any of the risk management parameters is met you can be not
FREE
Next Arrival : Flip or Die Trading Arena. Flip a trading account: https://flipordie.com/chapter-1-thirteen-doublings-double-a-trading-account/
Fair Value Gap Scanner 4 is a sophisticated MetaTrader 5 indicator designed to detect fair value gaps (FVGs) in price action and display them as rectangles directly on the chart. This powerful tool empowers traders by providing visual representations of FVGs, enabling them to identify potential trading opportunities with ease and precision. With customi
FREE
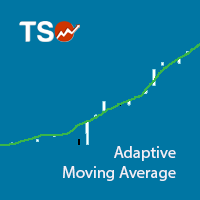
The Adaptive Moving Average (AMA), created by Perry Kaufman, is a moving average variation designed to have low sensitivity to market noise and volatility combined with minimal lag for trend detection. These characteristics make it ideal for identifying the overall market trend, time turning points and filtering price movements. A detailed analysis of the calculations to determine the AMA can be found in MetaTrader 5 Help ( https://www.metatrader5.com/en/terminal/help/indicators/trend_indicators
FREE

Easy Backtest 2 Pro
Easy Backtest 2 Pro is a great FREE alternative testing software!.
You can test your new strategy in Strategy Tester in your MT4 , using all available historical data. Beyond the basic functions such as: BUY, SELL PENDING ORDERS STOP LOSE, TAKE PROFIT AUTO RISK MANAGMANT AUTO LOT SIZE You can modify each of them at any time, exactly like in live trading. Advanced features PRO such as: PREVIOUS DAY'S HIGH/LOW PIVOT POINTS FIBONACCI AUTO TRAILLING STOP AUTO BRE
FREE

Spread Sekanas: The True Cost of Your Trade Stop guessing with pips and points. Start seeing the real , proportional cost of the spread with the Spread Sekanas indicator. The traditional spread, measured in pips, is misleading. A 2-pip spread on EUR/USD is completely different from a 2-pip spread on GBP/JPY or a $2 spread on Gold. This makes it impossible to consistently compare your real trading costs across different instruments. The Spread Sekanas indicator solves this problem by measuring th
FREE

Профессиональный индикатор перекупленности и перепроданности, построенный на основе CCI с EMA-сглаживанием . Индикатор помогает находить потенциальные точки разворота рынка и фильтровать шум стандартного CCI. Индикатор работает в отдельном окне и подходит для любых торговых инструментов и таймфреймов. Основные возможности Сглаженная линия CCI (EMA smoothing) Чёткие уровни перекупленности и перепроданности Стрелочные сигналы BUY / SELL Алгоритм без перерисовки Минимальная нагрузка на терминал
FREE

RSI based trend strategy for GBPUSD EA use both 5 minutes and 15 minutes time frames to find trends. Please use 15m timeframe for best optimization in GBPUSD pair. Inside EA, we have 10 another variables and all of them are optimized for GBPUSD even starting StopLoss, Take Profit and Trailing Stop Loss values. StopLoss = 70 Take Profit = 101 TrailingStop = 36 are best optimized values. You can edit these values if they're not suitable. Invisible variables will be updated every month to mak
FREE

The GU_H1_120114111_S_Pi_CF_0712_SQ3 is an algorithmic trading strategy for MetaTrader, tested on GBPUSD using the H1 timeframe from April 1, 2004, to April 24, 2024. There is no need to set up parameters, all settings are already optimized and fine-tuned.
Recommended broker RoboForex because of EET timezone.
You can find the strategy source code for StrategyQuant at the link: https://quantmonitor.net/gbpusd-pivots-trend-master/
Key details are:
Parameters
Main Chart: Current symbol and
FREE
It is a demo version of Advanced Arrow indicator It works only on GBPJPY but the full version works on all currency pairs.
Features Simply it gives you entry point ,SL line and 4 TP lines or less. Once SL-TP lines are shown with the arrow, they remains as they are until signal change. It is historical indicator. No Repaint.
Indicator parameters Indicator Version : choose V5 or V6. TP 1 Line color : TP1 color. TP 2 Line color : TP2 color. TP 3 Line color : TP3 color. TP 4 Line color : TP4 colo
FREE

What is Macro Kill Boxer? Macro Kill Boxer is a technical analysis indicator developed for the MetaTrader platform. It visualizes market movements during specific time intervals (e.g., Asia, London Open/Close, New York AM/PM) by drawing colored boxes on the chart. Each box represents the high and low price levels within the defined time period, often associated with macroeconomic events or high-volatility sessions. What Does It Do? Time-Based Analysis : Displays price movements as boxes for 58 c
FREE

经过7年的时间,我决定免费发布一些我自己的指标和EA。
如果您觉得它们有用,请 通过五星评级表达支持!您的反馈将继续带来免费工具! 也查看我的其他免费工具 这里
_________________________________ 波林格带宽度指标——高级市场波动性分析工具 在MQL4中精心开发的波林格带宽度指标,是一款先进的工具,旨在提升外汇交易分析的水平。它利用波林格带测量波动性的能力,为交易者提供关于市场动态和潜在交易场景的关键洞见。 喜欢这个免费指标吗?请用五星评价来表示支持!您的反馈是我们提供免费工具的动力! 主要特点: 精准波动性测量 : 计算波林格带宽度(上带 - 下带)/ 中带,准确评估市场波动性。 市场状况洞见 : 识别战略性交易所需的高波动性(潜在突破)和低波动性(市场整合)时期。 全面趋势背景 : 加强对市场趋势的理解,较宽的带表明更大的波动性和潜在趋势强度。 与交易策略集成 ️: 作为各种交易策略的有价值组成部分,尤其是与其他指标结合时,用于细致分析。 使用和信号解读: 设置 ️: 轻松将波林格
FREE

There are time periods in the market, when trading is highly likely to be unprofitable. This indicator warns you about such non-trading situations and helps you preserve your money and time.
Parameters Remind about non-trading periods: Expiration week - remind about the expiration week Consumer index day - remind a day before the release of Consumer index day NON FARM - remind a day before the release of NON FARM Christmas - remind a day before Christmas New Year Days 25.12 - 15.01 - remind abo
FREE
MetaTrader市场是 出售自动交易和技术指标的最好地方。
您只需要以一个有吸引力的设计和良好的描述为MetaTrader平台开发应用程序。我们将为您解释如何在市场发布您的产品将它提供给数以百万计的MetaTrader用户。
