适用于MetaTrader 4的免费EA交易和指标 - 37

SpreadLive shows the full Spread history of a chart with different colors. It alerts you (MT4, E-Mail and Mobile) when the spread reaches the limit, which you can define in the settings. The menu contains Current Spread , Average Spread and Highest Spread of current chart. The main idea is to use it with an EA and analyze negative profits from the spread history. This helps you to see how your broker varies the spread.
Inputs Spread limit - limit to alert. Type - Show in points or pips. Alert:
FREE

MT4 trading tool. Intuitive Dashboard that allows effortless automated trading, saving 99 Strategies , Advanced Money Management , Automatic group orders : Global Take Profit / Stop Loss, Smart TP (Multi-Level, Position Recovery) and Smart SL (Breakeven, trailing Stop, Multi-Level), Exit Manager , Signals, Strength Indicator , ATR Graph, Price Alert, News Warning… # If you have any other requirements or are interested in collaboration, please contact (info@styxia.com)
Get more information
FREE

you can close all your positions in profit or lost when you use this robot. 1.you set your max profit and max lost for all your positions. 2.the robot show you in a window beside your chart. 3.when your equity reach your target close all your positions. 4.you can use one of them or both (profit or lost)togather. 5.this robot close all your positions. ((if you have any idea or want somthing i can help you)) i hope you win in all your times of life. best regard
FREE

GBP Scalper 01 is a simple EA that can work automatically to carry out trading activities. This EA is made simply and requires only Lots, TP, and SL settings to use.
As the name implies, this EA is only suitable for use in trading with the GBPUSD pair, and is designed to work optimally on the H4 time frame.
For novice users the default setting of GBP Scalper 01 is enough to get optimal settings for EA.
FREE

PanelTool Button Click trading (Replace Default Trade Panel)
Features
01. Button Click open or close Long positions
02. Button Click open or close Short positions
03. Set Lot sizes
04. Set SL or TP points
05. Set order's commentment
06. Show BreakEven price
07. Show Long or Short Lots
08. Show Profit or Loss USD
09. Show Daily Profit or Loss USD
10. Set ID=0 to handle manual orders together
FREE

This Expert Advisor is our latest trading system and it is designed to work with EURUSD and GBPUSD . This EA produces good results with medium spreads. It opens a market order following the market trend and then it opens Market Orders with different amount of lots to close all orders or single order in profit with small amounts. To close trades, it uses a cumulated closing function or a closing function for each trade opened. It works with all time frames, better with lower TF, and you can us
FREE

I present you the Abella Expert Advisor. The "London breakout" occurs in the European session. During this time, Abella follows the market and enters in one of the direction according to the identified Price Action patterns. The EA works both during a flat and trend. This EA has been created for multicurrency trading. Do not Abella on one pair. For optimal performance, use 4 pairs: AUDUSD, USDJPY, EURJPY, GBPUSD (the H1 timeframe) and create a portfolio.
Parameters Lot - fixed lot; Risk - dyna
FREE

NostradamusMT4 - мощный индикатор из набора профессионального трейдера. В основе индикатора лежит авторский метод Андрея Спиридонова расчета цены (ESTIMATED PRICE) для текущей цены свечи. Данный индикатор является самостоятельной торговой системой. Индикатор подходит для работы на классическом рынке и рынке бинарных опционов.
Преимущества
Индикатор не перерисовывается; Работает на любых временных интервалах; Работает с любыми торговыми инструментами; Отлично подходит для скальпинга и торговли
FREE

Project iCap
This EA can act in 3 different ways View Live Account results of this EA
1. Fully auto trader
Once you set "Self Start" parameter to "On", the EA will auto start trading without human intervention. As a regular EA. For this EA to open trades, it uses a trend following mechanism. You can run this EA in 1 minute time frame and the EA is stable even during the times of news releases. EA will trade only upon candle closing. Not with tick data. Note : This EA is using Grid and Marti
FREE

Divergence Reader - индикатор который поможет Вам идентифицировать на графике дивергенцию и конвергенцию.
Настройки Type - выбор типа сигнала (дивергенция, конвергенция, оба сигнала); Minimum length of divergence (Candle) - минимальная длинна сигнала (в свечах); MACD SETTINGS - настройки индикатора МАСD; Важно! Индикатор не рисует графику на истории! Для визуальной проверки индикатора рекоммендую использовать тестер.
FREE

The relative strength index ( RSI ) is a technical indicator used in the analysis of financial markets . It is intended to chart the current and historical strength or weakness of a stock or market based on the closing prices of a recent trading period. The indicator should not be confused with relative strength . The RSI is classified as a momentum oscillator , measuring the velocity and magnitude of price movements. Momentum is the rate of the rise or fall in price. The RSI c
FREE

Hello everyone,
Today I want to share with you a strategy who is designed especially on EURUSD timeframe M5 .
Pikachu is a sclaper who is not spread sensitive . Pikachu is very easy to use . Pikachu is using a dangerous strategy .
Why it's free? Pikachu is using a dangerous strategy : the expert will multiply by 2 the lot for each loss trade until a trade close with profit. To see another product with another strategy click on the link : https://www.mql5.com/en/users/c
FREE

“Circle Rising Point” 是一款基于 周期论 的指标,不论您的交易周期是短周期还是长周期,您都可以通过这款指标 寻找不同周期,不同波段的起涨点和起跌点 ,因此在不同周期图表上,展现给您的信号都是不同的,适用于 左侧交易 。 这款指标建议搭配多周期窗口配合使用分析。 指标介绍 适用产品 这款指标适用于任何交易品种, 外汇、加密货币、贵金属、股票、指数。 适用周期 Circle Rising Point 指标适用于所有时间帧 - 从分钟 (M1) 到日线 (D1)。 适用人群 有一定基础的交易者和专家级交易者。
最大盈利潜力
Circle Rising Point指标的入场信号通常出现在不同波段下跌趋势快结束的时候,即使在入场信号出现后继续下跌,也不会有很大的跌幅, 从而最大限度地降低风险,并增加盈利。 多语言支持 指标面板将自动以您的语言显示。 视觉和声音警报 您不会错过信号,因为每个信号都显示在屏幕上,并带有声音通知。 操作便利 您只需要在设置面板根据您的喜欢设置交易信号的颜色即可。
如何使用Circle Rising Point指标进行交易?
订
FREE
The utility is designed for placing pending orders Buy Stop, Sell Stop, Buy Limit, Sell Limit with predefined values for each type of orders, number 0 ... 15, distance from current price, Lot, Take Profit, Stop Loss, Magic. Expose and delete by pressing the hot key. How to place and delete orders by voice using the utilities of this type, see the video below the description. https://www.youtube.com/channel/UCTpVWJkEic6TzoXr0qc9RIw/featured Key "A" sends a request for placing orders Buy Stop. Ke
FREE

Abiroid Multi Slope indicator allows you to calculate a Slope Histogram for any line of any indicator . Histogram is for 1 slope line only, but slope values can be calculated for 3 lines total. To have multiple histograms, add as many Slope indicators for custom indicators as you like on chart. You just need to provide the Indicator name, buffer value, slope's period and max number of bars back. By default it has slope calculation for TDI_v4.ex4 indicator. There is no way to specify parameters f
FREE
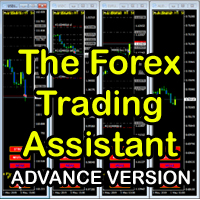
The Forex Trading Assistant is a trading utility that speeds up our execution of orders. The lot size is automatically computed based on the risk-on-balance you set in the input window. The pip value will be based on your risk-on-balance. Hence, the total stoploss is the actual risk computed based on your risk-on-balance per trade. Morever, you can drag your Order Line, Stoploss Line, and Takeprofit Line just like dragging a horizontal line on your chart. The following are the inputs. ( Click D
FREE

The indicator works as an extension that recolors the candles and the background in the terminal at the click of a button (Night Theme / Day Theme). The user can also set the display of the watermark of the symbol, and specify its size. The interactive menu allows you to toggle the display of the Ask value. And switch chart scaling from adaptive to fixed with one click.
You can add your favorite color to the settings for switching.
FREE

As the title says, this is an indicator that shows the current open market (session). It has 4 sessions with customizable schedule : 1. London session, 2. New York session, 3. Sydney session, 4. Tokyo session.
Indicator inputs: - The color of each session. - The open time and close time of the sessions. - The line width.
The objective of the indicator, is to follow each sessions, observe at what times are multiple sessions open, and thus take the chance of the high market movements.
FREE

Useful indicator that incorporates three moving averages, for your favorite trading strategy. Moving averages are fully configurable, Period, Method, Color, Etc Just place it on your favorite timeframe.
The benefits you get : Never redesigns, does not retreat, never recalculates. Works on forex and CFD, timeframe from M1 to Monthly. Easy to use. Convenience for your trading.
FREE

Bamboo expert 4 is based on the custom indicator Bamboo 4 . Entry points are determined using Bamboo 4 values. Positions are closed when reaching specified profit and loss levels or when opposite signal appears if Stop Loss and Take Profit values are zero. Input Parameters Period - Period parameter of the indicator Bamboo 4; Mode - operation mode of the Expert Advisor (0-7); Stop Loss - loss fixing level in points; Take Profit - profit fixing levels in points; Lot - lot size; Magic Number - "mag
FREE

The DrawStopLevel script is designed for the MetaTrader 4 (MT4) trading platform. This script allows traders to quickly and easily draw a stop-loss horizontal line on their trading chart. This script is used in conjunction with the Trade Entry Journal Utility ( https://www.mql5.com/en/market/product/ . This script can also be easily integrated into any MT4 trading strategy, allowing for quick visual representation of stop-loss levels.
FREE
pappye indicator uses bolinger band to trigger it's signal ,it contain's pappye animation for alerting trading signals this alert is not continuous for the same arrow it will played 2 times only it could be used for any pair any time frame personally i prefer to inter a trade when there is to consecutive arrow in horizontal level after a breakout drift in a price but you could choose your way after trying the demo copy on your terminal
parameters fast : fast bolinger period slow : slow boli
FREE

Tool converted from tradingview. A simple indicator that plots difference between 2 moving averages and depicts convergance/divergance in color coded format.
Anything <= 0 is red and shows a bearish trend whereas > 0 is green and shows bullish trend.
Adjust the input parameters as following for your preferred time frame :
4-Hr: Exponential, 15, 30
Daily: Exponential, 10, 20
Weekly: Exponential, 5, 10
FREE
The JagzFX Gap Indicator acts as your vigilant companion, scanning the market with precision and alerting you to the presence of gaps as soon as a new candle is formed. Set your desired gap size, and the indicator will highlight both filled and unfilled gaps, on any symbol and on any timeframe. By analysing the presence of unfilled gaps, you gain valuable insights into market behaviour, allowing for more informed trading decisions. Combine JagzFX Gap Indicator with JagzFX OnePin to create a ma
FREE

This is a simple and free Expert Advisor that trades candlesticks. It compares several nearest bars and their volumes, and opens a trade based on that data. Unlike the professional version , it analyzes only 1 timeframe. The recommended timeframes for this EA are H1, H4, D1, it works with any currency pairs. The parameters always need to be optimized before trading, as well as after some period of trading.
Input Parameters Lots - lot size (if Lots=0, then the lot will be calculated based on th
FREE

AR Canada is a fully automated trading robot optimized for USDCAD H1. This free version trades only a fixed lot with minimum volumes. No hedging, no martingale, no grid, no arbitrage, etc. The EA applies the trading algorithm based on crossing the moving averages. Take Profit and Stop Loss values are fixed and have a ratio of 1:4. Positions are closed by the EA when Take Profit or Stop Loss level is reached.
Parameters MagicNumber = 3 - unique EA magic number.
FREE

这个指标可以用来衡量货币对的相对强弱。用户可以选择一个基础货币并以此为比较的标准去评价其他货币的相对强弱。相对较强的货币分值较高,相对较弱的货币分值较低。中间的50分值的水平线是基础货币分值。 指标的设置选项: Strength Period - 更改Strength Period(力度计算周期)会影响到计算的蜡烛数量,从而影响计算结果。较高的值让指标表示的线条较为平滑,而且指标的结果会表现出各个货币更长时间里的相对强度,而不是最近的强度。 Threshold of Belt Width - 你可以设置一个门槛值,用于高亮显示扩张的货币带 (货币带是本指标载入后会视觉呈现出来的)。本选项当 "Hightlight Expanding Belt" 设置为true时有效。 Hightlight Expanding Belt - 当货币带扩张时,强弱货币之间会具有较大的强弱差,当其差值大于门槛值时会被高亮显示。当货币带扩张时,最强和最弱的货币互相搭配的货币对可能在图表上表现较大的波动。 Base Currency Options - 选择一种基础货币作为衡量的参照。(USD/CHF/NZD)
FREE

It is a very simple and useful micro indicator. Shows the current ask price, and the maximum relative ask price up to the current moment, on the chart, in the first N candles. It facilitates quick decision making by offering a visual reference. Likewise, when we position ourselves with the cursor over it, it shows us the maximum spread since the indicator is applied, until the current moment. It is perfect for scalping . By default, the parameter N has the value 4.
Especially recommended ind
FREE

Бесплатная версия советника HourGlass ! ВНИМАНИЕ! установите Minimum lot 0.01 Советник HourGlass FREE — это безиндикаторный, мультивалютный робот, принцип работы которого является выставление сеток ордеров. Ставится ордер и в случае движения цены в противоположном направлении, выставляется серия ордеров с фиксированным расстоянием между ордерами. Советник ждёт откат цены, при котором закрывает серию ордеров с профитом, и цикл повторяется. Советник торгует сетками одновременно в двух направлени
FREE

Handle orders for different magic -1 for all magic, 0 for manual orders, 1-XXXXXX for EAs For example, if you want to control orders from EA with magic 3333, your manual orders, type 0;3333 Close on exact time, example. close order every XX:15 --> Close all on 00:15, Close all on 11:15, Close all on 12:15... Close on Loss, close the loss for single order, close the loss for the whole magic number.
Parameters Description (-1 for all magic)(0 for manual orders)
List of the magic to check - 0;1
FREE
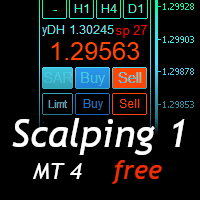
Scalping Day Trading Support Utility Scalping One MT4 free
One position is displayed with one button. View P & L, Lot, and Point in real time. It is possible to switch the display of positions of only chart currencies and all currency pairs. (The free version has only 3 positions) Supports automatic identification in Japanese and English Account currency notation corresponds to dollar, euro, pound, yen (automatic identification) The timeline drawing function can be linked with the clock dis
FREE

FREE

分析整個市場所有符號的利潤可能性的簡單腳本。 您可以指定每個期間的最小和最大利潤百分比和步驟數。 腳本會根據您的配置找到最有趣的符號。
您將獲得對整個市場的快速和當前分析,這可以幫助您做出正確的交易選擇,您再也不會錯過機會。
分析整個市場所有符號的利潤可能性的簡單腳本。 您可以指定每個期間的最小和最大利潤百分比和步驟數。 腳本會根據您的配置找到最有趣的符號。
您將獲得對整個市場的快速和當前分析,這可以幫助您做出正確的交易選擇,您再也不會錯過機會。
分析整個市場所有符號的利潤可能性的簡單腳本。 您可以指定每個期間的最小和最大利潤百分比和步驟數。 腳本會根據您的配置找到最有趣的符號。
您將獲得對整個市場的快速和當前分析,這可以幫助您做出正確的交易選擇,您再也不會錯過機會。
FREE
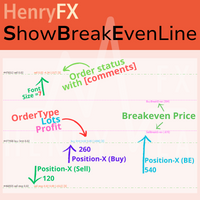
This indicator can help easy to management your order on screen.
FREE Version, included: - " Show Breakeven Price "
Show Breakeven Line Pro : : https://www.mql5.com/en/market/product/58289
Input Parameter: " Label Prefix "
:: [ ] Description; " Position-X-Dis "
:: [ ] Description; " Position-Y-Dis "
:: [ ] Description; " Show Market Price "
:: [ ] Description ; " Price Up Color "
:: [ ] Description; " Price Down Color "
:: [ ] Description ; " Pos
FREE

If you are boring in repeatedly changing of trading symbol in every charts when use multiple charts to analyzing prices or trading. This indicator can help you. It will change the symbol of any other charts in the terminal to the same as in the chart you have attached this indicator to it whenever you add new symbol to the chart or click on the button. After finished the job it will sleep quietly waiting for new occasion in order to minimize resource usage of the computor.
FREE

Velvet RSI is intended for use with the Velvet advanced ordering layer. It is a modified version of the RSI indicator provided by Metaquotes and all of the data it displays is accurate and verified, when it is detected by the ordering layer. In order to place orders with the Velvet RSI indicator, the ordering layer must be installed and running. Ordering from the Velvet RSI indicator requires that "Velvet Ordering Layer" ( found here ), version 1.0 or higher, be installed and running. When de
FREE
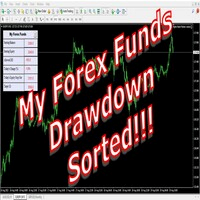
The world of prop firm trading is one filled with tension and excitement in equal measure, and My Forex Funds is on the forefront of bring that world to regular traders. On one hand is the prospect of making huge sums of money and on the other, losing all the money you have invested. The easiest way of the latter scenario occurring is drawdown , and more often than not daily drawdown . It's what keeps us constantly checking our phones, the pain of every traders existence.
What if there
FREE

High, Low, Open, Close — isn't this too much? Sometimes you need a unique history of prices. But if choose one thing, you lose the rest. Smoothing also leads to data loss. Often you lose one of the most important market details: information about extremes. It is due to the preservation of information about the highs and lows, the correct "smoothing" for the history of price is a zigzag. But zigzags also have drawbacks — they do not provide intermediate values. The Price Line indicator solves thi
FREE

Angle of Price It is a trend following indicator. The idea behind this indicator is very simple. it calculates the angle of certain price type with its N candle back price type. When the price is moving toward upward direction positive angle histograms will be created and vice versa for downward direction. There are couple of price type supported in this indicator. Which is as follows Close Open High Low Median Typical Weighted When combined with other indicators it could be used as a very power
FREE

BillWill 该指标基于取自书中的材料:Bill Williams。交易混乱。最大化利润的专家技术。 每个柱形顶部的指标读数是根据开盘价和收盘价相对于柱形三分之一处的位置计算的。小节分为三个部分,小节的下三分之一是三号 (3),小节的中间三分之一是二号 (2),小节的上三分之一是一号 (1)。指标读数中的第一个数字是开盘价相对于柱的三分之一的位置,第二个数字是收盘价相对于柱的三分之一的位置。 每个柱形底部的指标读数计算为柱形中间相对于前一个柱形极值的位置。
指标读数定义 1-1 开盘价和收盘价位于柱线的上三分之一 2-2 开盘价和收盘价位于柱线的中间三分之一 3-3 开盘价和收盘价位于柱线的下三分之一 3-1 开盘价在柱的下三分之一处,收盘价在柱的上三分之一处 2-1 开盘价在柱的中间三分之一,收盘价在柱的上三分之一 3-2 开盘价在柱线的下三分之一处,收盘价在柱线的中间三分之一处 1-3 开盘价在柱的上三分之一,收盘价在柱的下三分之一 2-3 开盘价在柱的中间三分之一,收盘价在柱的下三分之一 1-2 开盘价在柱的上三分之一,收盘价在柱的中间三分之一 “+”(加号)标记中间
FREE
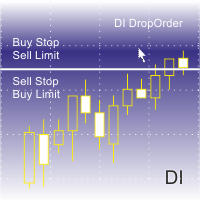
This is a script for quick and easy placement of orders (Buy Stop, Sell Stop, Buy Limit, Sell Limit) to the user's choice. Simply drop the script on a chart part where you want to place the selected order. You can also set the automatic calculation of the lot size for the position, depending on the risk as a percentage. Also, you can use the script as a supplement to your trading strategy, since it is possible to specify a magic number. Features Fast placing of a required order (Buy Stop, Sell S
FREE
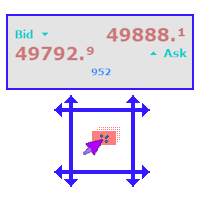
A simple and functional Current Price Panel, which shows magnified Bid, Ask and spread price and can be moved by using the mouse, to any location of the chart window. The functionality included are: Customize Current Price Panel Contents shown on Panel Width and Height, Row and Column gap. Background color, background transparency and border color. Font, its size and color. Move the panel to any location of chart window. Option to show current spread as pips or points. Highlight spread in diffe
FREE

Free version of https://www.mql5.com/en/market/product/44606 Simple indicator to calculate profit on fibonacci retracement levels with fixed lot size, or calculate lot size on fibonacci levels with fixed profit. Add to chart and move trend line to set the fibonacci retracement levels. Works similar as default fibonacci retracement line study in Metatrader. Inputs Fixed - select what value will be fix, lot or profit (available in full version, lot is set on free version) Fixed value - value t
FREE
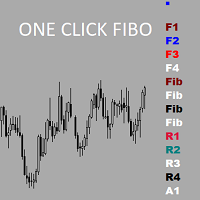
Утилита предназначена для упрощения графического анализа.Настроив один раз , можно сохранить в шаблон,все настройки сохранятся.В настройках меняются уровни фибоначчи , цвета,стили и толщина линий также текстовые метки на кнопках.Есть возможность расширить функционал , добавить временные зоны Фибоначчи ,Фибо арки ,линии по углу ,продление прямоугольных зон до текущей цены.Присылайте рекомендации,все можно осуществить в рамках бесплатной утилиты.
FREE

The TLR indicator is a market trend identification indicator. The idea behind this indicator is to use 3 linear regression lines, one short-term, one medium-term, and one long-term. The UPTREND will be determined when: The long-term linear regression line and the medium-term linear regression line have an uptrend. The long-term linear regression line has an uptrend, the medium-term linear regression line has a sideway, and the short-term linear regression line has an uptrend. The DOWNTREND will
FREE

Support and Resistance Levels Arrow Indicator please leave 5 stars to me A support level is a level where the price tends to find support as it falls. This means that the price is more likely to "bounce" off this level rather than break through it. However, once the price has breached this level, by an amount exceeding some noise, it is likely to continue falling until meeting another support level. A resistance level is the opposite of a support level. It is where the price tends to find re
FREE

此智能交易系統 (EA) 就像一個高收益儲蓄賬戶,因為交易將發生在支付(賺取)隔夜利息的貨幣對上。進入和退出頭寸分別基於買入和賣出訂單的最低/最高和最高/最低價格的回溯期。
公共輸入,
SINGLE_CURRENCY = true,允許對單一貨幣進行操作,當禁用 (FALSE) 時,將交易在 metatrader 的市場觀察窗口中選擇的貨幣。
CONCURRENT_ORDERS=0,限制多個訂單同時開倉的數量。
PIPS=100,盈利PIPS
MAX_PIPS=1000,最高點和最低點與賣價和買價之間的最大 PIPS 距離。
MAX_LOTS=100,您的交易賬戶允許的最大手數。
DODDFRANK_COMPLIANCE=false,如果在美國賬戶上交易,您需要啟用 FIFO 以防止接收 FIFO 違規?
LOTS=-1,當 LOTs 參數小於零(或負數)時,使用基於每 100 美元賬戶淨值 0.01 手(非餘額)的內部算法計算手數。如果賬戶貨幣不是美元,則賬戶淨值轉換為美元進行計算(v1.31) MAX_AUTOLOTS_TRADE=2,使用自動手數
FREE

This is the countdown of the last candle Indicator. How much time remains in the current candle of your chart CTime display exactly how many hours, minutes and seconds remain before the current candle closes, and a new one opens. This allows you to be on the ball as soon as the next candle appears It could be useful for a trader who trades with candles as the main attention Available option to change the text color to suit the chart background. This Indicator is related to the system here .
FREE
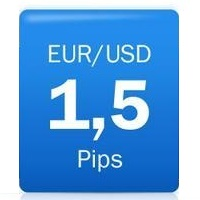
Displays current spread in the main window of the chart. Indicator Setting: BigDisplay =true or false to switch on and off.
DisplaySize = 20 is default
DisplayColor = Blue
Display_y = 550 position: staring position Y of background panel
Display_x = 1200 position: staring position X of background panel
Author: Happy Forex (Expert Advisor - your algorithm-driven profit, without stress or work)
FREE

Implied Trader is a fully automatic, professional trading robot designed specifically for the foreign exchange market AUDCAD M30 timeframe. Parameter configuration is not necessary for EA. Only the size of the lot you intend to use needs to be chosen. 0.1 is the suggested lot size for a $2000 account. You can raise the lot size correspondingly if your account has more money. It has an intelligent algorithm that recognizes the trend. On the basis of the trend direction, the expert places orde
FREE
The purpose of this new version of the MT4 standard indicator provided in your platform is to display in a sub-window multiple timeframes of the same indicator. See the example shown in the picture below. But the display isn’t like a simple MTF indicator. This is the real display of the indicator on its timeframe. Here's the options available in the FFx indicator: Select the timeframes to be displayed (M1 to Monthly) Define the width (number of bars) for each timeframe box Alert pop up/sound/ema
FREE

The indicator is based on two Moving Averages. Its only difference from traditional indicators is that it is presented as a histogram. The histogram has four colors; each color represents a MA with its own period. In case of a descending trend, if a price is lower than a moving average, the indicator displays a value lower than the red zero level. In case of ascending trend, the indicator value is higher than the green zero level. Parameters: Period MA 1 - Period of the first moving average. MA
FREE

This indicator is based on the MACD indicator
Also, some candlestick patterns are used in it to identify better signals
Can be used in all symbols
Can be used in all time frames
Easy to use method
Adequate settings
Settings: period: The number of candles used to calculate signals. pFast: Like the MACD indicator settings pSlow: Like the MACD indicator settings
alarmShow: If you want to receive an alert in Metatrader after receiving the signal, enable this setting alarmShowNoti: If you
FREE
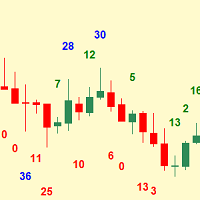
Simplest indicator for bar shadows. Very useful for Kangaroo Tail strategy.
"Shadows" - this is the distance from high and close of the bull bar and low and close of the bear bar. The purpose of the shadow is to show you if the bar is strong or not. Whether it is internal to the trend or is external. It even helps determine if a trend is starting. Input arguments: How many prevoius bars to calculate Value that should be passed to trigger the alarm How many times to repeat the alarm (Put 0 if y
FREE
The oscillator indicator " JAngleR " is one of a series of three calculators of the angular deviation of the price chart of a trading instrument.
INPUT PARAMETER: DRAWs =128 - Number of bars to display the indicator in the chart history; Period_IND =14 - calculation period of the indicator in the number of bars; ma_period =1 - Moving Average Period; ma_method =MODE_SMA - moving Method; applied_price =PRICE_CLOSE - applied Moving Average Price. The values of the indicator indicators are degree
FREE

<LOGIC> EA will place order based on the original logic. This EA should work with take profit and stoploss. Default TP is 50pips and SL is 50pips.
If the order was closed with stoploss, EA will stop in that day. Next day, EA will restart and trade again with lot size increasing. Lot size and volume multiple is changeable in the parameters.
<Best Pair and TF> EURUSD and GBPUSD TF H1
<Default set> Already optimized
TP 50pips SL 50pips Martingale Volume muti X 2 Max martingale 5
FREE

智能趋势线提示, 专业趋势线, 支撑线和阻力线提示
特点: 自动与点击模式,可将任意新绘制的线转换为提示线 (趋势线或水平线); 在较高时间帧内隐藏来自低时间帧的线,避免在图表上显示过多不同时间帧的线,从而造成混乱; 自动切换时间帧,当在较低时间帧里点击较高时间帧的线时; 自动展平水平线,如果用户使用趋势线来绘制支撑或阻力线; 自动支撑至阻力反转,反之亦然; 自动线颜色, 描述, 线形和宽度设置; 当价格触及某条线,则该线闪烁 (直到用户在图表上点击关闭); 当触及某线,该图表自动置上; 连声提示,夜间和日间模式声音类型 (直到用户在图表上点击关闭); 单声提示并弹出消息框; 移动通知; 邮件通知; 图表上的控制台; 自动隐藏控制板; 图表剪裁.
如何使用: 加载指标至图表; 控制台将出现在图表上; 使用 MetaTrader 趋势线或水平线工具,在您希望的价位绘制一条线; 如果自动模式启用, 新的线将被自动转换为提示线, 如果点击模式启用, 新线在点击后转换为提示线。
当价格触及支撑或阻力线,将会发生什么: 指标将图表带到其它图表的上面; 指标将切换到该线所属的时间帧;
FREE

The indicator shows support and resistance levels as horizontal lines. It shows the highs and lows of former days, weeks and month in every chart.
How to work with support and resistance levels show the EA Limit Scalper and the Universal Moving Average Expert Advisor (UniMA EA) .
When the tip of the coursor is on a line (mouseover) it shows the real value of the level and which high or low is shown, see explanation below.
The indicator must be installed like an expert advisor ! To
FREE
This is a medium-term conservative system. It tracks quote movements and defines entry points. The Expert Advisor is completely automated and features the unique algorithm. This demo version trades USDJPY.
Features It does not use Martingale; No grid; No scalping; No excessive parameters; Fixed lot; No complicated settings. Trades are usually opened infrequently. Orders may remain open for a few days for obtaining greater profit. Amount of trades per month is from 5 to 20. Deals are closed by
FREE

The Moving Average Slope (MAS) subtracts the moving average level n-periods ago from the current moving average level. This way, the trend of the moving average can be drawn on the moving average line.
Features Observe uptrends and downtrends at a glance. The indicator is non-repainting. Returns buffer values for the trend of the moving average to be used as part of an EA. (see below)
Inputs Moving Average Period : The period of the moving average (MA). Slope Period : Number of periods betwe
FREE

CHF INDEX
The Currency Index Project is ONE part of a thorough Forex study. Many people do not know the theoretical basis that drives currency exchange rates to move on the market. With this set of tools you will be able to have a more complete view of the entire market by analyzing not only the single currency of an exchange, but all the exchange rates that make up that currency by looking at a single window!
The indicator faithfully represents the real index of a single currency present in
FREE

Features This EA uses Moving Average technical. This EA specializes in GBPJPY, so we recommend you apply it to that chart. Please apply this EA to the 15 minute chart. This EA is easy to manage because it has a maximum of 1 position. The maximum profit is set at 0 pips(Unlimited). The maximum loss cut is set at 80pips. You can add an EA position by pressing the add button. This EA is highly reliable because it is optimized using TICKDATA.
Parameters -----Basic parameter----- magic - Please set
FREE

This adviser trades by volume, analyzing candles. It is a free version of Volume candlex master . Differences from the paid ones are that there are not some functions here: working on 2 timeframes, using Moving average, dynamic stop-loss and take-profit, and also the maximum lot is limited (no more than 0.10). Recommended timeframes: M5, M15, M30. Before trading, optimize the parameters of the advisor for your account. Input parameters Lots - lot size; MaxSpread - the maximum spread for the op
FREE

Break Average Free Break average is a fully automated Expert Advisor for automatic trading on EURUSD, which uses the strategy of breaking the average. It can work with small deposits of $ 250 and a small leverage of 1: 30. To enter the market, filters of two indicators are used (such as the stochastic and the moving average of 2 periods), which confirms the entry to the market. Very good offer to try the full version only 50 USD Differences from full version : 1. Opens only SELL positio
FREE
Highly configurable Rate of Change (ROC) indicator. Features: Highly customizable alert functions (at levels, crosses, direction changes via email, push, sound, popup) Multi timeframe ability Color customization (at levels, crosses, direction changes) Linear interpolation and histogram mode options Works on strategy tester in multi timeframe mode (at weekend without ticks also) Adjustable Levels Parameters:
ROC Timeframe: You can set the current or a higher timeframes for ROC. ROC Bar Shift:
FREE

Easy Backtest
Backtesting your trading strategy is the most important thing which every successful trader knows very well. Easy Backtest is the perfect solution to test your new strategy in Strategy Tester in your MT4 , using all available historical data. You can place orders: BUY , SELL , pending orders with Stop Loss and Take Profit , and you can modify them at any time. You can close orders individually or all at once, and also breakeven the same like you do it in live trading. The play
FREE

This indicator applies the biquad high pass filter to the price-chart data, and displays the filter output for the OHLC as candlesticks. The candlesticks corresponds to the actual calculations of the filter value during the formation of each price bar (not from all historical highs lows or closes). The shape of the bars therefore corresponds directly to the shape of each price bar. High pass filters are an underappreciated type of oscillator that are seldom used in technical analysis in the st
FREE

KFX SMA: Symbol Changer + Moving Average (3x) + ATR + RSI + Candle Timer.
This indicator allows you to create a Symbol list and change between symbols of the current chart or Timeframe by selecting the appropriate button. On Chart there are three(3) multi timeframe Moving Averages shown (selected by you), ATR Value MTF ( selected by you - helps with setting SL and TP), RSI Value MTF (selected by you) and a Candle Timer. Features: - Symbol Changer : Change Symbol and Timeframe of Chart. (
FREE
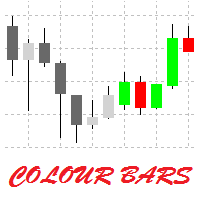
This is a simple utility for visual market analysis. Users can select trading day and time. Bullish candles located within the necessary time interval are shown in green, while bearish ones - in red. Candles outside of the trading time interval are shown in gray and dark gray.
Parameters Trade_Time = "00:00-00:00" - enter trading time. TradeSunday - trade on Sunday. TradeMonday - trade on Monday. TradeTuesday - trade on Tuesday. TradeWednesday - trade on Wednesday. TradeThursday - trade on
FREE

This utility allows to record the spread value to the file, which is equal to or greater than the value specified in the settings, at the specified time. The utility also displays useful information on the symbol's chart: current spread value in points, name of account holder, name of trading server, leverage, the size of the swap for buy orders, the size of the swap for sell orders, day of the week for accruing triple swap, the size of a point in the quote currency, the minimum allowed level of
FREE
您知道为什么MetaTrader市场是出售交易策略和技术指标的最佳场所吗?不需要广告或软件保护,没有支付的麻烦。一切都在MetaTrader市场提供。
您错过了交易机会:
- 免费交易应用程序
- 8,000+信号可供复制
- 探索金融市场的经济新闻
注册
登录