 MetaTrader 5
 专家
 指标
 程序库
 实用工具
 窗口小部件
 规则
适用于MetaTrader 4的免费EA交易和指标 - 36
 EA交易自动执行市场交易,而指标可使您更准确地分析报价并预测价格行为。
通过这些应用程序,您将能够更明智地在MetaTrader 4执行交易,抓住更多的交易机会。

This indicator is designed to find the difference in MOMENTUM price and indicator. This indicator shows the price and indicator difference on the screen. The user is alerted with the alert sending feature. Our Popular Products Super Oscillator HC Cross Signal Super Cross Trend Strong Trend Super Signal Parameters divergenceDepth - Depth of 2nd ref. point search Momentum_Period - Second calculation period indAppliedPrice - Applied price of indicator indMAMethod - MA calculation method findEx
FREE

这个趋势顾问在任何意义上都是保守的。 它类似于 E79U EA,但有重要的区别。
首先,它的算法选择信号更灵活,更严格。 这允许您增加交易的手数。
其次,作者的设置最初是保守的。
最重要的是,这个EA不接受小的止损。 信号不经常和非常有选择地打开。 他不会profit钱,如果他失去了停止。 我没有完全消除止损,但我不想用这个参数开玩笑,我将它与风险参数相关联。 当止损减少时,风险会增加。 注意这一点。 最重要的是,只是不要改变止损。
这个专家顾问在D1图表上进行交易,自信地承受亏损并获得大额利润。
屏幕截图显示设置的两个选项。 两者都进行了3.5个月的测试。 在这两种情况下,初始存款为$100,风险为10,初始手数为1.14。 在第一个变体中,这些订单的数量是2,在第二个变体中,它同时承受18个订单,以显示几乎最大的回撤而不会排出存款。
EA是为usdzar货币对设计的。 如果您仍然决定使用其他对,请确保正确更改前三名的参数。
FREE

淫妖是一个普遍的专家顾问。
它的主要优点是最高的输入精度,90%的交易及以上。
专家顾问参数根据用户需要的功能分为类别。 所有功能都可以禁用。
Ea交易旨在分散中小型存款。
主:
TakeProfit-以盈利结束交易的点数
止损-关闭亏损交易的点数
滑点-滑点
魔术顾问ID
手数-交易量
动态手数设置:
动态-启用/禁用事务量的动态计算
风险-风险系数。
布洛克马丁*盖尔经典 每个方向一次只能开一笔交易。 在亏损的情况下,下一个交易将是一个交易量乘数。
马丁-启用/禁用鞅
乘数马丁-手数乘数
淫妖专家顾问也可以构建网格。
Setka-启用/禁用网格
距离Setka-网格中订单之间的距离
乘数Setka-乘数
当然,不是没有顾问拖网的存在。 如果需要,您可以启用它,如果你不使用网格。
智能止损
智能步停止-束缚步
有一个按时交易的功能。 如果00:00和23:59被设置为默认值,则禁用它。
开始-交易开始时间
交易结束
交易之间的停顿是必要的,这样当我们收到一个信号时,我们只交易一次。
Pause_orders-启用/禁用订单之间的
FREE

Aurora P&L Dashboard — Free
Aurora P&L Dashboard puts your profit and loss right on the chart — so you can close the crowded terminal window and still keep the overview.
Live on your chart:
Today — realized P&L since midnight (server time)
N days — realized P&L over a period you set
Positions — number of open positions and total lot
Floating — current open P&L
Two modes:
Account-wide — all symbols together
Single symbol — type any symbol (e.g. EURUSD, USDJPY), or leave blank for the chart
FREE

趋势相关强度 (TCS) 指标:您在外汇趋势分析中的优势 趋势相关强度 (TCS) 指标 是一款尖端工具,它重新定义了您衡量趋势强度的方式,与平均方向指数 (ADX) 等传统指标相比,具有显著优势。与依赖方向运动的 ADX 不同,TCS 通过计算 收盘价与线性时间序列之间的相关性 ,独特地量化趋势强度。这种创新方法为外汇交易者提供了一种极其精确的方法来识别和利用强势趋势。 为什么选择 TCS? 及早发现趋势,最大化点数: TCS 不仅仅是反应;它更具前瞻性。通过衡量价格随时间线性移动的程度,它可以帮助您以惊人的准确性识别新兴趋势。 TCS 值在您的周线图上攀升至 45 以上 是一个强烈的信号,表明市场正在发生重大变动。将 TCS 与您现有的策略结合使用,可以更早地进入交易并捕获更多点数。 简洁不杂乱: 我们相信强大的工具也应该直观。TCS 具有 简洁、简约的设计 ,只有一条蓝线和一个清晰的虚线 45 级参考线。这种简化的界面消除了复杂性,让您可以完全专注于趋势强度而不受干扰,使其非常适合所有经验水平的交易者。 专为现代外汇设计: ADX 是在不同时代为商品开发的。然而,TCS 专为当今
FREE

产品标题 Smart Ichimoku (MT4) – SmartView 系列的一部分 简短描述 具有独特用户体验的 Ichimoku 指标,在 MetaTrader 平台上提供。提供以前不可用的高级功能,例如双击打开设置、隐藏和显示指标而无需删除它们,以及以全图表大小显示指标窗口。设计用于与 SmartView 指标系列的其余部分无缝协作。 概述 SmartView 系列通过创新功能为 MetaTrader 平台上的指标提供独特且与众不同的用户体验,使指标管理更快、更轻松。每个指标都配备了图表上的智能控制面板,显示基本信息并提供对所有重要功能的快速访问。 以前不可用的独特功能 SmartView 系列提供使指标工作更简单、更快速的高级功能: 双击打开设置: 无需在指标列表中搜索,双击面板上的指标名称即可直接打开设置窗口。 隐藏和显示指标: 一键隐藏和显示指标,无需从指标列表中删除和重新添加它们。 以全图表大小显示指标窗口: 在子窗口中,您可以最大化指标窗口以全图表大小显示,并临时隐藏其他窗口。 折叠和展开子窗口: 折叠子窗口以减少其高度并节省屏幕空间,然后在需要时将其展开回全尺寸。
FREE
This indicator uses a formula based on bollinger bands to determine if the market is in Range or not. It can be used to filter entries and not operate in a sideways market.
It has a minimum value of 0.2 from which it could be operated, although you can modify it in the options to adjust it to your trading style or the market you use.
If the histogram below is red, the market is in range, if it is green, volatility is higher.
FREE
Indicator "Time to Bar End" (TimeToBarEnd)
This technical indicator is designed to accurately track the time remaining until the current candle closes on the chart. It displays a countdown in minutes:seconds format, which is particularly useful for intraday traders and scalpers who need to know the exact closing time of the current candle. The indicator updates in real-time and offers flexible customization of its appearance. The settings include: choice of position from four chart corners, adj
FREE

PendingOrderActivator manages pending orders in the forex market in a continuous cycle.
The user must configure the duration of the orders, stop loss levels, take profit levels, and the MagicNumber.
The expert advisor automatically places pending orders based on the distance from the current price and deletes them when the opposite order is triggered.
When an order is activated, the bot will take a break until the user reconfigures it or changes the timeframe, at which point the bot will reactiv
FREE
Cycle Signals Indicator. Gives signal on price range cycling and smoothed with algorithm. There are very small parameters: allow alerts (Pop Up or Email), colors for chart arrows, timeframe to use for calculation (but better to use current timeframe). And most important parameter is "period". For low timeframes high values are recommended. Current period is good for M5. Decrease it for higher timeframes. Close trade arrows will come soon. MT5 version comes soon (but with some small price).
FREE

With this indicator, you can easily make price regions in all time zones. In addition, with the automatic supply demand finder, you can ensure that the new regions are found automatically. You can increase your transaction quality by reaching more accurate operations with this auxiliary Tool and indicator.
I share your trial version of EURUSD for free with you. If you want to buy the working version in all parities, you can contact me. +New version Gap Bar Add ( Press G keyboard ) Default con
FREE

USDJPY Keltner Range M15 Strategy is a fully automated MetaTrader 5 strategy designed to capture structured breakout opportunities on USDJPY using daily directional confirmation, Keltner Channel reference levels, volatility-buffered pending STOP entries and simple fixed-risk management.
The strategy is designed for USDJPY on the M15 timeframe. Its goal is to participate when the market shows directional intent through daily high or daily low behavior, while using Keltner Channel structure and
FREE
Do you want tidy and attractive charts? Let Hogvid Chart Scale help you! Chart Scale automatically scales the height of the chart to a configurable percentage of the total window height.
This creates space at the top and bottom of the window for additional visual elements and increases clarity without having to manually adjust the vertical scaling which can be annoying, especially if you change the chart symbol frequently.
The function can be activated and deactivated at any time with a simple
FREE

A simple but useful indicator for controlling volatility in intraday trading.
The indicator plots the average volatility (ATR) levels for the specified number of days on the current chart.
On the current trading day, the levels are dynamic and move depending on the minimum and maximum prices of the current day in "real time" mode.
In the input parameters we specify:
- the number of days to calculate and draw the ATR levels
- color of the ATP level lines
- the thickness of the ATR level li
FREE
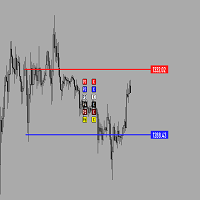
Утилита предназначена для создания ценовых уровней на графике.Утилита имеет панель управления с кнопками ,для создания и удаления ценовых уровней.При создание уровней ,также на экране появляются ценовые метки с прямоугольной зоной в области цены ,для лучшего зрительного восприятия.Также в утилите имеются настройки,толщины линий ,стиля линий и цвета линий.Размеры меток также можно измерить в настройках.
FREE
Your attention is invited to the indicator Price Action Indicators. It doesn't need settings. And also it is not tied to more than one indicator, which makes it not vulnerable to different accounts or brokers.
Add one setting PERIOD
Regards, Mikhail
Вашему вниманию предлагается индикатор Price Action Indicators. Ему не нужны настройки. А также он не привязан не к одному индикатору, что делает его не уязвимым перед разными счетами или брокерами.
С Уважением Михаил
FREE

This indicators when combine with its slave version can help you a better view in backtesting visual mode. https://www.mql5.com/en/market/product/61574 They will help you in developing a multi time frame trading strategy. 1) Run backtest in visual mode 2) Add the master indicator to the backtesting chart 3) Add the slave indicators to other charts of the same symbol with different time frames. Run the backtest and you will see all the charts auto scrolling.
FREE

Traditional Moving Average (SMA, EMA, SMMA, LWMA...) is very useful for identifying trends, but what will you do when you want to trade on lower timeframe, and you need to identify the bigger trend by a higher timeframe; Of course, you can make it by dividing your chart in separated windows, but your analytics will not be clear and intuitive ... That's why we build the Multi Timeframe Moving Average indicator.
With Multi Timeframe Moving Average ( MTF_Moving Average ), you can determine the Mo
FREE
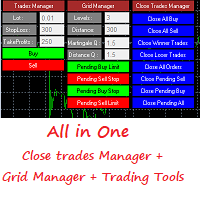
This is a demo version . Download the full version from this link https://www.mql5.com/fr/market/product/84850
Full version Allows you to : Set the number of levels (trades). Lot size and you can do Martingale to raise the lot size for each level. Set distance between levels, and you can manage the distance for each level using Distance Q. Static TP and SL for each level. You can open : BUY STOP / BUY LIMIT / SELL STOP / SELL LIMIT (levels in one click). Close all buy orders. Close all s
FREE

This indicator shows the strength of each currency compared to the US dollar by calculating the rate of change in price over a specified time period. When you open the indicator, you'll see a list of different currencies on the price chart. Each currency will have a numerical value indicating its strength level compared to the US dollar, where: If the value is higher than the US dollar, it will be displayed in green, meaning that currency is stronger than the dollar. If the value is lower than
FREE
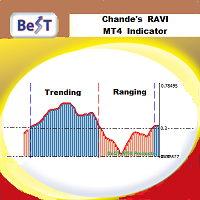
BeST_Chande RAVI (Range Action Verification Index) is an MT4 Indicator that is based on the corresponding indicator developed by Tushar Chande which is mainly based on market momentum while focuses on identifying ranging and trending markets.
By default RAVI is defined by the formula: RAVI = Absolute value (100 x (SMA(7) – SMA(65)). Also by default there is an arbitrary reference level of 3% that means a market is ranging if the RAVI is less than 3%, or trending strongly if it is is greater th
FREE
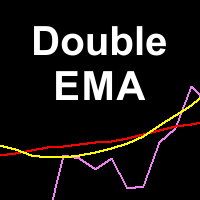
Double Exponential Moving Average (DEMA) is a well-known trend indicator. DEMA was developed by Patrick Mulloy and published in February 1994 in the "Technical Analysis of Stocks & Commodities" magazine. It is used for smoothing price series and is applied directly on a price chart of a financial security. Besides, it can be used for smoothing values of other indicators. The advantage of this indicator is that it eliminates false signals at the saw-toothed price movement and allows saving a posi
FREE

MQLTA Instrument Details shows you in an easy to read in chart table the details about the instrument/Symbol, including: Label Trade Mode Default Contract Size Minimum Size Maximum Size Size Step Digits Used Tick Size Tick Value Stop Level Bid Ask Spread
Parameters Indicator name to create the objects Default Window when opening the indicator Horizontal offset Vertical offset If you like this tool please take a minute to leave a review. If you have suggestions to improve it please send me a mes
FREE

New Release! Hello Everyone! I've just released Acronix, a new bot with live 2025 AND 2026 results. Find more about it here: https://www.mql5.com/en/market/product/201513 .
Introduction and Description
The indicator displays an arrow whenever a " Bearish Engulfing " is detected. The latter usually indicates the beginning of a downward trend. A bearish engulfing pattern is a technical chart pattern that signals lower prices to come. The pattern consists of an up candlestick followed by a large d
FREE

Just Currency Strength is a simple, and easy to use as a market analysis tool. It could helps trader to understand the broder view of the market and forcasting the movemt of each currency symbol and trend direction of each specific currency pair. Parameters Timeframe (Move Timeframe box to move the pannel) Currency (Must NOT be less than 5 currencies) Refreshtime in second Colors Strong//Weak//Neutrial Alerts setting Alert On/Off Push notification On/Off Happy Trading...
FREE

Spread Sekanas: The True Cost of Your Trade Stop guessing with pips and points. Start seeing the real , proportional cost of the spread with the Spread Sekanas indicator. The traditional spread, measured in pips, is misleading. A 2-pip spread on EUR/USD is completely different from a 2-pip spread on GBP/JPY or a $2 spread on Gold. This makes it impossible to consistently compare your real trading costs across different instruments. The Spread Sekanas indicator solves this problem by measuring th
FREE

The indicator shows entry points with Risk-Reward-Ratio 1 to 5. Main timeframe H1. Works on every pair. The main logic - is to find a reversal level, and then track the price reaction to this level. Doesn't need any settings. As a standard, it paint 5 levels of the same take-profit (red / blue for sellers and buys) and 1 stop-loss level - orange. ATTENTION! Test version of the indicator. Works only on the USDCAD pair! The full version can be bought here https://www.mql5.com/en/market/product/61
FREE

The Fibonacci indicator automatically displays the Fibonacci retracement levels, representing significant support and resistance. The range for calculating the indicator can be taken from the previous day, week, month, year or user-specified session.
Levels 100 % (High) of the range from the previous session. 0 % (Low) of the range from the previous session. 76,4 % of the range from the previous session. 61,8 % of the range from the previous session. 50 % of the range from the previou
FREE

Всем привет! Советник "Calipso" за много лет перетерпел очень много изменений и модификаций. Данная версия собрала в себе лучшие апгрейды и идеи. Эксперт поддерживает много режимов торговли и его можно адаптировать под разные нужды, такие как ночной скальпинг, торговля сеткой, позиционная торговля на отбой от уровней поддержки/сопротивления и многое многое другое. Благодаря глубоким настройкам, этот советник становиться незаменимым помощником в торговле. На базе этого EA можно реализовать десят
FREE
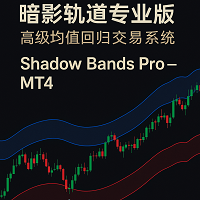
中文说明(MT4) 暗影轨道专业版 – MT4 高级均值回归系统 暗影轨道专业版是一款面向实盘交易的 收盘不重绘 趋势反转 / 均值回归指标。
通过「动态波动轨道 + 实体突破逻辑 + 内置胜率统计面板」,帮助你更直观地识别价格超买超卖区域以及潜在的高概率反转点。 核心功能 收盘不重绘:K线收盘后信号固定,不会来回变动 三层轨道结构:外圈光晕、中轨、核心轨道,清晰区分风险区与安全区 实体突破逻辑:过滤影线假突破,专注强势反转信号 内置统计面板:实时统计胜率、盈利信号、亏损信号,一图看清表现 TP/SL 智能盈亏线:基于 ATR 的 TP1/TP2/TP3 与 SL1/SL2/SL3 多级目标 信号冷却(防过度交易):在震荡期自动限制过密信号 中英双语支持:一键切换 English / 中文 文本与标签 自定义图表皮肤:红涨绿跌,更适合「波段 + 反转」视觉阅读 完整参数控制:轨道周期、宽度系数、ATR 周期、TP/SL 开关等都可灵活调整 使用思路 将指标加载到 MT4 图表,根据个人风险偏好调整周期、ATR、TP/SL 参数。 关注 下轨附近买入箭头 与 上轨附近卖出箭头 ,结合品种
FREE

The indicator informs when the current bar closes and a new bar opens. TIME is an important element of trading systems. BarTimerPro indicator helps you CONTROL THE TIME . Easy to use: place on the chart and set “alarms” if it necessary. In the tester, the indicator does not work. See the Lite version BarTimerPro-Lite
Key Features
4 operating modes: Shows the time elapsed since the opening of the current bar (11) Shows the time remaining until the current bar closes (11) Indicator Updates Every
FREE

经过7年的时间,我决定免费发布一些我自己的指标和EA。
如果您觉得它们有用,请 通过五星评级表达支持!您的反馈将继续带来免费工具! 也查看我的其他免费工具 这里
_________________________________ 波林格带宽度指标——高级市场波动性分析工具 在MQL4中精心开发的波林格带宽度指标,是一款先进的工具,旨在提升外汇交易分析的水平。它利用波林格带测量波动性的能力,为交易者提供关于市场动态和潜在交易场景的关键洞见。 喜欢这个免费指标吗?请用五星评价来表示支持!您的反馈是我们提供免费工具的动力! 主要特点: 精准波动性测量 : 计算波林格带宽度(上带 - 下带)/ 中带,准确评估市场波动性。 市场状况洞见 : 识别战略性交易所需的高波动性(潜在突破)和低波动性(市场整合)时期。 全面趋势背景 : 加强对市场趋势的理解,较宽的带表明更大的波动性和潜在趋势强度。 与交易策略集成 ️: 作为各种交易策略的有价值组成部分,尤其是与其他指标结合时,用于细致分析。 使用和信号解读: 设置 ️: 轻松将波林格
FREE

The indicator displays signals on the chart of the classic RVI indicator with an alert.
The indicator signals after confirmation of the strategy at the opening of a new bar. I recommend watching my advisor - Night Zen EA In the settings, you can select the following strategies: The main line crosses the signal line The main line crosses the zero level In the settings, you can change the period of the classic RVI indicator.
I also recommend to look at my other developments in the market:
ht
FREE

We provide indicators tailored to better meet your trading requirements. >> MT Sideway Filter <<
MT Focus Session : Focused on monitoring session times, the MT Focus Session indicator emphasizes market activity from opening to close, with a preference for the high-volume periods between the London Open and the U.S. Close.
TRADE: Forex
TIME FRAME: M5 M15 M30 H1
SYMBOL PAIR: All Symbol
SETTINGS:
FOCUS SESSION
Open Session Time: Start time of the session you are interested.
FREE

PivotPro Ultimate – Professional Pivot Levels with Probability Analysis & Telegram Alerts KEY FEATURES Automatic Pivot Levels – Previous day's High, Low, and Pivot plotted on your chart Real-Time Probability Calculator – UP/DOWN/FLAT probabilities based on last 20 bars Telegram Integration – Instant alerts on level touches and probability changes Day Labels – Clear day-of-week markings (MON, TUE, WED...) Full History – All levels remain on chart for complete historic
FREE
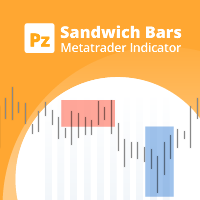
Spot high-probability trades: sandwich bar breakouts at your fingertips This indicator detects Sandwich Bars of several ranges, an extremely reliable breakout pattern. A sandwich setup consists on a single bar that engulfs several past bars, breaking and rejecting the complete price range. [ Installation Guide | Update Guide | Troubleshooting | FAQ | All Products | Get Help ] Easy and effective usage Customizable bar ranges Customizable color selections The indicator implements visual/mail/
FREE

Trade Master is advanced forex robot for manual trading and managing open trades. When attached to a chart it prints two buttons BUY and SELL. Using these two buttons you can trade manually by predefined Stop Loss, Take Profit and other parameters. Trade Master is also equipped with Trailing Stop system to protect the profits. Trade Master is the best tools for scheduled closing of trades. It can be used for closing trades for each weekday from Monday to Friday at specific time (hour and minutes
FREE

This is a RISK MANAGER utility for MetaTrader. To activate it, after downloading it, you must enable all autotrading controls on MetaTrader, as with EXPERT ADVISORS. The user must enter control settings as indicated in the indicator properties, which initially have default data. RISK MANAGER will perform checks and display pop-up alerts when certain behaviors exceed the user-entered settings. It's free; use it, try it, develop it, or contribute ideas. It's just a utility; the programmer assumes
FREE
Our modernized version of the popular channel TMA_TRUE indicator for MT4, which provides information on the main points of trend reversal and momentum exhaustion by drawing a channel on the chart, also draws arrows of signals for buy and sell. As a result, traders can identify bullish and bearish price reversal zones and BUY and SELL accordingly.
This indicator works well on all instruments and on all Timeframes.
This indicator is the basis of our Channel Trigger EA, which you can buy in MQL
FREE
This automated VOLUME SCALPING INDICATOR can be utilized to manage trades and identify potential areas of support and resistance for both buying and selling. It is designed to identify zones for Sell/Buy trades based on the volume analysis and can be effectively used in conjunction with other indicators, such as order block indicators, and more. Currently designed for MT4, it will later be adapted to function on MT5. We also offer the opportunity to customize the robot according to your trading
FREE
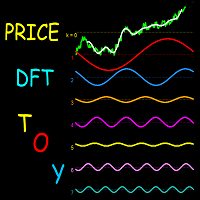
This indicator is a useful tool for visualising cyclic components in price. It calculates the Discrete Fourier Transform (DFT) of a price chart data segment selected by the user. It displays the cycles, the spectrum and the synthesised signal in a separate window. The indicator is intended as a learning tool only, being unsuitable for providing actual trade signals. Download the file - it is a free toy. Play with it to understand how signals can be transformed by controlling their cyclic comp
FREE

創意交易者 (EURUSD M30)
Idea Trader 是一款全自動、專業的交易機器人。 專為外匯市場設計的 EURUSD M30。
本EA無需配置參數。 準備在 EURUSD M30 上工作。 您只需要決定拍品的選擇。
該 EA 具有智能算法,可檢測趨勢,過濾掉市場噪音。 專家根據趨勢方向創建訂單。
輸入和輸出訂單由可以在任何 MT4 平台上找到的四個指標的組合給出:商品通道指數、動量、力量指數和平均真實範圍。
每筆交易都受到止損保護,這在波動性增加的時候帶來了資本安全。 這個 EA 提供小的下拉菜單,它提供了定期從市場中提取資金的可能性。
該“EA”在 2022 年 1 月至 2023 年 3 月期間對 EURUSD 歷史數據進行了測試。 在使用真錢之前,請先下載並自行測試。
該智能交易針對 EURUSD M30 進行了優化。 每一對都有自己的特點。
推薦: EAMagic - EA 的幻數,它允許顧問僅使用其頭寸。 每個圖表必須有不同的值。
本EA無需配置參數。
確保您擁有此平價歐元/美元 M15 時間框架的下載和可測試歷史記錄。
我建議使用 V
FREE

MT4 Alert Sender is a free ea tool that help you send the alert messengers in MT4 program for many different purpose with ease. Very simple and effective, you only need to input the alert content in a input box, then click a "Send Alert" button. The EA will send alert message. An alert pop-up shows your content in a new window pop-up.
You can combine of using MT4 Alert Sender EA with any other tools out there for your need. Thanks for your trust in my product.
FREE
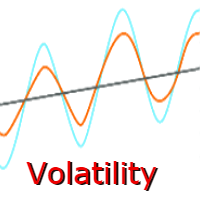
Now there is no need to check volatility on third-party websites in order to determine the average movement rage of a certain currency pair. The Truly Volatility indicator is designed for determining volatility for the specified period and is displayed in a separate window as a histogram and line. If attached to a chart with the Н1 timeframe, the indicator displays the average price movement for each hour (from 0 to 23) based on the history data. On the D1 timeframe it displays the average movem
FREE

Just INDY is a simple, and easy to use trend and reversal indicator. It will continuously monitor the movement of the price actions searching for new trends establishing or strong reversals at extreme overbought, and oversold levels.
Parameters Signal Perios
Sent Notification Please Test it with Strategy Tester and see how it work.
Happy Trading...
FREE
The oscillator indicator " JAngleR " is one of a series of three calculators of the angular deviation of the price chart of a trading instrument.
INPUT PARAMETER: DRAWs =128 - Number of bars to display the indicator in the chart history; Period_IND =14 - calculation period of the indicator in the number of bars; ma_period =1 - Moving Average Period; ma_method =MODE_SMA - moving Method; applied_price =PRICE_CLOSE - applied Moving Average Price. The values of the indicator indicators are degrees
FREE

Enhance Your Trading with the Support and Resistance Alert! Ready to take your trading to the next level? Introducing the Support and Resistance Alert—the ultimate tool to precisely identify market turning points! Key Features: Dynamic Support and Resistance Lines: The indicator automatically draws support and resistance levels based on local lows and highs, giving you clear guidance on where the market is likely to reverse. Real-Time Alerts: Stay ahead of the market with customizable alerts. Ge
FREE

Voorloper Expert Advisor: Revolutionizing Trading with DDR System Introducing Voorloper, an innovative Expert Advisor that blends Moving Average (MA) and Relative Strength Index (RSI) indicators to redefine your trading experience. Voorloper stands out from the crowd with its unique feature: the Drawdown Reduction (DDR) System.
Key Features: MA and RSI Integration: Voorloper utilizes a powerful combination of Moving Average and Relative Strength Index indicators to identify optimal entry and
FREE
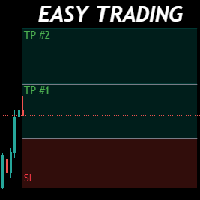
Money Management will help you to Easy Trade with One Click , instance and pending, set SL, and manage number of your TP . You can use this expert for different currency pairs, CFDs, cryptocurrency, and stocks .
The basic formula for calculating pip value and position size which has been used in this expert are:
Pipette Value = Position Size * (Exchange Rate (Base Currency) / Entry Price) * Contract Size * Digits Exp. Account Currency: USD Currency Pair: GBPJPY Position Size: 0.05 Lot = 5000
FREE

Parabolic MA Pro - Système de Trading Avancé Détectez les retournements de tendance avec précision grâce à notre système unique combinant SAR Parabolique et Moyenne Mobile ! CARACTÉRISTIQUES RÉELLES SYSTÈME HYBRIDE INNOVANT SAR Parabolique calculé sur la Moyenne Mobile (au lieu du prix direct) Filtrage des faux signaux grâce à la double validation Algorithme exclusif de retournement de tendance ALERTES PRÉCISES Notifications sonores aux points de retournement Détection automati
FREE

Detailed blogpost: https://www.mql5.com/en/blogs/post/766378
Key Features
Adaptive Upper/Lower bands Smooth Center Line Customizable Length (sensitivity) Non-Repainting (only current ongoing bar is updated every "Refresh After Ticks" number of ticks) Multiple Price Sources - Choose from close, open, high, low, median, typical, or weighted close Components:
The Basis Line The smooth center line represents the weighted average of price. Think of this as the "true" price level when all the noise
FREE

Pairs Navigator is a simple and easy-to-use tool that allows you to view all of your charts in a single window. This eliminates the need to open multiple charts from the Market Watch window, saving you time and effort. Pairs Navigator is also very lightweight, so it will not put a strain on your RAM or cause your MT4/5 platform to hang. To use Pairs Navigator, simply drag and drop the currency pairs you want to view into the Pairs Navigator window. You can then easily switch between charts by c
FREE

Smart Lot-Size Calculator And Trade Assistant for Mobile Trading Overview: This is the tool every trader in the market must have no matter if you are scalper, swing traders, day trader, or long term trader. This On-The-Go trading tool will help you stay disciplined and also stay free from daily trade management chores, Most traders face common problems like 1. Calculation of proper lot-size of a position to take controlled risk 2. Managing every trade and trailing stop-loss if trades goes in
FREE

This EA trades the forex markets by a specific combination of ATR and parabolic SAR indicator signals and transaction management. the EA has stop loss and take profit. minimum trading account 500.
default settings for GBPUSD 1h. settings for optimization: ATRperiod lot sarStep sarMaximum tpFactor slFactor this EA(){ operates once per bar; fast methods of optimization are valid(){ user can optimize by model (control point); || (open prices only); }}
developed, tested and optimi
FREE

4H Open Line Indicator - Settings Overview This custom indicator is used to draw and visualize the opening price , midline , and high/low ranges of 4-hour candles on smaller timeframes. It's particularly useful for intraday traders who want to see higher-timeframe levels. Indicator Inputs and Descriptions Parameter Value Description OpenLineColor White Color of the line indicating the open price of the 4H candle. OpenLineWidth 1 Width of the open price line. OpenLineStyle Solid Line style
FREE
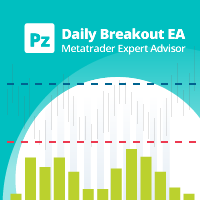
This EA trades daily breakouts placing bidirectional pending orders using the last day's trading range, provided these price levels have not been yet tested. It offers many trading behaviors and flexible position management settings, plus a martingale and inverse martingale mode. [ Installation Guide | Update Guide | Troubleshooting | FAQ | All Products | Get Help ] Easy to use and supervise Customizable break-even, SL, TP and trailing-stop Works for ECN/Non-ECN brokers Works for 2-3-4-5 dig
FREE
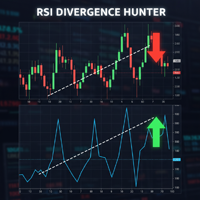
Powered by SVX Strategies Quant Team Divergences are among the most powerful signals in technical analysis, but spotting them in real-time is difficult and subjective. RSI Divergence Hunter automatically scans the market for these discrepancies between price and momentum. Eliminate Subjectivity, Automate Profit
Drawing lines manually leads to errors. If you prefer a fully automated, mathematical approach to trading, copy our official institutional algorithms: Copy "Friday Pulse" (Conservative/S
FREE

This is an adviser that often trades and opens trades almost every day (with normal optimization). In this case, the adviser opens no more than one transaction in each direction. When there are a lot of deals in optimization, more often it will give more profit in real life than advisers who, during optimization, make fewer deals, but show high profitability. This Expert Advisor is a free version of Trading every day and has some limitations: - currency pair only EURUSD - lot limit to 0.1 Input
FREE

Small free indicator to detect certain chart patterns, shoulder head shoulder / reverse, triple top / bottom, cup, flags and others... I designed it a while ago, it detects figures in m1, m5, m15, m30 and h1.
I hope it will be useful to you because I don't trade much with this indicator, I have a few others that I will try to put online quickly maybe you will find it useful, good Trade friends.
FREE

Top Hat是mt4平台的全自动专家顾问。它可用于短期高风险/高回报交易,或用于低风险/长期交易的剥头皮或跟随趋势。高顶礼帽配备有内置的自适应双波动率过滤器,每日趋势过滤器和rsi过滤器。它还允许为所有条目过滤器以及tp / sl级别使用自定义时间范围,并在任何时间轴时间范围上使用!这使ea无需用户干预即可更好地适应当前市场状况。TopHat具有几种资金管理功能,两种自动手数缩放类型,连续获胜交易的数量和按权益计算的数量,等等!
建议条件:
具有最低点差和佣金的ECN帐户
对冲账户杠杆500:1
建议使用VPS
建议最低入金$ 1000(可以使用更低的金额)
用于多种货币(例如:主要货币,低点差/风险货币交叉)
输入参数(建议首先优化参数IN_ALL_CAPITALS):
MaxLotSize:可以交易的最大手数,可以与经纪人的最大手数分开。
MaxSpread:以点为单位,如果价差高于此值将不进行交易。强烈建议将其设置为经纪人的广告平均价差。
MaxSlippage:设置最大滑移量 MagicNumber:区分帐户中其他EA的交易。确保它是唯一的!
AutoL
FREE
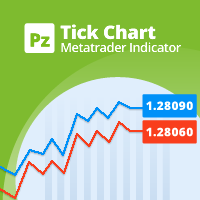
This indicator displays a complete tick chart with two optional moving averages, and makes paying attention to sub-m1 price data really easy. [ Installation Guide | Update Guide | Troubleshooting | FAQ | All Products | Get Help ] Identify price spikes easily The blue line is the ask price The red line is the bid price The indicator doesn't lose tick data when reloaded It implements two optional moving averages The indicator is non-repainting
Input Parameters
Display Moving Averages: Display
FREE

Squeeze and Momentum Indicator Indicator — Version 1.0
The Squeeze and Momentum Indicator is designed to highlight periods of low volatility followed by potential expansions in market activity. It combines Bollinger Bands and Keltner Channels to identify “squeeze” conditions and uses a momentum histogram to estimate the likely direction of the move once volatility expands.
How it works: A squeeze occurs when the Bollinger Bands contract inside the Keltner Channels. This condition is marked wit
FREE

趋势顽皮猴是一款综合了趋势识别、网格、对冲等多种策略的EA。使用它之后,相信你一定能开启属于你的财富之旅。这是免费版本,你可以下载专业版。 https://www.mql5.com/zh/market/product/58091
趋势顽皮猴 是一款趋势EA,只有在出现较为明显的趋势时才会交易,所以交易不是特别频繁,请耐心等待!!
特点
◾点差要求不是特别苛刻,一般平台都能运行 ◾关注趋势,利用趋势进行交易 ◾利用对冲交易获得利润的最大化
运行要求
◾货币对 :EURUSD ◾时间周期:H1 ◾存款要求:$500/0.01(比较安全) ◾ 实战信号: https://www.mql5.com/en/signals/684154
参数设置(专业版)
Migic: EA标记,用于区别于其他EA。 spread: 点差设置,如果点差大于该数值则暂时停止下单。 gird: 以最早的单子为基准,每亏损多少点就下一张单,100-200比较合适 Lot/autolot/proportion: 如果你选择autolot=FALSE,那么下单手数是固定的,你可以通过l
FREE

The Currency Strength Lines (CSL) indicator is a very useful tool for both beginners and experienced traders. It is able to calculate the strength of single currencies and show them on a chart, so that you can see the trend and spot trading opportunities.
How does it work? The CSL Indicator will run calculations on all the 28 pairs, resulting in the overall strength across the market of individual currencies at any given moment. You can use this data to spot currencies that are strong, getting
FREE

核心描述 Ultimate Trading Dashboard MT4 is a complete visual trading control system that integrates drag and drop order execution, multi-symbol monitoring, automated timeframe rotation, and advanced market analysis tools into a single unified workspace designed to improve speed, precision, and decision-making efficiency in manual trading on MetaTrader 4. 主要特点 支持直接在图表上拖放订单执行,并自动检测买入限价单、买入止损单、卖出限价单和卖出止损单。 单一界面即可自动轮换显示多种货币对的多符号监控 多时间框架自动切换,包括 H4、H1、M30、M15、M5 和 M1,提供持续的市场概览 多对阴影显示功能可同时显示多达 8 个相关仪器的阴影。
FREE

The Equity Curve indicator is a simple and helpful tool that shows the development of the equity curve in real time. For precision measurement, it should be used in a separate window with a period of M1.
Main features The indicator shows the development of the equity curve in real time. High precision on the minute chart. High-speed calculation. Available for MT4 and MT5. Please visit the Equity Curve indicator product page for the input and output parameters settings.
FREE

AutoRiskManage v2.3 — Documentation Expert Advisor — MetaTrader 4 & 5 AutoRisk Manage v2.3 Automated risk management EA with interactive graphical panel. Applies SL/TP, Break Even, Trailing Stop, and lot size calculation by risk percentage — for any instrument, any broker. MT4 / MT5 v2.3.0 MQL4 · MQL5 C2C + B2C Time Space Technology Overview AutoRiskManage is an Expert Advisor that acts as a risk management layer on top of any manually opened position. It does not generate trading signals — i
FREE
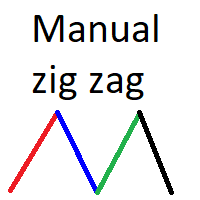
Manual Zig-zag allows you to build a zig-zag with the mouse, to build it is necessary to turn on the zig-zag and left-click. The file must be placed in the \ MQL4 \ Indicators folder then in the terminal from the list of indicators put it on the chart.
A zigzag can be built so that this zigzag can only be seen on the current time frame or in all halves at once.
You can change the color and thickness of the line while on the chart without getting into the settings.
You can quickly remove each
FREE

Shadow System Candles - AI Trend Visualization
Concept "Stop trading in the dark. Equip your chart with Night Vision."
Shadow System Candles is the visual core of the "Shadow Operation" project. It eliminates market noise and visualizes the true direction of the trend using AI-based logic (ADX + MA integration).
Note: This tool does not generate buy/sell arrows. It is designed to train your eyes to recognize "Active Trends" and "Dangerous Ranges.
Key Features ・AI Logic Coloring[/b]: Automat
FREE

The Trade Grid bot simplifies trading by executing multiple orders with a single click, as specified by the user. These orders are initiated instantly using the EA buttons on the chart and can be closed simultaneously using the close button also located on the chart. Additionally, Trade Grid efficiently manages trades by automatically closing them once they reach a predefined profit or loss threshold.
FREE
MetaTrader市场是独有的自动交易和技术指标商店。
阅读MQL5.community用户备忘更多地了解我们提供给交易者的独特的服务:复制交易信号,自由职业者开发的自定义应用程序,通过支付系统完成的自动付款和MQL5云网络。
