 MetaTrader 5
 Uzmanlar
 Göstergeler
 Kütüphaneler
 Yardımcı programlar
 Widget'lar
 Kurallar
YouTube'dan Mağaza ile ilgili öğretici videoları izleyin
Bir alım-satım robotu veya gösterge nasıl satın alınır?
Uzman Danışmanınızı
sanal sunucuda çalıştırın
sanal sunucuda çalıştırın
Satın almadan önce göstergeyi/alım-satım robotunu test edin
Mağazada kazanç sağlamak ister misiniz?
Satış için bir ürün nasıl sunulur?
MetaTrader 4 için ücretsiz Uzman Danışmanlar ve Göstergeler - 35
 Alım-satım robotları piyasalarda otomatik olarak işlem yapar, göstergeler ise fiyatları analiz etmek ve fiyat değişikliklerindeki kalıpları belirlemek için kullanılır.
Bu alım-satım uygulamalarıyla, MetaTrader 4'te daha bilinçli alım-satım işlemleri gerçekleştirecek ve daha fazla alım-satım fırsatı yakalayacaksınız.

UNIFIED FX — Entegre FX Analizi Birden fazla araç. Tek bir entegre sistem. UNIFIED FX , FX analizinde ihtiyaç duyulan birçok temel aracı tek bir indikatörde bir araya getirerek yatırımcılara piyasaları daha basit ve düzenli bir şekilde analiz edebilecekleri bir ortam sunar. Farklı indikatörler arasında geçiş yapmak veya grafik üzerinde çok sayıda araç göstermek yerine, UNIFIED FX temel teknik analiz araçlarını tek bir optimize edilmiş sistem içerisinde birleştirir. Dahil Edilen Analiz Araçları H
FREE

Bu indikatörü ve diğerlerini ücretsiz buradan edinin: İndikatörü işlem robotuna dönüştürün (kodlama gerekmez) Özel teklif : ALL TOOLS , tanesi sadece $35 — sınırlı süreyle ! Yeni araçlar olacak $30 fiyatıyla ilk hafta veya ilk 3 satın alma için! MQL5'te işlem araçları kanalı : en son haberlerimi takip etmek için MQL5 kanalıma katılın Çoklu zaman dilimi & çoklu sembol rehberi: Çoklu zaman dilimi & tarayıcı kullanıcı rehberi - 12 dilde mevcut MT5 sürümü hakkında daha fazla
FREE

Quantum Swing 1. What is Quantum Swing The indicator calculates and displays future price levels based on quantum mathematics with high accuracy of probability and direction. Levels are displayed in the form of zones for making trading decisions; they clearly define a narrow price range for placing orders with a minimum stop-loss and maximum take-profit. The indicator displays future trading zones on different timeframes H1, H4, D, W. Quantum oscillations are also displayed without reference to
FREE
Introduction to Order Risk Management EA ORM EA is specially designed for fast and accurate market order execution to be used with our Price Action and Econometric Trading strategies listed below. ORM EA is fully automatic and ORM EA is also very easy to use. ORM EA is totally free of charge. You can also use this robust order execution feature of this ORM EA for any other your own trading strategy.
Trading Strategy Guide Order Risk Management EA provides the guide for the risk management for y
FREE

PositionPilot — One-Click Trade Manager PositionPilot puts professional trade execution and position management directly on your chart. One click — and your trade is protected. Unlike most EAs that only handle their own orders, PositionPilot works with ALL positions — manual, from other EAs, or opened via its panel. One-Click Execution BUY/SELL buttons with auto lot by risk % Hotkeys F1–F6 for keyboard-only trading Auto SL/TP with configurable ratio ️ Smart Risk Management Balance or equity-
FREE
This utility allows you to check and improve your binary options trading skills. This is an indicator, not an Expert Advisor. Therefore, you do not need to remove your active EA from the chart.
Inputs Expiry, min - option expiration time; InfoPanel background color - info panel background color; InfoPanel text color - info panel text color; InfoPanel text fontsize - info panel font size.
FREE
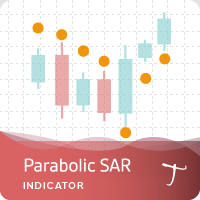
Tipu Parabolic SAR Panel is the modified version of the original Parabolic SAR indicator published by MetaQuotes here . Dashboard Panel (multi symbol) version for this indicator is available here .
Features An easy to use Panel that shows the Parabolic SAR trend and signals of selected timeframe. Customizable Buy/Sell alerts, push alerts, email alerts, or visual on-screen alerts. Customizable Panel. The panel can be moved to any place on the chart or minimized to allow more space. To enable the
FREE
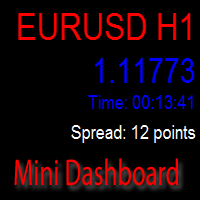
The indicator displays information about:
the name of the currency pair and timeframe. current price bid. time before the close of the candle. the current difference between the ask and bid (spread). Trading volume stats can also be displayed.
Displayed data
Name, account number, and account currency. A deposit in the account currency. Balance at the current time and a percentage of the balance. Current profit and its percentage. Current transaction and the percentage of the total deposit. Pr
FREE
IntradaySignals Intraday Signals is a visual and effective semi-automatic trading system, that: generates possible entry points to open BUY and SELL trades; displays recommended Take Profit and Stop Loss; displays current profit on open trade; displays current spread. The profitability of the indicator is shown in the screenshot on the example of the GBPUSD pair Does not redraw and works on opening bar. Time frames - M1-H1. Recommended TimeFrame-M5-M15. Signals are produced based on the used
FREE

Robot CFO1.2EA is an innovative financial management system designed to optimize portfolio performance through the integration of contrarian, hedging, and grid techniques. Leveraging cutting-edge artificial intelligence algorithms, it provides sophisticated risk management and investment strategies tailored to meet the unique needs of your financial portfolio.
Robot CFO1.2EA employs a contrarian investment approach, capitalizing on market inefficiencies and deviations from the norm. It identifi
FREE
DESCRIPTION 3 Bar Break is based on one of Linda Bradford Raschke's trading methods that I have noticed is good at spotting potential future price volatility. It looks for when the previous bar's High is less than the 3rd bar's High as well as the previous bar's Low to be higher than the 3rd bar's Low. It then predicts the market might breakout to new levels within 2-3 of the next coming bars. Must also be traded during the active hours of the market you want to trade. EG EURUSD 7am - 5pm This
FREE

EA, kârlı pozisyonları arayıp kapatarak kârsız pozisyonları kapatabilir .
Bu asistan , tüm pozisyonlar arasında terminaldeki en kârsız pozisyonu arar . Ayrıca, kalan kârlı pozisyonları arayarak, bir veya daha fazla pozisyonun kârının başka bir pozisyonun kaybından fazla olması durumunda zararı karşılayabilecek bir dizi pozisyon hesaplar. Bu tür bir dizi pozisyon bulunursa danışman bunları kapatır. Bir dizi konum kesinlikle herhangi bir konumdan oluşabilir. Maksimum sayıları da
FREE
This indicator displays buy or sell signals according to Bill Williams' definition of the Trading Zone. [ Installation Guide | Update Guide | Troubleshooting | FAQ | All Products | Get Help ] Easy to use and understand Avoid trading flat markets Deterministic indicator with clear rules The indicator is non-repainting It implements alerts of all kinds It has straightforward trading implications. A blue arrow is a buy signal A red arrow is a sell signal According to Bill Williams trading in t
FREE

ItradePeriod is an advanced and highly customizable trading software that allows traders to automate their trading strategies with ease. With ItradePeriod, traders can execute trades using six different strategies that can be customized to fit their specific trading style. The software features a unique scheduling system that allows traders to schedule trades at specific times, ensuring maximum efficiency and profitability. Each strategy can be customized with a range of trades management optio
FREE
Trade Assistant MT4 Introducing Tipster Trendlines 2: The Future of Manual Trading is Here! This is a Trade Assistant for MT4. Are you ready to elevate your trading game? Tipster Trendlines 2 isn’t just another tool; it’s your ultimate trading companion —designed to empower you, save time, and help you trade smarter. For 9 years, this tool has been a game-changer for traders who value control, precision, and results. Now it’s your turn to experience its magic. What Makes Tipster Trendlines 2 S
FREE

Indicador de Fibonacci Semanal para MT4 Maximize suas operações no mercado financeiro com o Indicador de Fibonacci Semanal para MetaTrader 4 (MT4) , a ferramenta essencial para traders que buscam identificar pontos estratégicos de suporte e resistência com base na ação do preço da última semana. Principais Recursos: Atualização Automática : O indicador recalcula os níveis de Fibonacci automaticamente a cada novo candle semanal. Níveis Personalizados : Traça apenas os níveis essenciais de Fibonac
FREE
MQLTA Support Resistance Lines is an indicator that calculates the historical levels of Support and Resistance and display them as Lines on chart. It will also Alert you if the price is in a Safe or Dangerous zone to trade and show you the distance to the next level. The indicator is ideal to be used in other Expert Advisor through the iCustom function. This DEMO only works with AUDNZD, the full product can be found at https://www.mql5.com/en/market/product/26328
How does it work? The indicator
FREE
The ZoomChart indicator displays data from other timeframes on the current chart in the subwindow, acting as a magnifying glass or, conversely, shrinking the chart to display larger timeframes.
The ZoomChar indicator automatically tracks the current outermost bar on the chart and moves with the chart as it shifts.
The indicator can display data from another financial instrument, not limited to the main chart instrument.
The robot carries the function of “mirroring” - The ability to convert c
FREE
ATR on Prices is simply an ATR indicator that plot a line for Resistance and Support using the Average True Range calculation. You can set the ATR daily periods, to be calculated. As well you can set the reference price to add and subtract the ATR measure to obtain the ATR Top and ATR Bottom lines, using the Open Price (that is fixed) or the Middle (HL/2) price (that will vary on the day) Or adding the ATR to the daily low and subtracting it from the daily high . You can use full ATR measure or
FREE

RQL Trend Board – Description RQL Trend Board is a simple but powerful multi-timeframe trend dashboard.
It shows the current market bias across several timeframes at the same time, using an internal trend-classification method. Each timeframe is displayed as a colored box: Green – bullish bias → look for long setups
Yellow – ranging / unclear → no trade zone
Red – bearish bias → look for short setups The indicator gives a clear overall picture of where the
FREE
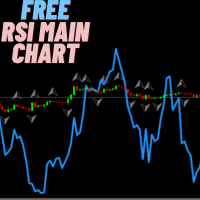
This indicator functions similarly to the traditional Relative Strength Index (RSI), but it's integrated directly onto the main price chart. This setup allows traders to more easily identify price fluctuations and recognize conditions of overbought or oversold markets. By observing the indicator in conjunction with price movements, you can gain valuable insights into potential trend reversals or continued momentum. Keep an eye on these signals to enhance your trading strategy. Happy trading, eve
FREE

input int hlength=85; input int vlength=25; input int DX=-340; input int DY=-80; input string InpDirectoryName="Data"; // directory name
input double lots_default=1; input int pc_times_default=2;
input double deposit_minimal=200; input double floating_loss_percent=10; input double margin_occupied=0.2; input int trade_allowed=1;//0代表测试模式 bool showbutton=TRUE; int tradingnumber=3;//控制买卖交易数量
struct edit_update { string symbol; int type; //0代表buy,1代表sell int magic;//代表magic double
FREE

Asesor Experto creado a base de una estrategia de 3 medias móviles. Puedes configurar los parámetros de cada una para lograr cruces de medias a medida. Puedes establecer los valores de TP y SL Cuenta con sistema de SL dinámico para proteger tus ganancias. Este asesor permite realizar Backtesting muy completo para crear estrategias solidas a tu gusto. Si conoces alguna confirmación basada en otro indicador para validar el cruce de la media y hacer este asesor aún más ´preciso, házmelo saber para
FREE
The Multi Trendlines indicator automatically draws the dominant trendlines on the current chart. The indicator looks for the 5 best Up trends and the 5 best Down trends as at the current price, drawing each trendline if filter conditions are met. The trendlines are named "Trendline"+[Direction]+Symbol()+TrendlineSequenceNumber For example: The second Up trendline on a EURUSD chart would be named "TrendlineUpEURUSD2". To get its current value would be: ObjectGet("TrendlineUpEURUSD2",OBJPROP_PRI
FREE

The indicator's source code is for sale; those interested can contact me via PM. Swing Counter MT4 is a free and powerful trading indicator designed to help traders identify and count market swings with precision. It automatically detects swing highs and swing lows, making market structure easier to read and helping traders spot potential trend continuation and reversal opportunities. Built for simplicity and efficiency, Swing Counter MT4 can be used on Gold (XAUUSD) and is fully adaptable to al
FREE
This indicator draws on the chart high and low prices of different periods . And If you want, Indicator can alert you when the current price arrive these levels. Alert Options: Send Mobil Message, Send E-mail, Show Message, Sound Alert Time Periods: M1, M5, M15, M30, H1, H4, D1, W1, MN Inputs: TimeShift: You can set start hour for calculating. And that way you can see levels independently from broker server's time-zone. PipDeviation: You can set price sensibility for alert (Default: 3) Lines
FREE

This indicator is based on the Channel . Input Parameters channel_One- show trend line One on or off. timeFrame_One - time Frame of channel One . ColorChannel_One - color of trend line One. channel_Two- show trend line Two on or off. timeFrame_Two - time Frame of channel Two . ColorChannel_Two - color of trend line Two. channel_Three- show trend line Three on or off. timeFrame_Three - time Frame of channel Three . ColorChannel_Three - color of trend line three. channel_Four- show trend line F
FREE

Skull Per https://www.mql5.com/en/users/earobotkk/seller#products This is a fully functional Expert Advisor. It is intended for trading major currency pairs with small spread. It uses scalping technique for quick profit and easy to use with simple input parameters. Input Max Spread: maximum spread allowable for trading. Magic No: unique expert number. Lot: size of lot. Lot Multiplier: size of subsequent lot by multiplication. Take Profit: take profit in pips. Stop Loss: stop loss in pips. Trail
FREE
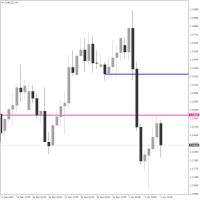
Crosshair Levels : Free version of Object Synchronizer. ** No synchronization of objects among grouped charts and no group chart features supported in this version. Are you bored to save and load template many times for the same symbol for many chart time frames? Here is the alternative. With this indicator, you enjoy creating 3 objects. All objects that you created/modified always are moved easily with clicking the object, moving cursor to the point you wanted and clicking again). Supported
FREE

Action Scanner is a market scanner. It’s yet another product in my "Can’t trade with out it" series. Do you want to know what is moving right now? Action Scanner scans your watchlist and opens the 10 currently most moving charts. You can chose between, most moving in points, most moving in your account currency(if you were to trade it with a standard lot size 1.00) and most moving in percentage. The standard version is a complete tool with no limitations. However the pro version has additiona
FREE

Her yatırımcı bu ritüeli bilir: gösterge ayarlarını aç, bir sayıyı değiştir, OK'a bas, grafiğe gözlerini kısarak bak, olmadığına karar ver, ayarları tekrar aç. MetaTrader 4 kullanıyorsanız bunu yıllardır yapıyorsunuz -- ve DeMarker hâlâ çoğu yatırımcının hiç dokunmadığı sessiz aşırı alım/aşırı satım göstergesi: farklı bir değeri denemek her seferinde bir diyalog turuna mal olduğu için sonsuza kadar varsayılan 0.30/0.70 değerlerinde kalır. DeMarker Live Tuner buna son veriyor. Bu, doğrudan grafik
FREE
The Parabolic SAR Trailing Stop will trail the Stop Loss price of your selected orders following the PSAR indicator, so you don't have to worry about having to change it manually.
How does it work? The Expert Advisor sets and moves the Stop Loss price of the selected orders following the value of the PSAR Indicator. You can filter the Orders by Symbol Comment Magic Number Buy/Sell
Parameters PSAR Step - The Step of the PSAR PSAR Max Step - The Max Step of the PSAR PSAR Shift - The Shift of the
FREE
Indicator of vertical lines on the timeframes М5 and М1. It draws the lines for the period of the current day and the previous day. This indicator visualizes visually shows the trader the beginning and end of the chart hour, as well as the past hourly periods, 30-minute and 5-minute chart intervals. The advantage provided by this indicator is that the trader using this indicator on a chart of a currency pair with the smaller timeframe will always be aware of when the new hour begins.
On the con
FREE
The SDX Chart is a free additional indicator which can be used in combination with SDX Dashboard .
Features Ability to review the history of each symbol and time frame. Ability to change symbols and time frames with one click. Works perfectly in combination with SDX Dashboard and helps you to understand the system better. Settings
MA Period - number of periods for the calculation of the moving average and the standard deviation. Number of Bars - how far back to draw the indicator. Buttons Size
FREE
Real-time spread tracking and monitoring software
Displays spread values in form of histograms on current timeframe of chart Convenient for analyzing spread changes, as well as for comparing trading conditions of different brokers By placing on desired chart, the spread changes at different trading times are displayed
Additionally Fully customizable Works on any instrument Works with any broker
FREE

Key Features & Core Logic ATR Rope Indicator Logic (Pine Script Replication) Utilizes a custom-calculated Average True Range (ATR) "Rope" mechanism that adapts dynamically to market volatility . Functions as a trailing baseline and trend-direction filter, helping the EA stay on the right side of market momentum Scoring System & Risk Filtering Evaluates market conditions through a comprehensive scoring algorithm (out of 14 points for both Buy and Sell sides) . Trades are only executed or alerted
FREE

The OHLC indicator shows the current and historical values of High, Low, Open, Close and Mid for a specific time period. It can plot the current values or the values from the previous session. The indicator's range can be calculated from a daily, weekly, monthly, or user-specified session.
Levels High of the current or previous session. Low of the current or previous session. Open of current or previous session. Close of the current or previous session. Midpoint of the current or prev
FREE

Power Trend Free - the indicator shows the trend strength in the selected period.
Input Parameters The indicator has three input parameters: Period - a positive number greater than one, it shows the number of candlesticks used for calculations. If you enter one or zero, there will be no error, but the indicator will not be drawn. Applied Price - the standard "Apply to:" set meaning data used for the indicator calculation: Close - Close prices; Open - Open prices; High - High prices; Low - Low p
FREE

This EA trades using the CCI Indicator. It offers many trading scenarios and flexible position management settings, plus many useful features like customizable trading sessions, a martingale and inverse martingale mode. [ Installation Guide | Update Guide | Troubleshooting | FAQ | All Products | Get Help ] Easy to use and supervise It implements three different entry strategies Customizable break-even, SL, TP and trailing-stop Works for ECN/Non-ECN brokers Works for 2-3-4-5 digit symbols
FREE
Designed especially for GBPUSD 30m market. Minimum trading account 1000 $. The EA trading engulfing candle formations combined with adx indicator. There are 3 main methods of orders placement and management, all three methods are profitable with different results for user to chose. tested on a specific market and timeframe but can operate on other markets ass well.
developed, tested and optimized on " VantageMarkets " platform.
FREE
Identify trending and flat markets effortlessly
This indicator calculates how much has a symbol moved in relative terms to find trending or flat markets. It displays what percentage of the latest price range is directional. It can be used to avoid trading in flat markets, or to find flat markets to execute range-bound trading strategies. [ Installation Guide | Update Guide | Troubleshooting | FAQ | All Products | Get Help ] A value of zero means the market is absolutely flat A value of 100
FREE

OHLC Magnet adds the missing magnet points for Horizontal Lines, Rectangles, and Price Labels. Instructions:
Simply drag one of the aforementioned objects to the desired Open, High, Low, or Close , within the Pixel Proximity, and OHLC Magnet will automatically attach the object to the exact price point you chose. Parameters:
Proximity (Pixels): The proximity, in pixels, to how close your mouse cursor must be to the Open/High/Low/Close for the utility to attach to that specific price point. Defau
FREE

Market Power Index (MPI): The Trader's Battlefield Intelligence When bulls and bears clash, MPI shows you who's winning. It measures the real-time balance of power between bulls (buyers) and bears (sellers) in any given market.
Now you can make informed decisions with the only indicator that measures both sides of the market simultaneously!
Professional-grade market analysis, simplified for every trader.
Available on both mt4 and mt5 platforms Free! Who Needs This? Forex traders (all exper
FREE

The technical indicator, in real time, searches for candlesticks that exceed the size set in the settings and gives signals about them. As a rule, such abnormally large candles appear either at the beginning of strong impulses or at the end of a directional price movement. At the beginning of the pulse, the signal can serve as a basis for searching for an entry point, at the end of the movement, it is a sign of a climax and may indicate the near end of the trend. The reference size for filtering
FREE

Hello, I need reviews from you guys. Thank you Fractal Swing Detector Pro Indicator is designed to help traders identify key swing points in the market . By combining fractal an d pivot analysis, this indicator provides deeper insights into price movements an d potential reversals. Key Features: Fractal Analysis: Identify high and low fractals with the option to use either 3 or 5 bar fractals . Fractals help detect minor reversal points within trends. Pivot Points: Advance d pivot
FREE

G2 DASHBOARD PRO by Ida Bagus Putu Mahardika PROFESSIONAL TRADE EXECUTION & MANAGEMENT DASHBOARD G2 Dashboard Pro is a comprehensive trading management tool that revolutionizes how you place and manage orders. No more manual calculations or switching between windows – everything you need is in one interactive, draggable dashboard directly on your chart. KEY ADVANTAGES 1. CHART-BASED PENDING ORDER PLACEMENT Click on the chart to set your entry price visually Support for all order types: Buy
FREE

STOCH AND RSI ALERT https://www.mql5.com/en/users/earobotkk/seller#products (I have created a dashboard from this product, please take a look by clicking here ) (I have also created an EA from this product, NOW user can go automation, click here ) P/S: If you like this indicator, please rate it with 5 stars in the review section, this will increase its popularity so that other users will be benefited from using it. This indicator notifies and draws an arrow on the chart whenever the main sto
FREE

One Click Close All is a script that when thrown on any chart will automatically close all orders regardless of the asset or what type of orders they are, it will close everything much faster than a human could. You will find paid versions of the same style of this script, but read carefully and you will see that it performs the same function ... here you have it for free, enjoy it.
FREE

I present an effective tool for determining the reversal on the H4 timeframe. The indicator is installed on the M30 chart. All parameters are already set. Proper use of the indicator: Unfortunately, the test in the tester will not give a correct idea about the indicator, so the rent for one month is as affordable as possible. You do not need to install the file on a remote server. Install it
FREE
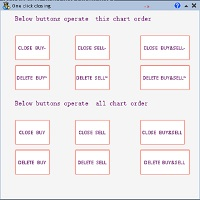
一键平仓小工具,可以针对买单、卖单和挂单进行批量操作,可以操作当前图表订单和所有订单,简单高效。 第一行第一个按钮是关闭当前图表 品种 所有买单,第二个按钮是关闭当前图表品种的所有卖单,第三个按钮是关闭当前图表 品种 的所有订单; 第二行 第一个按钮是删除当前图表 品种 所有买单挂单,第二个按钮是 删除 当前图表品种的所有卖单 挂单 ,第三个按钮是 删除 当前图表 品种 的所有 挂单 ; 第三行第一个按钮是关闭所有 品种的全部买单,第二个按钮是关闭所有 品种的全 卖单,第三个按钮是关闭所有 品种的全部订单; 第四行第一个按钮是删除所有 品种全部买单挂单 ,第二个按钮是 删除 全部品种 的全部卖单挂单 ,第三个按钮是删除 全部品种 的全部挂单 。 希望此程序能对您有用
FREE
High, Low, Open, Close — isn't this too much? Sometimes you need a unique history of prices. But if choose one thing, you lose the rest. Smoothing also leads to data loss. Often you lose one of the most important market details: information about extremes. It is due to the preservation of information about the highs and lows, the correct "smoothing" for the history of price is a zigzag. But zigzags also have drawbacks — they do not provide intermediate values. The Price Line indicator solves thi
FREE
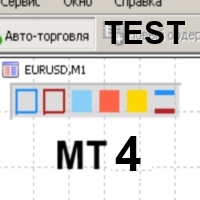
Color Levels - удобный инструмент для тех, кто использует технический анализ с использованием таких инструментов, как Трендовая линия и Прямоугольник. Имеется возможность настройки двух пустых прямоугольников, трех закрашенных и двух трендовых линий. Настройки индикатора крайне просты и делятся на пронумерованные блоки: С цифрами 1 и 2 вначале - настройки пустых прямоугольников (рамок); С цифрами 3, 4 и 5 - настройки закрашенных прямоугольников; С цифрами 6 и 7 - настройки трендовых линий. Объе
FREE
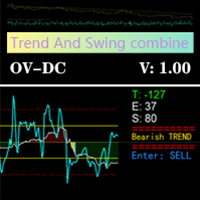
Based on the trend-following principle of CCI, it has been improved to become an indicator that can identify the reversal of the trend and its development direction, that is, it can identify the top and bottom attenuation of the oscillating trend in the trend market. feature The red and green columns represent the trend of bullish or bearish development under the current cycle. The blue line shows the position and attenuation of the current price trend in the current cycle. The upper and lower r
FREE

This is a free version of our Great tool with limited functions. The ChartChanger is a great utility tool to reduce the number of open charts on your terminal. There is three section to it: Symbols, Time frames and Templates. You need only one chart to be open and still you can scroll up to multiple ones. Symbols: With the push of a button you can change from one symbol to another, and your applied indicators will stay on the next chart. For the symbols there is an auto detection mode, or you ca
FREE
This indicator uses Bollinger Bands lines to detect markets trend. It's a very useful tool for manual trading. Furthermore it is possible to use the indicator with ATR as a filter , as well as the option to pop up an alert when a reverse trend occurs. The readings are very simple to use and understand. Indicator works best on H1 timeframe.
You can to get source code from here .
Parameters BarsCount - How many bars used to show the line. BBperiod - Period of Bollinger Bands. BBdeviations - Devi
FREE
Простая утилита MQLTA Draw Grid поможет вам нарисовать сетку на вашем графике. Она полезна при изучении графика и моделирования сетки.
Как она работает? Утилита будет создавать горизонтальные линии в зависимости от заданных параметров
Как использовать этот инструмент Установите индикатор на график, выбрав параметры по умолчанию. Выберите начальную точку, значения минимума и максимума диапазона и стиль. В появившейся графической панели вы сможете создавать и удалять сетку, а также изменять неко
FREE
This indicator draws lines based on the standard Fractals indicator. Once a fractal is broken up or down, the indicator generates an alert, sends an email notification and a push message to your mobile phone.
User Inputs History - the number of bars in history for calculation. Color Up Fractal - the color of the upper fractal line. Color Down Fractal - the color of the lower fractal line. Width - the line width. Alerts - alert. EmailAlerts - email notification. NotificationAlert - push notifica
FREE

Alerts utility issues notifications when orders are opened, closed and removed, as well as when the price touches the selected graphical objects on the chart. The utility supports all graphical objects used in graphical analysis and features a simple graphical interface. Once launched, the indicator works in the background, does not take up space on the chart and does not consume system resources. Tracking order status.
If tracking order status is enabled, the utility automatically checks order
FREE

Этот индикатор основан на концепции "Дивергентных баров" из торговой системы "Торговый Хаос" Билла Вильямса. Он предназначен для автоматического выявления на графике специфических ценовых паттернов, которые могут указывать на потенциальные точки входа или смены тренда. Что такое Дивергентный бар (BDB)? Дивергентный бар - это свеча или бар на графике, который имеет определенные характеристики относительно предыдущего бара и линий индикатора Alligator (Челюсть, Зубы, Губы). В системе Билла Уильямс
FREE
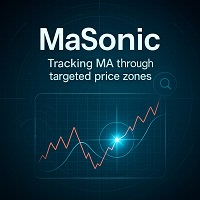
Quickly search for matching Moving Averages (MAs) at any point you click on the chart! Experience the speed and ease of MA Search today.
Features: Easy operation: Click on any point where you want to find the MA. Instant Results: Displays matching MAs if found. Sleep function: Hides buttons when not in use to keep the interface clutter-free. Manual Control: Manually adjust the MA using the on-screen buttons. Fixed MA: Once you find an MA, you can pin it there independently of
FREE

This EA only created for AUDCHF with an Risk Reward 1:2 Download Set Files - CLICK HERE NO GRID, NO MARTINGALE and NO MORE OVERTRADING. Add This to Activate News Filter - https://ec.forexprostools.com/ Features :- Symbol AUDCHF Brokers IC Markets, Tickmill, Pepperstone Account Type Raw Spread, Pro, Razor Leverage Recommended 1:500 Timeframe 15M Settings Download Minimum Deposit $100 Risk Reward 1:2 Strategy Market Movement
Why Should You Use This EA:
Market Movement Strategy. Hard
FREE

VTB High Watermark Drawdown INFO Indicator for MT4 Advanced Account Monitoring & Drawdown Information Dashboard VTB High Watermark Drawdown INFO is a professional account monitoring indicator designed to display drawdown statistics, account performance, and risk management information directly on the chart. This indicator does not interfere with trading activity. It does not open or close positions, modify orders, or block trading. Its sole purpose is to provide a clear and comprehensive account
FREE
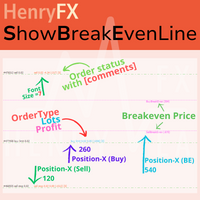
This indicator can help easy to management your order on screen.
FREE Version, included: - " Show Breakeven Price "
Show Breakeven Line Pro : : https://www.mql5.com/en/market/product/58289
Input Parameter: " Label Prefix "
:: [ ] Description; " Position-X-Dis "
:: [ ] Description; " Position-Y-Dis "
:: [ ] Description; " Show Market Price "
:: [ ] Description ; " Price Up Color "
:: [ ] Description; " Price Down Color "
:: [ ] Description ; " Position-Y-D
FREE

Super Ichi İndikatörü Nedir? Super Ichi, Ichimoku Kinko Hyo ve SuperTrend indikatörlerinin gelişmiş bir kombinasyonudur. Bu güçlü teknik analiz aracı, piyasa trendlerini belirlemek ve alım-satım sinyalleri üretmek için tasarlanmıştır. Ne Yapar? Çift Seviyeli Trend Analizi : Tenkan-sen ve Kijun-sen çizgilerinin özelleştirilmiş versiyonlarını kullanır Otomatik Sinyal Üretimi : Kesim noktalarında görsel işaretler (oklar) gösterir Anlık Alarm Sistemi : Yeni sinyaller oluştuğunda sesli ve görsel uyar
FREE

Bir carry trade üç ay boyunca sessizce swap biriktirip, bunun tamamını bir haftalık fiyat hareketinde kaybedebilir.
Önemli olan swapın büyüklüğü değil, o sembolün ne kadar hareket ettiğine göre büyüklüğüdür. Terminaldeki ham sütun bu soruyu yanıtlamaz: değerler farklı birimlerde yayımlanır, sözleşme büyüklükleri farklıdır ve oynaklık büyüklük mertebesi bakımından farklıdır. Bu sayılar zaten birbiriyle karşılaştırılabilir değildi.
Swap Scanner her sembolü mevduat para biriminizde tek bir değer
FREE

**Exit Manager — trail and close your trades by rule**
Exit Manager takes over the exits on trades you already have open. You open positions however you like — by hand, from a signal, or from another EA — and this one manages them out with three rules you can mix: a peak-based Trailing Take-Profit, a Time-in-Trade close, and an ATR-trailing stop.
Exit-only EA: it never OPENS trades; it manages and closes existing ones.
MO işlem araçları serisinin bir parçasıdır — diğer ücretsiz ve ücretli ar
FREE

TradeSnap, bir SATIN AL/SAT emri yürütüldüğünde ekranı otomatik olarak yakalar ve kaydeder.
Basitçe tablo üzerinde ayarlayın ve herhangi bir ekstra çalışma olmadan otomatik olarak kaydedilecektir.
Grafikteki çizgiler, oklar vb. de görüntüde olduğu gibi kaydedilir.
10000x10000 piksel olabilen resim boyutu, böylece fiyat hareket geçmişini gösteren yatay bir resim kaydedebilirsiniz.
Parametre bilgisi
--Olay Parametresi--
Sihirli sayı (0=ALL): Herhangi bir EA'nız varsa, Mugic Number'ı ayarlay
FREE
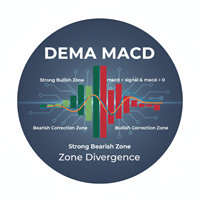
Indicator: The DEMA MACD Zone Divergence This is a powerful, multi-timeframe trend-following indicator based on the Moving Average Convergence Divergence (MACD) , but enhanced using Double Exponential Moving Averages (DEMA) for reduced lag. Its main function is to paint the background of the price chart with color-coded rectangular zones, clearly signaling the current momentum phase and potential shifts in market control (bullish or bearish). Core Purpose To visually map the strength and phas
FREE

Sentinel Pro V is a professional-grade MetaTrader 4 Expert Advisor designed for traders who demand precision and mobility. By combining three layers of RSI and Stochastic analysis with custom trendline tracking, this bot ensures you stay informed of every critical market move via instant Telegram notifications. Key Specialized Features 1. Triple-Level RSI & Stochastic Alerts Unlike standard bots, Version 2 allows you to set three distinct alert zones for both RSI and Stochastic indicators. This
FREE
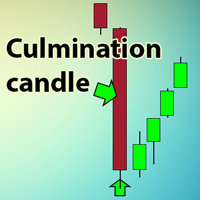
The indicator searches for the largest candles with minimum wicks for the last X candles. Sometimes, such candles mark the presence of a strong buyer, who quickly and strongly pushes the price in the right direction. However, most often, these are culmination candles, especially at the end of a prolonged trend when a single large candle knocks out stop losses of the most persistent traders and the price reverses instantly. The indicator allows you to open a position on the very edge of the marke
FREE
MetaTrader Mağazası, alım-satım robotları ve teknik göstergelerin benzersiz bir deposudur.
Yatırımcılara sunduğumuz benzersiz hizmetler hakkında daha fazla bilgi edinmek için MQL5.community - Kullanıcı Notunu okuyun: alım-satım sinyallerini kopyalama, freelancer'lar tarafından geliştirilen özel uygulamalar, Ödeme Sistemi aracılığıyla otomatik ödemeler ve MQL5 Bulut Ağı.

Alım-satım fırsatlarını kaçırıyorsunuz:
- Ücretsiz alım-satım uygulamaları
- İşlem kopyalama için 8.000'den fazla sinyal
- Finansal piyasaları keşfetmek için ekonomik haberler
Kayıt
Giriş yap
Web sitesi politikasını ve kullanım şartlarını kabul edersiniz
Hesabınız yoksa, lütfen kaydolun