 MetaTrader 5
 专家
 指标
 程序库
 实用工具
 窗口小部件
 规则
适用于MetaTrader 4的免费EA交易和指标 - 39
 EA交易自动执行市场交易,而指标可使您更准确地分析报价并预测价格行为。
通过这些应用程序,您将能够更明智地在MetaTrader 4执行交易,抓住更多的交易机会。

Calm kangaroo The Expert Advisor tool has been developed for AUDCAD 1H based on BollingerBands indicator, SMA and pending orders. It has been backtested on more than 18-year long tick data with 99% quality of modeling. The enclosed screenshots demonstrate the complexity and coverage of the test by Monte Carlo analysis with 200 simulation. A broker with a small spread and slippage is recommended for better performance. There is no need to set up any parameters, except Magic number and Friday ex
FREE

三重融合信号(合流):捕捉完美的U型转弯 单一指标往往造成误报,收集"市场噪音"。 但是,当三个完全不同的工具在同一时间逻辑上指向同一点时,这已经是一个有分量的入口论点。 该信号基于合流(因素合流)原理,将振荡器的强度与每日价格边界相结合。
信号包括什么? 信号结合了三个独立的分析级别:
Rsi(宏观情绪过滤器):确定市场的全球过热。 指示工具何时被驱动得太深(超卖)或飙升得太高(超买)。
随机(局部触发):在过热区域内搜索短期冲动和精确的数学反转点(快线和慢线的交叉点)。
每日范围位置(结构过滤器):测量当前价格相对于当天极值的位置,范围从0%(当天最低)到100%(当天最高)。 这是针对强劲的每日趋势进行交易的保护。
它是如何工作的 该指标正在等待一个罕见但强大的时刻,当所有三个条件在同一时间一致。 信号严格地在蜡烛结束时给出,因此形成的箭头永远不会重绘。
买入信号(绿色向上箭头): 市场正在下跌。 RSI报告严重超卖情况。 随机线走到"底部",从下到上交叉。 与此同时,价格已经触及强劲的每日支撑位,处于当天最低水平的15%以内。
卖出信号(红色向下箭头): 市场正
FREE
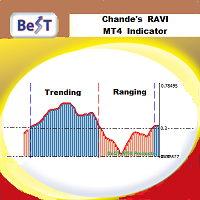
BeST_Chande RAVI (Range Action Verification Index) is an MT4 Indicator that is based on the corresponding indicator developed by Tushar Chande which is mainly based on market momentum while focuses on identifying ranging and trending markets.
By default RAVI is defined by the formula: RAVI = Absolute value (100 x (SMA(7) – SMA(65)). Also by default there is an arbitrary reference level of 3% that means a market is ranging if the RAVI is less than 3%, or trending strongly if it is is greater th
FREE

FuturePriceM15 - один из немногих индикаторов, который делает прогноз цены прямо на ценовом графике. Алгоритм расчета индикатора основан на быстром преобразовании Фурье. Имея колебательное поведение цены, функция Фурье прогнозирует ее поведение в дальнейшем. Индикатор устанавливается обычным образом на график с торговым инструментом указанным в переменной symbol с периодом M15 , данный временной период является самым оптимальным для работы с любыми торговыми символами. После установки, индикато
FREE
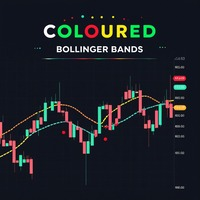
Coloured Bollinger Bands The Coloured Bollinger Bands indicator is an enhanced version of the standard Bollinger Bands, offering customizable features to suit your trading needs. It uses the classic Simple Moving Average (SMA) as the middle band, and allows you to easily change the appearance of the bands, including the option to select colors and line types, ensuring better visual clarity and adaptability on your charts
FREE
The FxSProWPR oscillator generates signals for trend confirmation, which can also nbe used to confirm the emergence of new trends.
Indicator Parameters NumberBars - the number of bars to display the indicator. Too many bars may significantly slow down the operation of the trading terminal. SignalAlert - an Alert notifying of a trend. SignalSound - sound alert to notify of a trend. The sound will be played once the histogram exceeds the level of 15.
Rules to confirm position entry Green histogr
FREE

Displays previous months Highs & Lows. You can set the number of months to display levels for, also the line style, color and width. This is very useful for traders using the BTMM and other methods like ICT. I'll be creating similar indicators for MT5 for the BTMM. Send me your suggestions to my Telegram: https://t.me/JDelgadoCR Take a look at my other products at: https://www.mql5.com/en/users/jdelgadocr/seller
FREE
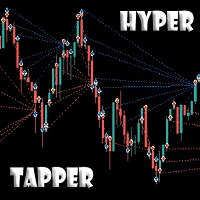
Hello everyone!
This Expert Advisor is developed based on hypertaping. Tick strategy, you won't be bored! The telegram group: https://t.me/FXAdvisorsMy Attention! Amazing results in a short trading period. Please pay attention to the increased risk, in order to trade it you need to have experience in trading with high leverage. The recommended minimum deposit is 2000 USD on a dollar account or 20 USD on a cent account. If you have any questions, do not hesitate to write to me.
FREE

Automated medium-term Expert Advisor. It is based on Bollinger Bands . The EA is optimized for EURUSD H1 . The robot should be optimized for use on other instruments. The Expert Advisor does not use hedging, martingale, grid, arbitrage etc. The results obtained in the strategy tester are identical to the results of real trading. Since the results for Control points are close to results of optimization in every tick mode, the EA allows for quick optimization using Control points .
Parameters Mod
FREE

The Fibonacci indicator automatically displays the Fibonacci retracement levels, representing significant support and resistance. The range for calculating the indicator can be taken from the previous day, week, month, year or user-specified session.
Levels 100 % (High) of the range from the previous session. 0 % (Low) of the range from the previous session. 76,4 % of the range from the previous session. 61,8 % of the range from the previous session. 50 % of the range from the previou
FREE

Just INDY is a simple, and easy to use trend and reversal indicator. It will continuously monitor the movement of the price actions searching for new trends establishing or strong reversals at extreme overbought, and oversold levels.
Parameters Signal Perios
Sent Notification Please Test it with Strategy Tester and see how it work.
Happy Trading...
FREE

This version of the indicator works only in the tick data stream. In this way, we only see the current situation from the moment of launch. I recommend using the classic version Real-Time Currency Valuation . The indicator calculates currency strength of eight major and also can calculate strength of any other currency, metal or CFD.
Main Features It is able to display only the currencies that are currently necessary, thus not overloading you with unnecessary information and notifications. It
FREE

SkalpAUDNZD is a highly accurate and reliable advisor for trading the AUDNZD currency pair( time frame М5) . The advisor does not have dangerous technologies such as martingay, grids and averaging and is therefore safe for a trading account. Orders are closed using a signal or take profit and stop loss; the advisor forcibly closes orders on the opening day. The advisor opens only one order at a time and all orders are protected by a fixed Stop Loss. The advisor is easy to use, as it has fe
FREE

RRS Scalping is based on the Grid strategy, which involves increasing the lot size opposite to the price movement and waiting for recovery. Grid is usually a very medium risk technique, but this EA is built on well-calculated mathematics to minimize drawdown, reduce risk, and maximize profits. Refer for information about EA settings : https://docs.google.com/document/d/1cvg-qVqGrU5OaNUfd9AErpLSqYQ9gVcGd0tujWrKxFI/edit?usp=sharing Please share your experience, feedback, and trading reports. Good
FREE

Easy Backtest
Backtesting your trading strategy is the most important thing which every successful trader knows very well. Easy Backtest is the perfect solution to test your new strategy in Strategy Tester in your MT4 , using all available historical data. You can place orders: BUY , SELL , pending orders with Stop Loss and Take Profit , and you can modify them at any time. You can close orders individually or all at once, and also breakeven the same like you do it in live trading. The play b
FREE
The indicator informs when the current bar closes and a new bar opens. TIME is an important element of trading systems. BarTimerPro indicator helps you CONTROL THE TIME . Easy to use: place on the chart and set “alarms” if it necessary. In the tester, the indicator does not work. See the Lite version BarTimerPro-Lite
Key Features
4 operating modes: Shows the time elapsed since the opening of the current bar (11) Shows the time remaining until the current bar closes (11) Indicator Updates Every
FREE

Automatic trend-following Expert Advisor. Completely based on technical analysis. It opens a position at matching entry points from the indicators Top Bottom, Keltner and trend line. Martingale is not used, but it can be enabled in the settings, if necessary. Uses fixed stop loss and take profit, closes positions only by stop loss and take profit, and also by opposite signals. Automatically stops trading at the specified minimum deposit value (disabled by default). Works on the specified timefra
FREE

CCFp (Complex_Common_Frames percent) is a measure of currency strength.
Shows the total rate of change of “short-term moving average” and “long-term moving average” for each currency.
Supports eight major currencies: USD, EUR, JPY, CHF, GBP, AUD, CAD and NZD.
1). Displays the currency name at the right end of the graph.
2). You can change the display color of each currency.
3). Moving average smoothing type (ENUM_MA_METHOD) can be selected.
4). Price constant (ENUM_APPLIED_PRICE) can be c
FREE

This expert advisor trades using the famous Parabolic Sar indicator and implements many other useful features for the exigent trader, like customizable indicator and trading settings, trading sessions and a martingale feature. [ Installation Guide | Update Guide | Troubleshooting | FAQ | All Products | Get Help ] Easy to use and supervise Fully customizable parabolic sar settings Customizable break-even, SL, TP and trailing-stop Works for ECN/Non-ECN brokers Works for 2-3-4-5 digit symbols
FREE

Indicator to be placed in the same folder as Dash to activate the alert filter with Heiken Aish. After downloading the indicator, copy it to the same folder so Dash can read the indicator. It is not necessary to insert it into the chart, this is only for Dash to search for signals and inform the direction of buying and selling of the Indicator. Check if the indicator's path is correct within Dash.
FREE
The technical indicator is a more advanced version of the relative strength index (RSI) that applies moving average convergence-divergence (MACD) principles to a double-smoothed RSI (DS RSI) indicator. The indicator is derived by computing the difference between a double-smoothed RSI and a simple moving average (SMA) of the DS RSI. The indicator's intent is to provide more accurate buy and sell signals than the standard RSI calculation.
The MACD is derived by subtracting the 12-period exponen
FREE
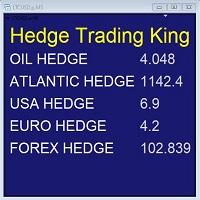
Hedge Trading Monitor is my indicator that instantly monitors the difference or ratio between two assets useful for hedge trading. How to use it + Download the indicator + Apply the indicator on an open chart + You can change the assets using the settings. Distribution + It is distributed only on MQL5.vom + Free license (FREE) - Contact me privately on MQL5.com: send me a message
FREE
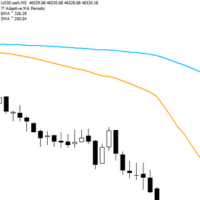
Adaptive Flow MAs is a moving average indicator designed to naturally adjust to market movements. Unlike traditional averages, it dynamically adapts its periods based on recent volatility and the current trend. The EMA closely follows rapid price swings to capture every impulse, while the SMA remains smoother, providing a stable and reliable reference. With a clean display showing the current adaptive periods, this tool helps traders feel the “flow” of the market without visual clutter. It’s cr
FREE

Introducing Momentum Jurik—an innovative indicator designed to optimize your forex trading strategy by incorporating custom moving averages based on the Momentum indicator with the MetaTrader 4 indicator, Momentum.
Jurik moving averages are renowned for their precision and reliability in analyzing price movements in the forex market. They provide traders with smoother representations of price action, reducing noise and offering clearer signals for identifying trends and potential reversals.
T
FREE
O Chart Control é um indicador que permite de forma rapida e pratica alterar o timeframe e ativo do grafico, possibilitando que voce possa fazer todas as suas analises em apenas um grafico sem precisar abrir vários, além disso voce pode escolher o entre os temas claro e escuro para o qual melhor se adapta a sua preferencia.
MT5: https://www.mql5.com/pt/market/product/109444
FREE

Информирование пользователя о величине текущего спрэда цветом, в зависимости от тренда. Простой и удобный информатор. Расположить можно в любом месте графика (настраивается во входных параметрах). При активном индикаторе наносим на график горизонтальную линию цветом, указанным во входных параметрах. Эта линия будет (по Вашему мнению) точкой разворота тренда. Если цена будет ниже линии - цвет величины спрэда будет окрашен в цвет "медвежьего" тренда, если цена буде выше линии - цвет величины спрэ
FREE
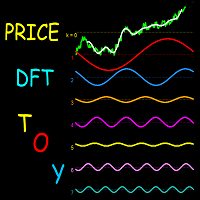
This indicator is a useful tool for visualising cyclic components in price. It calculates the Discrete Fourier Transform (DFT) of a price chart data segment selected by the user. It displays the cycles, the spectrum and the synthesised signal in a separate window. The indicator is intended as a learning tool only, being unsuitable for providing actual trade signals. Download the file - it is a free toy. Play with it to understand how signals can be transformed by controlling their cyclic comp
FREE
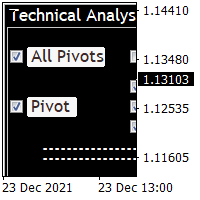
Technical Analysis 4 in 1 give you Pivot points, Resistances, Supports, Fibo, OHCL all together with any timeframe and you can back as you want in candles Pivot points have been a trading strategy for a long time. Using this method, you can understand where the market is going in a day through a few simple calculations. you can switch on/off any line you want. please check the pictures to understand more about this indicator.
FREE
Time to Trade Trading timing indicator is based on market volatility through 2 ATR indicators to determine the timing of a transaction. The indicator determines the times when the market has strong volatility in trend. When histogram is greater than 0 (blue) is a strong market, when histogram is less than 0 (yellow) is a weak market. Should only trade within histograms greater than 0. Based on the histogram chart, the first histogram value is greater than 0 and the second histogram appears, this
FREE
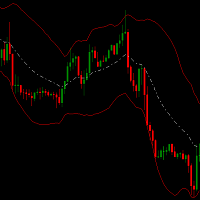
Channel hero indicator is a special channel which helps you to detect oversold/ overbought areas. It can be a complementary indicator for your strategy.
It can be combined with bollinger bands . When price breaks above bollinger bands and upper channel hero band is above bollinger band and also
the white line (middle channel hero line) is above middle BB then this point has big possibility to go up. A good closing point can be when middle channel hero line cross below middle bollinger bands.
FREE

The risk-to-reward ratio is used for assessing the potential profit (reward) against the potential loss (risk) of a trade. Stock traders and investors use the R/R ratio to fix the price at which they'll exit the trade, irrespective of whether it generates profit or loss. A stop-loss order is generally used to exit the position in case it starts moving in an opposite direction to what a trader anticipated.
The relationship between the risk and reward helps determine whether the potentia
FREE

Get This: The Ultimate Power Tool for Traders—Draw My Levels! Believe me, folks, this is BIG. This isn’t just some regular, everyday tool—this is *the* essential tool for your trading arsenal. “Draw My Levels” is a simple, elegant, and powerful script that’ll take your trading game to a whole new level. You want precision? You want control? You want to see where the real action is happening on the chart? Then this script is for you. Why Do You Need This Script? Let me tell you, if you’re a trade
FREE

SkyNet EMA is an indicator will assist you by suggesting when to go long or short based on price action and the crossings of Exponential Moving Averages such as 14 period and 50 period. Just attach it to your chart and it will monitor the asset for potential sell opportunities and if found will paint a red arrow in your chart. Also will try to find buy opportunities and if found will paint a green arrow in your chart. It could be used with any currency but majors are recommended since they will
FREE
Now there is no need to check volatility on third-party websites in order to determine the average movement rage of a certain currency pair. The Truly Volatility indicator is designed for determining volatility for the specified period and is displayed in a separate window as a histogram and line. If attached to a chart with the Н1 timeframe, the indicator displays the average price movement for each hour (from 0 to 23) based on the history data. On the D1 timeframe it displays the average movem
FREE

Traders Dynamic Index (TDI) Signal Input parameters: signal mode: set it to true if you want to plug it into STAT (Signal Tester and Trader) arrow shift: distance between fast EMA line to arrow on chart middle band filter price line filter RSI period RSI price method Volatility period MA period 1 MA period 2 Averaging method You can find the best setting for 4 hour EURUSD on this video
FREE
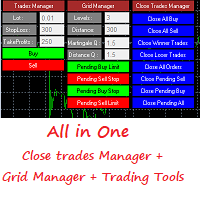
This is a demo version . Download the full version from this link https://www.mql5.com/fr/market/product/84850
Full version Allows you to : Set the number of levels (trades). Lot size and you can do Martingale to raise the lot size for each level. Set distance between levels, and you can manage the distance for each level using Distance Q. Static TP and SL for each level. You can open : BUY STOP / BUY LIMIT / SELL STOP / SELL LIMIT (levels in one click). Close all buy orders. Close all s
FREE
EMA Above Below Bid price Технический индикатор в помощь трейдеру. Данный индикатор, показывает расположение пяти ЕМА,
пяти средних скользящих, относительно цены формирующей японские свечи или бары (цена Bid ).
О понятии ЕМА.
Скользящая средняя (moving average, MA) — это дополнительная линия на графике цены актива.
Внешне она повторяет график цены, но с небольшим запозданием и более гладко, без колебаний. Основные характеристики:
1. Показывает тренды. Если скользящая устремлена ввер
FREE

The Starting Points indicator for MetaTrader 4 is a technical analysis tool that shows the monthly, weekly, and daily starting points, as well as the 1000-point and 500-point levels, in the forex market. The indicator is displayed as a series of horizontal lines that represent the starting points and levels. Benefits of Using the Starting Points Indicator Identify potential trend changes: The Starting Points indicator can help traders identify potential trend changes by highlighting areas wher
FREE
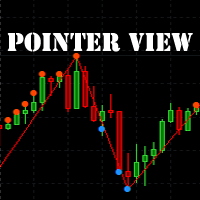
The indicator marks the points on the chart where the standard ZigZag indicator has drawn its top or bottom. With this indicator, you can easily understand where the top or bottom was formed, and where it was redrawn. The indicator gives an alert when a new point appears. Warning! Parameter Applied Price - expands the possibilities of building the indicator. It is possible to build at OPEN, CLOSE and standard HIGH/LOW prices. Input parameters ----------- Depth - period of the ZigZag ind
FREE

Bundles — Three Indicators, One Smart Grid
Bundles brings three of our tools together — the Channels, Supply & Demand and Trend indicators — into a single multi-directional system. It's a smarter take on the grid: instead of blindly adding trades, it waits for confirmation in supply and demand zones before it acts.
What it does for you Three engines in one: Channels, Supply & Demand and Trend, working together. Multi-directional grid: not the usual martingale — a structured, confirmation-based
FREE

RSI based trend strategy for EURUSD. EA use both 5 minutes and 15 minutes time frames to find trends. Please use 15m timeframe for best optimization in EURUSD pair. Inside EA, we have 10 another variables and all of them are optimized for EURUSD even starting StopLoss, Take Profit and Trailing Stop Loss values. StopLoss = 57 Take Profit = 0 TrailingStop = 0 are best optimized values. You can edit these values if they're not suitable. Invisible variables will be updated every month to
FREE

S imple arrow with alert on chart. This is NOT an entry indicator but a direction indicator. It uses MACD signal line to show you possible future direction of a trend. Please use it with other filters or confirmations to trade properly. Recommended for scalping and short term trades. Made for EURUSD M5 but it should work on every major pair on M5 timeframe. For MT5 version please go here! *If you need a fully automated trading system. Please check this EA here! FEATURES: Very simple directional
FREE

Screen logger with telegram - takes screenshots of all open MetaTrader 4 charts.
Why do you need
Recording incoming quotations from a broker. In case of any corrections, this moment will be fixed. Check the data of the indicator and notice cases of signal redrawing or overwriting Maintaining own accounting for changes in trading indicators on the account Creation of real trading video from the obtained snapshots
Advantages It consumes significantly less resources than any screen recording
FREE

EMA indicator based on BTMM In BTMM, common EMA colors include Yellow for EMA 5, Red for EMA 13, Light Blue/Aqua for EMA 50, White for EMA 200, and Dark Blue for EMA 800. These color-coded EMAs represent different market timeframes and are used to identify trends, potential reversal points, and areas of support and resistance. consist of
Yellow (Mustard): EMA 5 Red (Ketchup): EMA 13 Light Blue (Water): EMA 50 White (Mayonnaise): EMA 200 Dark Blue (Blueberry): EMA 800 White
FREE
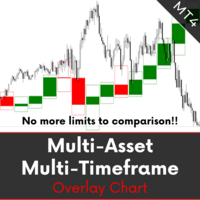
MA MTF Overlay Chart is software that allows you to overlay the candlestick chart of a financial instrument with a second candlestick chart of the same one, or of another, financial instrument, by setting a different timeframe from that of the basic chart. The software is very simple to use and the input parameters are listed below.
Input parameters: Overlay chart set-up Financial instrument : financial instrument that you want to overlay on the base chart Time period : secondary instrume
FREE

PositionPilot — One-Click Trade Manager PositionPilot puts professional trade execution and position management directly on your chart. One click — and your trade is protected. Unlike most EAs that only handle their own orders, PositionPilot works with ALL positions — manual, from other EAs, or opened via its panel. One-Click Execution BUY/SELL buttons with auto lot by risk % Hotkeys F1–F6 for keyboard-only trading Auto SL/TP with configurable ratio ️ Smart Risk Management Balance or equity-
FREE
YOU CAN NOW DOWNLOAD FREE VERSIONS OF OUR PAID INDICATORS . IT'S OUR WAY OF GIVING BACK TO THE COMMUNITY ! >>> GO HERE TO DOWNLOAD
V1 Scalper is an easy to use tool designed for trend scalping. It tries to spot good entry points in a major trend by using swing high and lows formed along the trend . This tool can be used on Fx Pairs , Indices , Commodities and stocks. Not often but in some signals , the arrow might repaint on the current candle so extra confirmation tools are advised for tr
FREE

每位交易者都熟悉这套流程:打开指标设置,改一个数字,点确定,盯着图表眯眼看半天,觉得不对,再打开设置。Relative Vigor Index 只有一个数字要设——周期——但每次想在自己的品种上把 10 和 14 做个对比,光是进出这一次对话框,仍然要付出同样的「改完再猜」的代价。RVI Live Tuner 终结了这一切。 它就是经典的双线 RVI(RVI 与它的 Signal),而且可以 直接在图表上实时调节 。图表上有一个小面板,带一个周期滑块。拖动它,两条线立即重算并重绘,全程尽在眼前。「10 还是 14」这个问题——在自己的图表上几秒钟就有答案,不必去论坛翻帖子。 真正的 RVI,不是套壳。 指标采用自己的教科书式实现:对 4 根K线做对称加权的 close-to-open 涨跌与 high-to-low 波幅,各自用周期长度的简单移动平均(SMA)平滑,两者之比即 RVI,Signal 则是对 RVI 本身再做同样的 4 根K线加权——中间不调用任何内置句柄。你调的,正是你看到的。不重绘。 还有实时样式编辑器。 用 16 色调色板和 RGB 滑块调整 RVI 线与 Sign
FREE

每个交易者都熟悉这套流程:打开指标设置、改一个数字、点击 OK、盯着图表看、觉得不对、再打开设置。如果您在 MetaTrader 4 上交易,这套流程您已经重复了很多年——而 DeMarker 依然是那个安静的超买/超卖指标,大多数交易者从来不去动它:它永远停留在默认的 0.30/0.70,因为每试一个新数值都要来回打开一次对话框。DeMarker Live Tuner 结束了这一切。 这是一个可以 直接在图表上实时调节 的 DeMarker。图表上有一个小面板,带有 DeM 周期和两条水平线(0..1 刻度)的滑块。拖动滑块,指标立刻重新计算并重绘,就在您眼前完成。0.25/0.75 还是 0.35/0.65 比默认值更适合过滤您的市场——几秒钟内就能在自己的图表上得到答案,而不用去论坛里翻帖子。 可选的 MA 信号线。 直接在面板上开启或关闭 DeMarker 的移动平均线,用独立滑块设置其周期,一个按钮循环切换计算方法——SMA、EMA、SMMA、LWMA。每一次改动都会立即反映在图表上。 真正的 DeMarker,而不是套壳。 指标采用自己干净的经典公式实现:DeMax = m
FREE

The TradingView-style hide-drawings button MT4 never had
"From the maker of Risk Sentinel — risk-first position sizing that keeps your risk fixed as you drag the stop: https://www.mql5.com/en/market/product/185979 "
Hide/Show Drawing is a one-tap chart-cleanup utility for MT5. Hide all your drawings — or just trendlines, Fibs, shapes, or text — to read raw price action, then restore everything exactly as it was, per-timeframe settings and all. Nothing is deleted; every object stays in memory
FREE
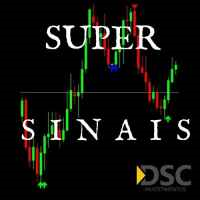
Recommended broker to use the indicator: https://tinyurl.com/5ftaha7c Indicator developed by Diogo Sawitzki Cansi to show possible trade points. Do not repaint. The results displayed in the past are exactly what happened. We also use it to hold trades longer and not get out on false reversal signals which are actually just a profit taking of trades and no one is trying to reverse the direction of the trend. Indicator Parameters: PERIOD: Period for analyzing the buying or selling force to fin
FREE

1.每月,每周和每日枢轴计算每个时期的开始和结束数据。
这在图表上提供了一条简单的线,用于识别枢轴的位置并减少计算误差。
3.即使您不了解如何计算枢轴,该指示器也将帮助非常快速地定义仪器的主要枢轴。
4.您还可以比较每周和每日的支点,以便您更好地了解价格的位置。
5该指标将帮助您更有效地交易,更接近阻力或支撑。
1. Měi yuè, měi zhōu hé měi rì shū zhóu jìsuàn měi gè shíqí de kāishǐ hé jiéshù shùjù.
Zhè zài túbiǎo shàng tígōngle yītiáo jiǎndān de xiàn, yòng yú shìbié shū zhóu de wèizhì bìng jiǎnshǎo jìsuàn wùchā.
3. Jíshǐ nín bù liǎojiě rúhé jìsuàn shū zhóu, gāi zhǐshì qì yě jiāng bāngzhù fēicháng kuàisù de dìngyì yíqì de zhǔyào shū zhóu.
4. N
FREE
ScoutFX Panel is created to make manual trading and decision making process easier for the traders who prefer manual trading. This trading panel will help you to make a market entry decision by displaying the majority of trades statistics. Using this data, trader can easily determine the market entry direction or to make corrections for used trading strategy based on statistics.
ScoutFX Panel notifies the trader about reached percent of sell or buy overtake for each instrument, via voice noti
FREE

Spread Data tool will display current spread and average spread. It will record spread for every hour (from 0 to 23) and can give better data about your broker spread. Run it for 2 days or more to get better spread data . Every spread smaller than MinSpread will be recorded as MinSpread Every spread larger than MaxSpread will be recorded as MaxSpread It help to decide what spread to be used when do backtest, EA spread settings, EA that trade in specific time interval, especially for scalping EA
FREE
Equity Curve Overlay – MT4 Equity Curve Overlay 是一款适用于 MetaTrader 4 的指标,可将账户的净值曲线直接显示在主图上,与交易品种的价格走势进行可视化对比。 主要功能: 在主图上绘制净值(Equity)曲线 实现净值与价格走势的直观对比 可调节的缩放因子与垂直偏移,用于精准对齐 可选显示前一交易日的最高价与最低价水平 输入参数: EquityScaleFactor :用于调整净值曲线与价格值匹配的缩放因子 EquityOffset :净值曲线的垂直偏移(可正可负) ShowPrevDayHighLow :是否显示前一交易日的高低点标签 ColorHighLabel 、 ColorLowLabel :高点与低点标签的颜色设置 使用场景: 本工具适用于以下用途: 在回测中可视化评估策略表现 对比净值增长与市场价格行为 提供基本参考,用于策略优化与调整 兼容性: 适用于 MetaTrader 4 平台 可在实时行情与策略测试器中使用 不会影响其他指标或 EA 的正常运行 由 LM | Trading & Development 开发
FREE

Prop Guardian Pro – Advanced Drawdown Manager With EA Killer Prop Guardian Pro is a comprehensive risk manager utility specifically designed for professional traders and Prop Firm candidates (FTMO, MFF, The5ers, etc.). It acts as a strict risk desk manager, ensuring you never violate your drawdown limits. Prop Guardian Pro goes beyond simple risk management by incorporating a "Psycho-Manager" engine. When a limit is hit, it stops trading and displays smart motivational messages to help prevent
FREE

The Night Scalper EA Lite is a fully automated Expert Advisor that trades at night and relies on price reversion. The EA trades using market orders and has the option to use time averaging to improve performance. This EA works best on EURUSD using the M5 timeframe, but will also work on AUDUSD, GBPUSD, NZDUSD, USDCAD, USDCHF and likely many more. A VPS is advisable when trading this system and a low spread and commission based broker is best. Check the comments for back test results and optimiz
FREE

Time Based Close - 自動化交易管理 EA 概述
Time Based Close 是一款功能強大且易於使用的 MetaTrader 4 (MT4) 專家顧問(EA)。它通過基於用戶設定的持倉時間自動關閉交易,並提供動態回撤控制功能來保護您的帳戶。無論您是新手還是資深交易者,這款 EA 都能簡化您的交易策略並有效管理風險。 核心功能 基於時間的關閉 :根據設定的持倉時間(預設:29 分鐘,可調整)自動關閉交易。 回撤保護 :監控並管理回撤,當回撤達到設定的百分比閾值(預設:30%)時關閉所有交易。 互動式面板 :直觀的圖表面板,可開關功能(持倉時間、回撤控制),調整設置,並實時監控餘額、淨值和回撤等數據。 贈金調整 :準確計算回撤,考慮經紀商贈金,確保精準的風險管理。 商品過濾 :支援特定商品或所有商品,兼容經紀商的後綴設置。 優勢 風險管理 :通過自動回撤控制保護您的帳戶免受過大損失。 節省時間 :基於時間自動關閉交易,無需手動監控。 易於使用 :簡單的面板設計,實時更新數據,適合各級交易者。 經紀商兼容性 :已在 IC Markets 和 Vantage Int
FREE

该指标在图表上显示重要的技术水平。 这些水平充当价格走势的支撑或阻力。
最重要的等级是 100 和 50 分的倍数。 您还可以以 25 点的倍数显示级别。
当价格达到该水平时,将显示警报或推送通知。
MT5 版本 https://www.mql5.com/zh/market/product/69740 设置 Show Levels 100 pips - 以 100 点的倍数显示水平 Show Levels 50 pips - 以 50 点的倍数显示水平 Show Levels 25 pips - 以 25 点的倍数显示水平 Color Levels 100 pips - 可被 100 点整除的级别的线条颜色 Color Levels 50 pips - 可被 50 点整除的级别的线条颜色 Color Levels 25 pips - 可被 25 点整除的级别的线条颜色 Send Alert - 发送通知 Send Push - 发送推送通知
FREE
ChartOverlay indicator has two main functions 1. mirroring - i.e. for example, it will make USDEUR from EURUSD 2. displaying the price chart of the selected financial instrument (with selected period) in the subwindow of the main chart. This tool allows traders to easily analyze the relationship between different currency pairs and assets, offering unique customization and visualization features.
Key Features: Price Chart Display: The indicator displays the price chart of the selected instrume
FREE
An EA version is being prepared. You can send a private message "notify about EA version".
EA will be versatile with many settings for trading on various indicators. The new EA will also allow trading on this indicator. For example, allowing signals after X signals/bars to X signals/bars in one direction, before changing direction. If Break Out happened before/after the signal of another indicator. Collect profit on each next signal above/below the previous one.
Send a private message "notify
FREE

this tool draws 4 groups of horizontal lines starting from a 4 prices you specify in the Inputs. you can draw Horizontal lines above or below or (both sides) the starting prices. Based on (The Quarters Theory by Ilian Yotov), this tool displays colored lines at fixed intervals which you can change from the inputs. you can use many sets of Horizontal lines each set of Horizontal lines has its own color and style.
FREE
this tool draws horizontal lines starting from a price you specify in the Inputs. you can draw Horizontal lines above or below or (both sides) the starting price. Based on (The Quarters Theory by Ilian Yotov), this tool displays colored lines at fixed intervals which you can change from the inputs. you can use many sets of Horizontal lines each set of Horizontal lines has its own color and style.
FREE

Important!!! Auto Trading must be activated! If you need to act quickly and all positions need to be closed or deleted. You drag this tool onto the chart where all open and pending orders are closed and deleted. When it has finished closing and deleting, it counts 20 ticks and the Expert Advisor automatically uninstalls itself from the chart.
Best regards and happy trading
FREE
Introducing Austin RSI—an innovative indicator designed to elevate your forex trading strategy by applying moving averages to the MetaTrader 4 indicator, RSI.
The Relative Strength Index (RSI) is a popular momentum oscillator that measures the speed and change of price movements. It oscillates between 0 and 100 and is used to identify overbought and oversold conditions in the market. Traders often use RSI to gauge the strength of price movements and anticipate potential trend reversals.
Austi
FREE

Всем привет, мои друзья, сябрыыы. Я трейдер, 20 лет опыта. Хочу продемонстрировать свой индикатор. Индикатор создан на базе в тесной кооперации с индикатором arrows_template. Данный индикатор рисует на графике инструмента (любого) индикатор AO(Awesom) поверх. Видите сам AO на графике. Видите пересечение зоны нуля, Блюдце и т.д.. Если будут подсказки, корректировки. Пишите смело, всех пошлю.......Шутка До свидания.
FREE

Простая и полезная утилита для нанесения меток на открытые сделки. При запуске скрипта он ищет все открытые сделки и наносит метки на время и цену открытия сделки. Сделки в лонг обозначаются синим цветом, сделки в шорт обозначаются красным цветом. Есть два варианта нанесения меток: - с учетом текущего спрэда (по Ask) - без учета текущего спрэда (по Bid) Входных параметров нет. Всем профита!
FREE

This pointer is supplied of a double smoothing in such way to succeed to be more reactive of a blunt Moving Average but without tracing the noises of bottom of the market. Its use will have to be exclusively turned to the search and to the identification of the trend in action (even if graphically it could seem an indicator that indicates an inversion of the prices) because the first useful signal is had to the opening of the successive bar to that one that has made to invert the sense of the
FREE
The script changes the timeframe of all open charts on the MetaTrader platform in a simple click without having to do it manually by going through all the open charts and changing them one by one, it is handy when there are many open charts. The script lets you choose which timeframe to apply to the open charts. The timeframes available in the dropdown menu are the ones already available on the MetaTrader platform : M1, M5, M15, M30, H1, H4, D1, W1, MN1.
FREE

***IMPORTANT: This free indicator works with the paid for Strong Weak Forex Expert Advisor. The EA also depends on the following custom indicators: Strong Weak Heiken Ashi Strong Weak Symbols Strong Weak Values Strong Weak Indicator Download them for free in the Market. The EA will not work without it. These are all custom indicators which the Strong Weak Forex Expert Advisor relies on to generate trading signals. If you have any problems with installation send me a message.
FREE
您知道为什么MetaTrader市场是出售交易策略和技术指标的最佳场所吗?不需要广告或软件保护,没有支付的麻烦。一切都在MetaTrader市场提供。
