Fibonacci Risk Reward Ratio
- Göstergeler
- Sürüm: 108.19
- Güncellendi: 26 Ağustos 2019
- Etkinleştirmeler: 5

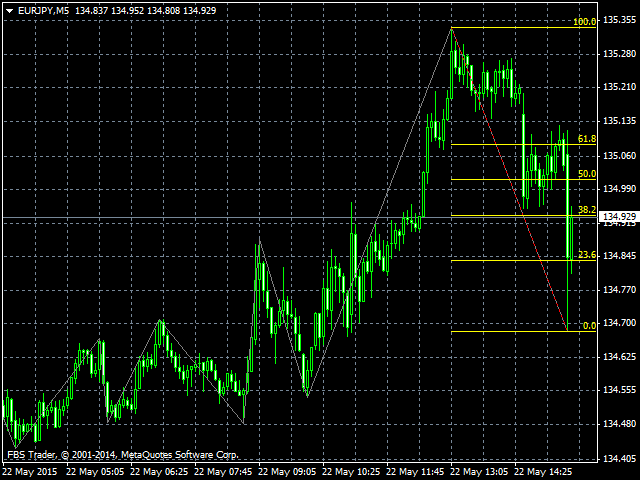
This indicator draws Fibonacci level automatically from higher high to lower low or from lower low to higher high.
With adjustable Fibonacci range and has an alert function.
How to use Fibonacci Risk Reward Ration (R3) into trading strategy
Forex traders use Fibonacci-R3 to pinpoint where to place orders for market entry, for taking profits and for stop-loss orders. Fibonacci levels are commonly used in forex trading to identify and trade off of support and resistance levels.
Fibonacci retracements identify key levels of support and resistance. Fibonacci levels are commonly calculated after a market has made a large move either up or down and seems to have flattened out at a certain price level. Traders plot the key Fibonacci retracement levels of 38.2%, 50% and 61.8% by drawing horizontal lines across a chart at those price levels to identify areas where the market may retrace to before resuming the overall trend formed by the initial large price move. The Fibonacci levels are considered especially important when a market has approached or reached a major price support or resistance level.
The 50% level is not actually part of the Fibonacci number sequence, but is included due to the widespread experience in trading of a market retracing about half a major move before resuming and continuing its trend.
The strategies Forex traders employ using Fibonacci-R3 levels include
- Buying near the 38.2% retracement level with a stop-loss order placed a little below the 50% level.
- Buying near the 50% level with a stop-loss order placed a little below the 61.8% level.
- When entering a sell position near the top of the large move, using the Fibonacci retracement levels as take profit targets.
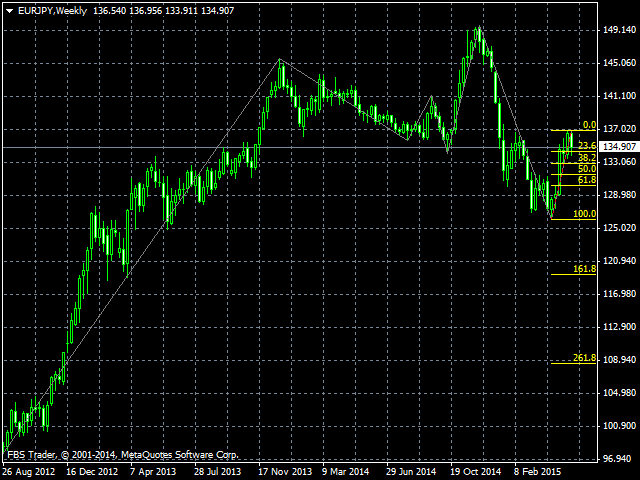
- If the market retraces close to one of the Fibonacci levels and then resumes its prior move, using the higher Fibonacci levels of 161.8% and 261.8% to identify possible future support and resistance levels if the market moves beyond the high/low that was reached prior to the retracement.
Parameters
- Depth - shift = counted bars - depth (default 12).
- Deviation - the higher/lower price deviation (default 5).
- Backstep - show entry points in history on the chart for visual analysis.
- Alert - enable/disable push alerts when price touches the Fibo area.

Fantastic indicator. High percentage of wins. Thank you