• Genel bakış
  • İncelemeler
  • Yorumlar

Qubit Trend

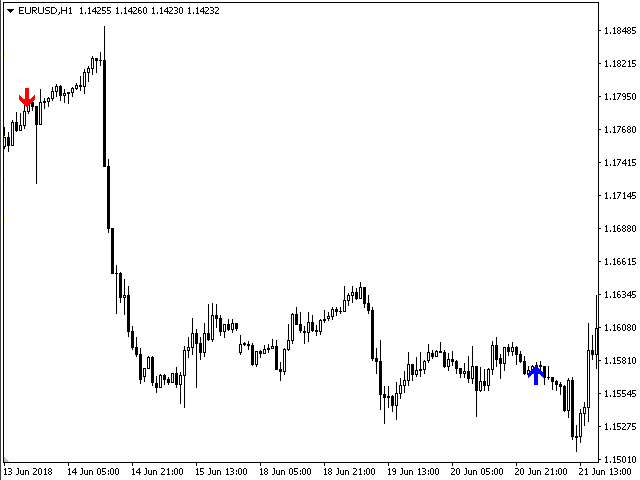
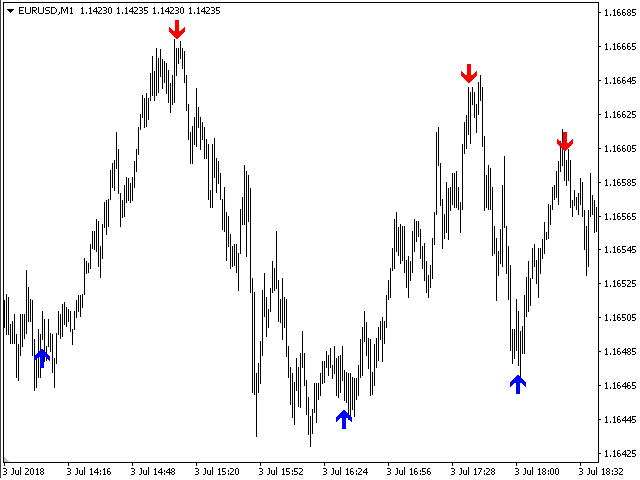
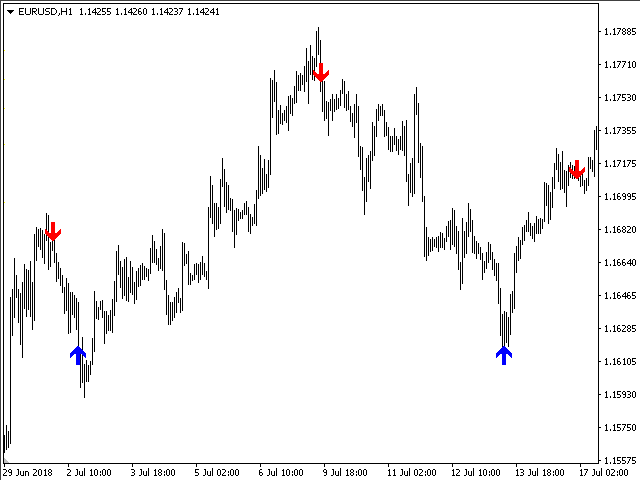
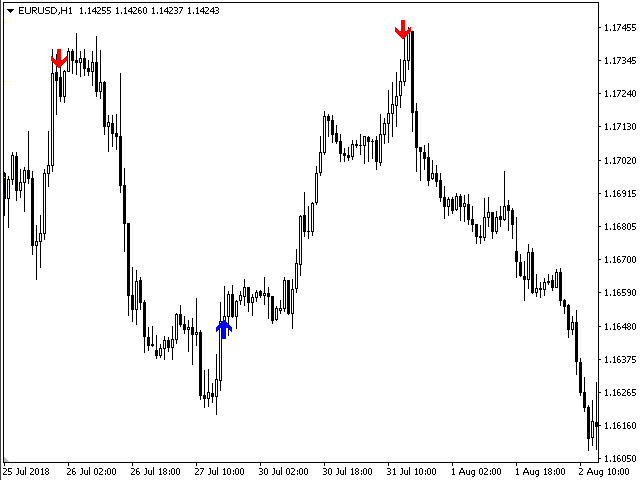
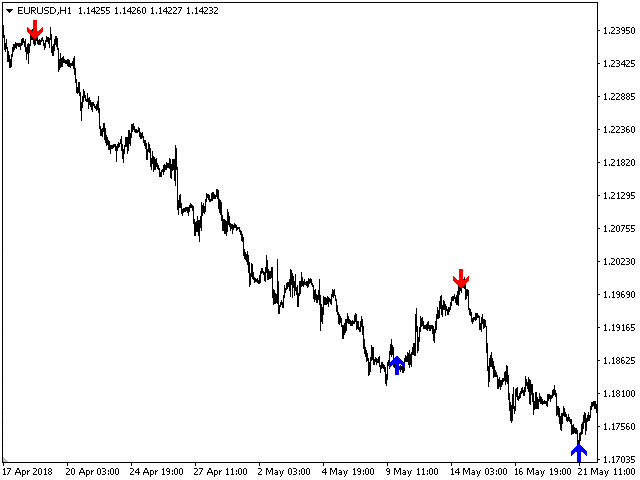
The Qubit Trend indicator works using the cyclical-wave dependence function. Thus, all entry points will be optimal points at which movement changes. Entry points should be used as potential market reversal points. The default indicator settings are quite effective most of the time. You can customize them based on your needs. But do not forget that the approach must be complex, the indicator signals require additional information to enter the market.
Önerilen ürünler
Dark Sniper
Dmitriy Kashevich
Dark Sniper arrow indicator. complete lack of redrawing percentage of correct indicator predictions from 80 85% The arrow indicates the direction of the next candle and the possible direction of the trend in the future.  suitable for small m1 timeframes. It is recommended to open deals from 1 to 2 candles. The signal appears on the last candle advantages of the indicator: 1. leading signals. 2.complete lack of redrawing 3. high signal accuracy.
Chart Patterns Detect 15 patterns (Ascending Triangle, Descending Triangle, Rising Wedge, Falling Wedge, Bullish Flag, Bearish Flag, Bullish Rectangle, Bearish Rectangle Symmetrical triangle, Head and Shoulders, Inverted Head and Shoulders, Triple top, Triple Bottom, Double Top, Double Bottom) Use historical data to calculate the probability of each pattern to succeed (possibility to filter notification according to the chance of success) gives graphic indication about the invalidation level and
Introduction Harmonic Patterns are best used to predict potential turning point. Traditionally, Harmonic Pattern was identified manually connecting peaks and troughs points in the chart. Manual harmonic pattern detection is painfully tedious and not suitable for everyone. You are often exposed under subjective pattern identification with manual pattern detection. To avoid these limitations, Harmonic Pattern Plus was designed to automate your harmonic pattern detection process. The functionality
This is a well-known ZigZag indicator. But it differs by the fact that its plot is based on values of the middle line which is set by a user. It can display Andrews’ Pitchfork and standard or Bobokus Fibo levels. NO REPAINTING. Parameters Period МА — middle line period. Default value is 34. Minimum value is 4. Maximum value is set at your discretion. Used to calculate price - base price to calculate the middle line. The averaging method - method of smoothing the middle line. Turning pitchfork
WanaScalper MT4
Isaac Wanasolo
1 (1)
A scalping indicator based on mathematical patterns, which on average gives signals with relatively small SL, and also occasionally helps to catch big moves in the markets (more information in the video) This indicator has three main types of notifications: The first type warns of a possible/upcoming signal on the next bar The second type indicates the presence of a ready signal to enter the market/open a position The third type is for SL and TP levels - you will be notified every time price r
This is an arrow indicator without a future function,developed based on the most advanced profit trading algorithms.It has the most innovative and advanced dual trend analysis module, as well as the latest and highly effective market trend prediction algorithm.Trends are your friends, and following larger trends can earn the maximum profit in foreign exchange. This indicator helps traders identify current trends and track them. Someone once made a profit of 10 times in a week by relying on it.No
Introducing the "Magic Trades" for MetaTrader 4 – your ultimate tool for precision trading in dynamic markets. This innovative indicator revolutionizes the way you perceive market trends by harnessing the power of advanced analysis to detect subtle changes in character, paving the way for optimal trading opportunities. The Magic Trades Indicator is designed to empower traders with insightful entry points and well-defined risk management levels. Through its sophisticated algorithm, this indica
Judge
Tatiana Savkevych
The Judge indicator shows potential market reversal points. The indicator shows favorable moments for entering the market. The indicator's smart algorithm detects the trend, filters out market noise and generates input signals. The indicator can be used as the main one for determining the trend. The indicator can work both for entry points and as a filter. Uses two parameters for settings. The indicator uses color signaling: blue - when changing from descending to ascending, and red - on the con
Elliott Wave Trend was designed for the scientific wave counting. This tool focuses to get rid of the vagueness of the classic Elliott Wave Counting using the guideline from the template and pattern approach. In doing so, firstly Elliott Wave Trend offers the template for your wave counting. Secondly, it offers Wave Structural Score to assist to identify accurate wave formation. It offers both impulse wave Structural Score and corrective wave Structure Score. Structural Score is the rating to sh
Discrete Line AM
Andriy Matviyevs'kyy
The presented indicator allows you to visualize the direction of the trend while cutting off minor price fluctuations. The indicator's customizable parameter (Filter) determines the number of points for the current financial instrument that the indicator cuts off in the process of determining the trend. Despite its simplicity, the indicator can be useful for both beginners and experienced traders. The indicator marks trend reversal points and can send notifications of such signals to the termina
FREE
This indicator filters the Zigzag indicator to calculate the main support and resistance levels. Variables minimum gap between peaks : is the distance (GAP) between the peaks of the Zigzag peaks sensitivity : Minimum number of nearby peaks look back: it means that it has to test the last 50 peaks in the Zigzag object name perfix: a prefix for level’s line name on chart
FREE
Trend Bilio - an arrow indicator without redrawing shows potential market entry points in the form of arrows of the corresponding color: upward red arrows suggest opening a buy, green down arrows - selling. The entrance is supposed to be at the next bar after the pointer. The arrow indicator Trend Bilio visually "unloads" the price chart and saves time for analysis: no signal - no deal, if an opposite signal appears, then the current deal should be closed. It is Trend Bilio that is considered
Overview Automated market structure identification following SMC and ICT concept, it gives an unprecedented edge on your market structure analysis by automatically identifies valid market structure using smart and powerful structure mapping mechanism: Identify impulsive and corrective moves Identify valid pullbacks built by impulsive and corrective market moves Idenitfy bearish or bullish leg and their inducements Identify valid market structure based on inducement sweep  Identify swing and int
Victorias
Andriy Sydoruk
Victoria is a trend indicator used to identify trends in financial markets, indicates the direction of price movement. Flexible indicator settings allow you to receive more accurate signals for opening positions. The indicator will allow you to determine the current trend. Using this algorithm, you can quickly understand what kind of trend is currently developing in the market. Victoria can be used along with oscillators as a filter. Victoria is a true range indicator that identifies the ra
The indicator is the advanced form of the MetaTrader 4 standard Fibonacci tool. It is unique and very reasonable for serious Fibonacci traders. Key Features Drawing of Fibonacci retracement and expansion levels in a few seconds by using hotkeys. Auto adjusting of retracement levels once the market makes new highs/lows. Ability to edit/remove any retracement & expansion levels on chart. Auto snap to exact high and low of bars while plotting on chart. Getting very clear charts even though man
Atomic Analyst
Issam Kassas
5 (1)
Öncelikle belirtmek gerekir ki bu Ticaret Göstergesi Yeniden Çizim Yapmaz, Gecikmez ve Gecikme Göstermez, bu da hem manuel hem de robot ticareti için ideal hale getirir. Atom Analisti, Piyasada Daha İyi Bir Avantaj Bulmak İçin Fiyatın Gücünü ve Momentumunu Kullanan PA Fiyat Hareketi Göstergesidir. Gürültüleri ve Yanlış Sinyalleri Kaldırmaya ve Ticaret Potansiyelini Artırmaya Yardımcı Olan Gelişmiş Filtrelerle Donatılmıştır. Birden fazla katmanlı karmaşık göstergeler kullanarak, Atom Analisti
Day Pattern
Oleksandr Martsynyshen
Description: - D ay Pattern - an indicator that helps to identify patterns of price changes for the development of trading algorithms and strategies. For whom this tool? - For developers of trading strategies and algorithms. - Medium- and long-term traders. Time frames H1-W1. Features of the indicator: - There is a function of exporting indicator values to a file of the csv format. - Using the information panel, you can conduct an express analysis of trading tool. - The indicat
POWR Rise Coming
Trade Indicators LLC
This indicator is SO SIMPLE… when the green Rise Coming arrow appears, a price drop may be on the way! Plain and easy profits! As you receive more than one 'Rise Coming' text signal in a downtrend, it means momentum is building larger for a bull run. HOW TO USE 1. When the green "Rise Coming" text appears, a price jump may be on the way! This indicator Never Repaints! To get the best setting it's a matter of tweaking the indicator until it gives you the best results. Our recommendation, and what
Fibonacci Ratio is useful to measure the target of a wave's move within an Elliott Wave structure. Different waves in an Elliott Wave structure relates to one another with Fibonacci Ratio. For example, in impulse wave: • Wave 2 is typically 50%, 61.8%, 76.4%, or 85.4% of wave 1. Fibonacci Waves could be used by traders to determine areas where they will wish to take profits in the next leg of an Up or Down trend.
Binary Options Support Resistance Indicator This indicator is designed for binary options trading and effectively shows retracements from support and resistance levels. Signals appear on the current candle. A red arrow pointing downwards indicates a potential selling opportunity, while a blue arrow pointing upwards suggests buying opportunities. All that needs adjustment is the color of the signal arrows. It is recommended to use it on the M1-M5 timeframes as signals are frequent on these timef
COG LR Osc AM
Andriy Matviyevs'kyy
The presented indicator allows you to determine potential entry points into the market and set protective orders at reasonable levels. This product can be useful for both beginners and experienced traders. The indicator is based on calculation methods proven by time and practicing traders. The indicator is calculated in two stages: At the first stage, linear regression (LR) of the selected price type is determined for a given number of chart periods. At the second stage, the obtained data is p
No idea why demo is not working. you can check the GIF to see how it works. Features With this scanner you can detect Candles which are below/above yesterday high/low lines. A pair's rectangle turns RED in dashboard if it is above the yesterday high, and rectangle turns GREEN in dashboard if it is below the yesterday low. It gives alerts in every 15m candle close. Contains a Dashboard which will help you to see all market pair's. It is possible to disable this sorting through to make it easie
Trend Ray
Andriy Sydoruk
The indicator shows the potential trend direction by cyclical-wave dependence. Thus, all the rays of the intersection will be optimal rays, in the direction of which the price is expected to move, taking into account the indicator period. Rays can be used as a direction for potential market movement. But we must not forget that the approach must be comprehensive, the indicator signals require additional information to enter the market.
Gartley Projection D
Oleksandr Medviediev
3.71 (7)
Gösterge, H.M.Gartley'in ("Borsadaki Kârlar", 1935г) gelişmelerine göre harmonik kalıpları (XABCD) tanımlar. Perspektif projeksiyonunda D noktasını bir nokta olarak yansıtır (ayarlarda ProjectionD_Mode = true değerini belirtin). Yeniden çizilmez. Çalışma zaman dilimine ait bir çubuk kapandığında, eğer belirlenen formasyon noktası Patterns_Fractal_Bars çubukları sırasında hareket etmediyse grafikte (beklenen fiyat hareketi yönünde) bir ok belirir. Bu andan itibaren ok kalıcı olarak grafikte
Limitless MT4
Dmitriy Kashevich
Limitless MT4 is a universal indicator suitable for every beginner and experienced trader. works on all currency pairs, cryptocurrencies, raw stocks Limitless MT4 - already configured and does not require additional configuration And now the main thing Why Limitless MT4? 1 complete lack of redrawing 2 two years of testing by the best specialists in trading 3 the accuracy of correct signals exceeds 80% 4 performed well in trading during news releases Trading rules 1 buy signa
Night ghost
Dmitriy Kashevich
Night Ghost - İkili opsiyonlar için ok göstergesi. Bu, gelecekte sizin için güvenilir bir yardımcıdır! - Grafikte yeniden çizim yok -Tüm döviz çiftlerinde harika çalışıyor! -%90'a varan gösterge doğruluğu (Özellikle geceleri) -Uzun süre kurulum yapmaya gerek yok (İkili Opsiyonlar için mükemmel kurulum) - Geç olmayan sinyaller - Mevcut mum üzerinde bir sinyalin görünümü -M1 dönemi için mükemmel (Artık Yok!) - Göz dostu mum rengi (Kırmızı ve Mavi) -Yüklü Uyarı Onunla çalış
The new update makes this indicator a complete tool for studying, analyzing and operating probabilistic patterns. It includes: On-chart Multi-asset percentage monitor. Configurable martingales. Twenty-one pre-configured patterns , including Mhi patterns and C3. An advanced pattern editor to store up to 5 custom patterns. Backtest mode to test results with loss reports. Trend filter. Hit operational filter. Martingale Cycles option. Various types of strategies and alerts. Confluence between patte
FiboZag
Andriy Sydoruk
Indicator FiboZag - transfer the indicator to the chart and the Fibonacci levels will be built automatically on the last ZigZag turn. The main advantage lies in the correct construction of Fibonacci levels and markup of price levels. Simple, visual and effective use. The indicator is not redrawn and does not lag. Works on all currency pairs and on all timeframes.
Simple Long Short Bar A very concise and clear indicator, very easy to understand, but it is very useful for tracking trends. The usage of this indicator is very simple: Long signal: If the price shows signs of a long market, then a yellow box will appear. Short signal: If the price shows signs of a short market, then a blue box will appear. Bull strength: If the size of the box is large, it means the bull strength is strong, and vice versa. Short strength: If the size of the box is small, it m
The indicator places Semaphore points on the maximum and minimum of a higher, medium and lower period. It includes A,B,C Triangles for easier spotting of reversal chart pattern which occurs very frequently and has a very high success ratio. Both Semaphore and A,B,C Triangles have Alerts and Push notifications to a mobile device when they occur on the chart. These indicators are very useful for breakout trading and spotting support/resistance levels which gives good opportunities for positions.
Bu ürünün alıcıları ayrıca şunları da satın alıyor
ŞU ANDA %26 INDIRIMLI Yeni Başlayanlar veya Uzman Tüccarlar için En İyi Çözüm! Bu Gösterge benzersiz, yüksek kaliteli ve uygun fiyatlı bir ticaret aracıdır çünkü bir dizi tescilli özellik ve yeni bir formül ekledik. Sadece BİR grafik ile 28 Forex çifti için Döviz Gücünü okuyabilirsiniz! Yeni bir trendin veya scalping fırsatının tam tetik noktasını belirleyebildiğiniz için ticaretinizin nasıl gelişeceğini hayal edin? Kullanım kılavuzu: buraya tıklayın Bu ilk olan, orijinal! Değersiz bir
TPSproTREND PrO
Roman Podpora
5 (15)
TPSpro TRENDPRO  - is a trend indicator that automatically analyzes the market and provides information about the trend and each of its changes, as well as giving signals for entering trades without redrawing! The indicator uses each candle, analyzing them separately. referring to different impulses - up or down impulse. Exact entry points into transactions for currencies, crypto, metals, stocks, indices!  -  Version MT5               DETAILED DESCRIPTION        /       TRADING SETUPS           
Şu anda %20 İNDİRİMLİ! Herhangi bir Acemi veya Uzman Tüccar için En İyi Çözüm! Bu gösterge paneli yazılımı 28 döviz çifti üzerinde çalışıyor. Ana göstergelerimizden 2'sine (Gelişmiş Para Birimi Gücü 28 ve Gelişmiş Para Birimi Dürtüsü) dayanmaktadır. Tüm Forex piyasasına harika bir genel bakış sağlar. Gelişmiş Para Birimi Gücü değerlerini, para birimi hareket hızını ve tüm (9) zaman dilimlerinde 28 Forex çifti için sinyalleri gösterir. Trendleri ve / veya scalping fırsatlarını belirlemek içi
Scalper Inside PRO
Alexey Minkov
4.75 (55)
SALE NOW! Limited Time Offer! An exclusive indicator that utilizes an innovative algorithm to swiftly and accurately determine the market trend. The indicator automatically calculates opening, closing, and profit levels, providing detailed trading statistics. With these features, you can choose the most appropriate trading instrument for the current market conditions. Additionally, you can easily integrate your own arrow indicators into Scalper Inside Pro to quickly evaluate their statistics and
TPSpro RFI Levels
Roman Podpora
5 (13)
A key element in trading is zones or levels from which decisions to buy or sell a trading instrument are made. Despite attempts by major players to conceal their presence in the market, they inevitably leave traces. Our task was to learn how to identify these traces and interpret them correctly. Reversal First Impulse levels (RFI)   -  Version MT5                INSTRUCTIONS                 RUS                 ENG                                       R ecommended to use with an indicator   -  
Tanıtım       Kuantum Trend Keskin Nişancı Göstergesi   , trend tersine dönmeleri belirleme ve ticaret yapma şeklinizi değiştiren çığır açan MQL5 Göstergesi! 13 yılı aşkın ticaret tecrübesine sahip deneyimli tüccarlardan oluşan bir ekip tarafından geliştirilmiştir.       Kuantum Trend Keskin Nişancı Göstergesi       trend dönüşlerini son derece yüksek doğrulukla belirlemenin yenilikçi yolu ile ticaret yolculuğunuzu yeni zirvelere taşımak için tasarlanmıştır. ***Kuantum Trend Keskin Nişancı Gö
Quantum Breakout Indicator PRO
Bogdan Ion Puscasu
4.96 (26)
Tanıtım       Quantum Breakout PRO   , Breakout Bölgeleri ile ticaret yapma şeklinizi değiştiren çığır açan MQL5 Göstergesi! 13 yılı aşkın ticaret deneyimine sahip deneyimli tüccarlardan oluşan bir ekip tarafından geliştirilen   Quantum Breakout PRO   , yenilikçi ve dinamik koparma bölgesi stratejisiyle ticaret yolculuğunuzu yeni zirvelere taşımak için tasarlanmıştır. Kuantum Breakout Göstergesi, size 5 kar hedefi bölgesi ile kırılma bölgelerinde sinyal okları ve kırılma kutusuna dayalı ol
Advanced Supply Demand
Bernhard Schweigert
4.92 (310)
CURRENTLY 26% OFF !! Best Solution for any Newbie or Expert Trader! This indicator is a unique, high quality and affordable trading tool because we have incorporated a number of proprietary features and a new formula. With this update, you will be able to show double timeframe zones. You will not only be able to show a higher TF but to show both, the chart TF, PLUS the higher TF: SHOWING NESTED ZONES. All Supply Demand traders will love it. :) Important Information Revealed Maximize the potenti
Mucizevi Forex Göstergesi Tanıtımı: Keskin Ticaretin Gücünü Serbest Bırakın Tüm zaman dilimlerinde gerçekten olağanüstü sonuçlar sunan en iyi Forex göstergesini aramaktan sıkıldınız mı? Artık aramayın! Mucizevi Forex Göstergesi, ticaret deneyiminizi devrimleştirip kazançlarınızı yeni zirvelere taşımak için burada. Gelişmiş teknoloji ve yılların özenli geliştirmesi temelinde Mucizevi Forex Göstergesi, döviz piyasasında güç ve keskinlik açısından doruğa çıkar. Bu olağanüstü araç, tüm seviyelerdeki
Entry Points Pro
Yury Orlov
4.7 (225)
Yeniden boyamadan bir ticarete girmek için doğru sinyaller sağlayan MT5 için en iyi gösterge! Herhangi bir finansal varlığa uygulanabilir: forex, kripto para birimleri, metaller, hisse senetleri, endeksler. MT5 versiyonu burada Oldukça doğru alım satım sinyalleri sağlayacak ve bir alım satımı açıp kapatmanın en iyi zamanını size söyleyecektir. Göstergeyi ödeyen yalnızca bir sinyali işleme örneğiyle videoyu (6:22) izleyin! Çoğu tüccar, Giriş Noktaları Pro göstergesinin yardımıyla ilk işl
TrendMaestro
Stefano Frisetti
5 (2)
note: this indicator is for METATRADER4, if you want the version for METATRADER5 this is the link: TRENDMAESTRO recognizes a new TREND in the bud, he never makes mistakes. The certainty of identifying a new TREND is priceless. DESCRIPTION TRENDMAESTRO identifies a new TREND in the bud, this indicator examines the volatility, volumes and momentum to identify the moment in which there is an explosion of one or more of these data and therefore the moment in which prices have strong probability of f
FX Power MT4 NG
Daniel Stein
5 (8)
Sabah Brifingimiz burada mql5 ve on Telegram! FX Power MT4 NG , uzun zamandır çok popüler olan döviz gücü ölçerimiz FX Power'ın yeni neslidir. Peki bu yeni nesil güç ölçer ne sunuyor? Orijinal FX Power hakkında sevdiğiniz her şey PLUS GOLD/XAU güç analizi Daha da hassas hesaplama sonuçları Ayrı ayrı yapılandırılabilir analiz dönemleri Daha da iyi performans için özelleştirilebilir hesaplama limiti Özel çokluDaha fazlasını görmek isteyenler için örnek ayarlar Her grafikte en sevdiğiniz renkler i
Price Action Entry Alerts
Stephen Sanjeeve Sahayam
5 (3)
Bu gösterge, alış veya satış baskısı için her çubuğu tarar ve en yüksek hacme sahip 4 tip mum modelini tanımlar. Bu mumlar daha sonra Alış veya Satış sinyallerini göstermek için birkaç doğrusal filtre kullanılarak filtrelenir. Sinyaller, daha yüksek zaman çerçevesi yönüyle bağlantılı olarak ve yüksek hacimli saatlerde alım satım yapıldığında en iyi sonucu verir. Tüm filtreler özelleştirilebilir ve bağımsız çalışır. Bir düğmeyi tıklayarak tek bir yönün sinyallerini görüntüleyebilir. Bu gösterge
FX Volume
Daniel Stein
4.6 (35)
Sabah Brifingimiz aracılığıyla ayrıntılar ve ekran görüntüleri ile günlük piyasa güncellemenizi alın burada mql5 ve on Telegram ! FX Volume, bir brokerin bakış açısından piyasa duyarlılığı hakkında GERÇEK bir fikir veren İLK ve TEK hacim göstergesidir. COT raporlarından çok daha hızlı bir şekilde, brokerlar gibi kurumsal piyasa katılımcılarının Forex piyasasında nasıl konumlandıklarına dair harika bilgiler sağlar. Bu bilgileri doğrudan grafiğinizde görmek, ticaretiniz için gerçek oyun değiştir
How to use Pair Trading Station Pair Trading Station is recommended for H1 time frame and you can use it for any currency pairs. To generate buy and sell signal, follow few steps below to apply Pair Trading Station to your MetaTrader terminal. When you load Pair Trading Station on your chart, Pair Trading station will assess available historical data in your MetaTrader platforms for each currency pair. On your chart, the amount of historical data available will be displayed for each currency pai
Cycle Sniper
Elmira Memish
4.4 (35)
NEW YEAR SALE PRICE FOR LIMITED TIME!!! Please contact us after your purchase and we will send you the complimentary indicators to complete the system Cycle Sniper is not a holy grail but when you use it in a system which is explained in the videos, you will feel the difference. If you are not willing to focus on the charts designed with Cycle Sniper and other free tools we provide, we recommend not buying this indicator. We recommend watching the videos about the indiactor and system before pu
Precision Index Osilatörü (Pi-Osc) - Precision Trading Systems'dan Roger Medcalf Sürüm 2, grafiklerinizde hızlı bir şekilde yüklenmek üzere dikkatle yeniden kodlandı ve deneyimi artırmak için bazı teknik geliştirmeler de içerdi. Pi-Osc, herkesin stoplarını almak için zorlanan pazarların gitmek zorunda kaldığı aşırı yorgunluk noktalarını bulmak için tasarlanmış doğru ticaret zamanlama sinyalleri sunmak amacıyla oluşturuldu. Bu ürün, aşırı noktaların nerede olduğunu bilmek gibi yaşlı bir so
TakePropips Donchian Trend Pro
Eric John Pajarillaga Aldana
4.82 (17)
TakePropips Donchian Trend Pro   (MT4), Donchian Kanalı'nı kullanarak trendin yönünü otomatik olarak tespit eden ve size ticarete giriş ve çıkış sinyalleri sağlayan güçlü ve etkili bir araçtır! Bu çok işlevli gösterge, bir trend tarayıcı, ticaret sinyalleri, istatistiksel panel, tarayıcı, ticaret oturumları ve uyarı geçmişi panosu içerir. Size ticaret sinyalleri sağlamak ve çizelgeleri analiz ederek saatlerce tasarruf etmenizi sağlamak için tasarlanmıştır! Kullanım kılavuzunu ve kurulum kılavuzu
GOLD Impulse with Alert
Bernhard Schweigert
4.56 (9)
Bu gösterge, 2 ürünümüz Advanced Currency IMPULSE with ALERT  +   Currency Strength Exotics  'in süper bir kombinasyonudur. Tüm zaman dilimleri için çalışır ve 8 ana para birimi artı bir Sembol için grafiksel olarak güç veya zayıflık dürtüsünü gösterir! Bu Gösterge, Altın, Egzotik Çiftler, Emtialar, Endeksler veya Vadeli İşlemler gibi herhangi bir sembol için para birimi gücü ivmesini göstermek için uzmanlaşmıştır. Türünün ilk örneğidir, Altın, Gümüş, Petrol, DAX, US30, MXN, TRY, CNH vb.
Precision Divergence Finder, Precision Trading Systems tarafından piyasa diplerini kesinlikle ve sıkça bulmak amacıyla tasarlandı. Teknik analizde, dipleri seçme sanatı genellikle zirveleri seçmekten çok daha kolaydır ve bu ürün tam olarak bu görev için tasarlandı. Boğa ayrıştırması tanımlandıktan sonra alım yapmadan önce trendin yukarı dönmesini beklemek mantıklıdır. Bir giriş yapmak için 10 veya 20 çubuk yüksekliği kullanabilir veya trend değişikliğini belirlemek için yükselen bir 15-30 har
Roger Medcalf tarafından geliştirilen PTS Divergence Finder Satış Göstergesi - Precision Trading Systems. Bu gösterge yalnızca Ayı - Satış İşaretleri vermektedir. Öncelikle, neden birçok yıl boyunca alım sinyali farklılaşma bulucu sağlarken satış farklılaşma göstergesi sağlamadığımı birçok kez sordular. Cevabım, satış farklılaşmalarının alım farklılaşmalarından daha güvenilir olmadığı yönündeydi, ki bu hala doğrudur. Bunu değiştirmek için bazı çözümler bulundu, ancak bunlar daha katı varsayılan
TPA True Price Action indicator reveals the true price action of the market makers through 100% non-repainting signals (except early signals mode) strictly at the close of a candle! TPA shows entries and re-entries, every time the bulls are definitely stronger than the bears and vice versa. Not to confuse with red/green candles. The shift of power gets confirmed at the earliest stage and is ONE exit strategy of several. There are available now two free parts of the TPA User Guide for our custo
Indicator : RealValueIndicator Description : RealValueIndicator is a powerful tool designed specifically for trading on the EURUSD pair. This indicator analyzes all EUR and USD pairs, calculates their real currency strength values, and displays them as a single realistic value to give you a head start on price. This indicator will tell you moves before they happen if you use it right. RealValueIndicator allows you to get a quick and accurate overview of the EURUSD currency pair tops and bottoms,
XQ Indicator MetaTrader 4
Marzena Maria Szmit
3 (2)
Step into the realm of Forex trading with confidence and precision using XQ, a cutting-edge Forex indicator designed to elevate your trading game to unprecedented heights. Whether you're a seasoned trader or just stepping into the world of currency exchange,   XQ Forex Indicator   empowers you with the insights and signals needed to make informed trading decisions. The signal conditions are a combination of three indicators, and XQ Forex Indicator only display  medium and long-term trends . The
Sizlere ON Trade Waves Patterns Harmonic Elliot Wolfe'u tanıtmaktan mutluluk duyarız. Bu, manuel ve otomatik yöntemleri kullanarak piyasada çeşitli desenleri tespit etmek için tasarlanmış gelişmiş bir göstergedir. İşte nasıl çalıştığı: Harmonik Desenler: Bu gösterge, grafiğinizde görünen harmonik desenleri tanımlayabilir. Bu desenler, Scott Carney'in "Harmonic Trading vol 1 & 2" adlı kitabında açıklandığı gibi harmonik ticaret teorisini uygulayan tüccarlar için önemlidir. Onları manuel olarak ç
Currency Strength Exotics
Bernhard Schweigert
4.88 (33)
ŞU ANDA %20 INDIRIMLI! Herhangi bir Acemi veya Uzman Tüccar için En İyi Çözüm! Bu Gösterge, Egzotik Çiftler Emtialar, Endeksler veya Vadeli İşlemler gibi herhangi bir sembol için para birimi gücünü göstermek için uzmanlaşmıştır. Türünün ilk örneğidir, Altın, Gümüş, Petrol, DAX, US30, MXN, TRY, CNH vb. gerçek para birimi gücünü göstermek için 9. satıra herhangi bir sembol eklenebilir. Bu benzersiz, yüksek kaliteli ve uygun fiyatlı bir ticaret aracıdır çünkü bir dizi tescilli özelliği ve yeni
Royal Scalping Indicator M4
Vahidreza Heidar Gholami
4.17 (6)
Royal Scalping Indicator is an advanced price adaptive indicator designed to generate high-quality trading signals. Built-in multi-timeframe and multi-currency capabilities make it even more powerful to have configurations based on different symbols and timeframes. This indicator is perfect for scalp trades as well as swing trades. Royal Scalping is not just an indicator, but a trading strategy itself. Features Price Adaptive Trend Detector Algorithm Multi-Timeframe and Multi-Currency Trend Low
Gartley Hunter Multi MT4
Siarhei Vashchylka
4.67 (3)
Gartley Hunter Multi - An indicator for searching for harmonic patterns simultaneously on dozens of trading instruments and on all classic timeframes: (m1, m5, m15, m30, H1, H4, D1, Wk, Mn). Manual (Be sure to read before purchasing) | Version for MT5 Advantages 1. Patterns: Gartley, Butterfly, Shark, Crab. Bat, Alternate Bat, Deep Crab, Cypher 2. Simultaneous search for patterns on dozens of trading instruments and on all classic timeframes 3. Search for patterns of all possible sizes. Fr
Supply and Demand Dashboard PRO
Bernhard Schweigert
4.82 (22)
Şu anda %20 İNDİRİMLİ! Bu gösterge paneli, birden fazla sembol ve 9 zaman dilimine kadar çalışan çok güçlü bir yazılım parçasıdır. Ana göstergemize dayanmaktadır (En iyi yorumlar: Advanced Supply Demand ).     Gösterge paneli harika bir genel bakış sağlar. Gösterir:    Bölge mukavemet derecesi dahil filtrelenmiş Arz ve Talep değerleri, Bölgelere/ve bölgeler içindeki pip mesafeleri, İç içe geçmiş bölgeleri vurgular, Tüm (9) zaman dilimlerinde seçilen semboller için 4 çeşit uyarı verir. Kişis
RelicusRoad Pro
Relicus LLC
4.78 (139)
Şimdi 147 $ (birkaç güncellemeden sonra 499 $ 'a yükseliyor) - Sınırsız Hesaplar (PC'ler veya Mac'ler) RelicusRoad Kullanım Kılavuzu + Eğitim Videoları + Özel Discord Grubuna Erişim + VIP Durumu PİYASAYA BAKMAK İÇİN YENİ BİR YOL RelicusRoad, forex, vadeli işlemler, kripto para birimleri, hisse senetleri ve endeksler için dünyanın en güçlü ticaret göstergesidir ve yatırımcılara kârlı kalmaları için ihtiyaç duydukları tüm bilgileri ve araçları sağlar. Başlangıç ​​seviyesinden ileri seviyey
Yazarın diğer ürünleri
Trend Anthropoid is a trend indicator that allows you to effectively determine the direction of the current trend, as well as identify potential reversal points. The indicator makes it possible to classify the direction of price movement by determining its strength. Solving this problem helps to enter the market on time and get the desired result. Let's start with the benefits. Allows you to determine the current trend. You can quickly understand which trend is currently developing in the mar
The Trend Logic indicator provides an opportunity to classify the direction of price movement by determining its strength. Solving this problem helps to enter the market on time and make a good profit. It is extremely important for any trader to correctly determine the direction and strength of the trend movement. Unfortunately, there is no single correct solution to this problem. Many traders trade at different time frames. For this reason, the received signals are perceived subjectively. The
The Trend Goblin indicator identifies the mainstream trend. They help to analyze the market on a selected time frame. Easy to set up and works on all pairs and all time frames. Trend indicators provide an opportunity to classify the direction of price movement by determining its strength. Solving this problem helps investors enter the market on time and get good returns. It is extremely important for any trader to correctly determine the direction and strength of the trend movement. Unfortuna
Adapter
Yvan Musatov
Индикатор Adapter определяет господствующую тенденцию, помогает анализировать рынок на выбранном временном интервале. Прост в настройке и работает на всех парах и всех временных интервалах. Индикаторы тренда дают возможность классифицировать направление ценового движения, определив его силу. Решение этой проблемы помогает инвесторам вовремя войти в рынок и получить хорошую отдачу. Для любого трейдера крайне важно правильно определить направление и силу трендового движения. К сожалению, единст
The Analytical Trend indicator can track sustained price movement in a specific direction. In this case, the movement itself can be downward, upward or sideways, when the market movement does not have a pronounced direction. The indicator works on the basis of two moving averages and an oscillator. Using the signal search algorithm, the indicator generates signals in the form of arrows. Flexible settings allow you to receive more accurate signals for opening positions. You can quickly understan
The Supernatural channel is determined using a special algorithm, marker points are used to determine the movement of the channel. The Supernatural channel consists of two lines, red and blue, that make up the channel. Simple, visual and efficient use. Can be used for intra-channel trading. The indicator does not redraw and does not lag. Works on all currency pairs and on all timeframes.
Channel Oscillations is a non-redrawing channel indicator based on moving averages. The key difference between the Channel Oscillations indicator and other channel indicators is that Channel Oscillations does not take into account simple moving averages, but double-smoothed ones, which, on the one hand, makes it possible to more clearly determine the market movement, and on the other hand, makes the indicator less sensitive.
Introducing the Diogenes trend indicator! The indicator analyzes market dynamics for pivot points. Shows favorable moments for entering the market in stripes. The principle of operation of the indicator is to automatically determine the current state of the market when placed on a chart. Ready-made trading system. Can be used as a channel indicator or level indicator! This indicator allows you to analyze historical data and, based on them, display instructions for the trader for further actio
The Trend Champion indicator works on all timeframes and currency pairs. The indicator should be used as an auxiliary tool for technical analysis, it helps to determine the direction of the trend: either upward or downward price movement for a particular currency pair. Can be used along with oscillators as filters. Trend Champion is a trend indicator. Arrows indicate favorable moments and directions for entering the market. The indicator can be used both for pipsing on small periods and for l
The regression channel is one of the most popular technical analysis tools among traders. First, the indicator draws a trend line between two points, then on its basis it builds a channel of two parallel lines, which will be at the same distance from the regression line. The term linear regression belongs to the field of statistics. The center line of the channel is the trend line. To calculate it, the least squares method is used. The line above the center line acts as resistance for the pri
Control Shot - Unique indicator for identifying trends. The new system adapts to the market, eliminates additional conditions and copes with its task. A revolutionary new way to identify the start of a trend early. The trend indicator, shows signals, can be used with an optimal risk ratio. It uses reliable algorithms in its calculations. Shows favorable moments for entering the market with arrows, that is, using the indicator is quite simple. Tired of adjusting the indicator settings, wasting
Planned transition is a trend indicator that will help a trader to determine the direction of trade. The indicator has a complex algorithm of work. But for the user, only two lines remain, the red line indicates a sell trend, and the blue line indicates a buy trend. Thus, it is quite simple to interpret the indicator signals. The indicator works on different timeframes; to work with lower timeframes, it is recommended to decrease the indicator period for more frequent entries. To work on higher
Modify Trend - Unique indicator for identifying trends. The indicator has a complex algorithm of work. But for the user there are only two colors of arrows, red indicates a sell trend, blue indicates a buy trend. Thus, it is quite easy to interpret the indicator signals. The indicator works on different timeframes; to work with lower timeframes, it is recommended to decrease the indicator period for more frequent entries. To work on higher timeframes, on the contrary, increase. The new system ad
Just download the Quarter Strike indicator and embrace your dream. Trading within the volatility range has always attracted traders, because most often it is simple instruments that turn out to be the most profitable. The Quarter Strike indicator is a variant of constructing a price channel that gives signals of sufficiently high accuracy on any instruments and time periods. Bias or other additional parameters are not applied, that is, the indicator evaluates only the real dynamics. By defaul
The Trinity indicator will tell you whether you have configured the indicator correctly, while you can specify the history interval in the bars that interests you. Look at the numbers on the chart near the arrows! These are pips of profit from a series of entries on the indicator. Profit pips are calculated at the specified interval. The signal can be read without any problems by any bot. Trading within the volatility range has always attracted traders, because most often it is simple instrumen
Spv
Yvan Musatov
The SPV indicator clearly reflects the cyclical nature of the market. Just one key setting! If it is equal to one, then a fast cycle is displayed, but if, for example, the parameter is 12, then the indicator looks for a cycle in the last 12 bars. You can see the ups and downs of the indicator alternate and have such dependence on the market, which can be used to draw conclusions to predict price behavior. Also, indicators can be combined with each other. Also, the indicator can indicate the qual
The SPV Cross indicator is based on the SPV  indicator. Works as two indicators together on the same chart. With different settings, you can react to the intersection of lines. Clearly reflects the cyclical nature of the market. Just two key settings! It works on the basis of the principle - one is fast and the other is slow. You can see the ups and downs of the indicator alternate and have such a relationship with the market, which can be used to draw conclusions to predict price behavior. The
The SPV Corr indicator displays the average percentage correlation between the bar's body and its shadows. A very effective system for building various filters and market entry confirmations. It fixes cyclicality and can be used in trading in different ways. You can see the ups and downs of the indicator alternate and have such a relationship with the market, which can be used to draw conclusions to predict price behavior. Also, indicators can be combined with each other. The value of the indica
The SPV Body indicator displays the average analysis of the intersection of adjacent bars. The indicator can easily detect unusual market movements which can be used as a filter. For clarity, poke the graphs to the very beginning of the history when the bars were incomplete, and the indicator will easily display this anamaly. A very effective system for building various filters and confirmations of market entry, to exclude anomalies from trading. It also fixes cyclicity, it turns out that the in
The SPV Volatility indicator is one of the most effective filters. Volatility filter. Shows three volatility options. The so-called limit, real, and the last most effective filter for the filter is the percentage filter. Percentage display of folatility shows the ratio of limit to real volatility. And thus, if we trade in the middle of the channel, then it is necessary to set a condition that the percentage is less than a certain indicator value. If we trade on the channel breakout - following t
Mastodon - displays potential market entry points. According to the wave theory, Mastodon displays the course of a large wave, while the oscillator can specify the entry point, that is, catch the price movement inside it, i.e. small “subwaves”. By correctly understanding the wave nature of price movements and using the Mastodon indicator in conjunction with an oscillator, you can create your own trading system, for example, entering the market after a large wave has formed and then exiting wh
The advantage of working with the Gladiator signal indicator is that the trader does not need to conduct technical analysis of the chart on his own. The tool generates ready-made signals in the form of directional arrows. The indicator is considered effective as it does not redraw its signals. This tool is an arrow (signal) one and works without redrawing. Its signals are based on a robust algorithm. Gladiator does not change its readings. Daily and session ranges can be useful for confirming
Signal Casablanca - Arrow technical indicator in the Forex market without redrawing. Able to give hints with minimal errors. It combines several filters, displaying market entry points with arrows on the chart. You can note the accuracy and clarity of the signals of this pointer indicator. Having seen a signal to buy, a trader opens an order without expecting that after a while the initial hint may change to the completely opposite one or simply disappear, having lost its relevance. The signal w
Fargo
Yvan Musatov
Fargo does not change its readings, it is a technical indicator in the Forex market without redrawing. It combines several filters to display market entry arrows on the chart. You can note the accuracy and clarity of the signals of this pointer indicator. When a suitable moment for buying appears, the indicator generates a signal exactly at the moment of its appearance and not below or above the current candle. The arrow will be exactly at the price where the signal appears and will not change
Trend Expert. It works by entering the market with only one buy order and another sell order. It does not form a series of rendering, and therefore you can work with them starting from $ 100! Which is great for beginners. To enter, it uses a system of indicators and a system of dynamic correction of stops depending on volatility, which can be disabled in the settings, but in this case, you will significantly reduce the efficiency of the bot. The bot implements a money management system, which c
Catch
Yvan Musatov
Catch is a reversal indicator and is part of a special category of instruments. it not only analyzes the price movement, but also indicates the points of possible reversals. This facilitates fast and optimal opening of buy or sell orders (depending on the current situation). In this case, the historical data of the analyzed asset must be taken into account. It is the correct execution of such actions that largely helps traders to make the right decision in time and get a profit.
Matios
Yvan Musatov
The Matios indicator visually unloads the price chart and saves analysis time: no signal - no deal, if an opposite signal appears, then the current deal should be closed. This is an arrow indicator for determining the trend. According to the wave theory, Matios displays the course of the wave, while the oscillator can specify the entry point, that is, catch the price movement inside it, i.e. small “subwaves”. By correctly understanding the wave nature of price movements and using the Matios i
Sting
Yvan Musatov
Sting implements indicator technical analysis and allows you to determine the state of the market in the current period and make a decision on a deal based on certain signals. Sting is the result of mathematical calculations based on data on prices and trading volumes. Sting creates signals to perform operations on strong trend movements; it is more expedient to use it for trading when the trend is weakening or sideways. It is used as an additional one, regardless of the phase of the trend mo
Labyrinth - Trend Expert Advisor. It works by entering the market in lots of buy and sell. It does not form a series of rendering, and therefore you can work with them starting from $ 1000! Which is great for beginners. The bot implements a money management system, which consists in a competent calculation of the risk depending on the deposit. For the correct calculation of the volume, you need to specify the base deposit for calculating the risk. By default, we are talking about a $ 1000 depos
Haine
Yvan Musatov
Haine is a reversal indicator that is part of a special category of instruments. The indicator not only analyzes the price movement, but also indicates the points of possible reversals. This facilitates fast and optimal opening of buy or sell orders (depending on the current situation). In this case, the historical data of the analyzed asset must be taken into account. It is the correct execution of such actions that largely helps traders to make the right decision in time and get a profit. T
Filtrele:
İnceleme yok
İncelemeye yanıt