Trigger Cash

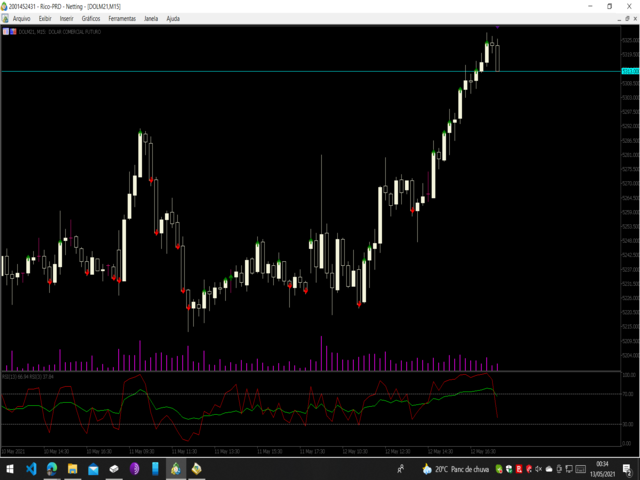
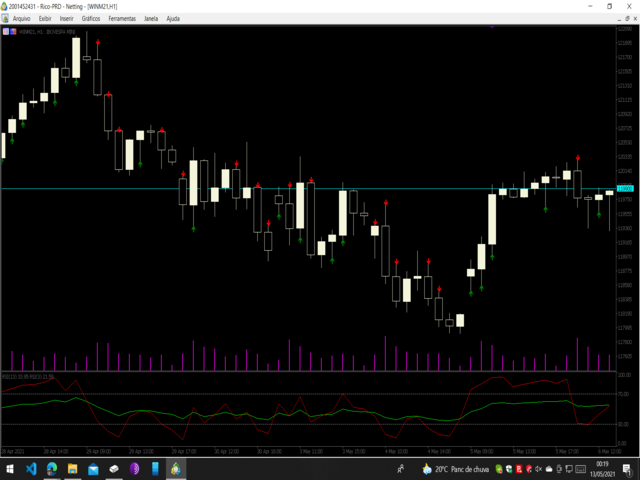
Triggers are business rules that you define for immediate execution after tickets are created or updated. For example, a trigger can be used to notify the customer when a ticket has been opened. The other can be created to notify the customer when the ticket is resolved. This program indicates to the user when a trend reversal trigger is triggered. This program gave me a lot of comfort in my trades on the mini index. Take the free back-test !! Thanks in advance for your attention!


Önerilen ürünler
Was: $249  Now: $99   Market Profile defines a number of day types that can help the trader to determine market behaviour. A key feature is the Value Area, representing the range of price action where 70% of trading took place. Understanding the Value Area can give traders valuable insight into market direction and establish the higher odds trade. It is an excellent addition to any system you may be using. Inspired by Jim Dalton’s book “Mind Over Markets”, this indicator is designed to suit the
L'indicatore SMC Venom Model BPR è uno strumento professionale per i trader che operano nell'ambito del concetto di Smart Money (SMC). Identifica automaticamente due modelli chiave sul grafico dei prezzi: FVG   (Fair Value Gap) è una combinazione di tre candele, in cui c'è un gap tra la prima e la terza candela. Forma una zona tra livelli in cui non c'è supporto di volume, il che spesso porta a una correzione dei prezzi. BPR   (Balanced Price Range) è una combinazione di due modelli FVG che for
ProEngulfing'in ücretsiz versiyonu, QualifiedEngulfing, günde bir sinyal sınırlaması ve daha az özellik sunmaktadır. Koala Trading Solution kanalına MQL5 topluluğunda katılmak için, tüm Koala ürünleri hakkında en son haberleri öğrenmek için aşağıdaki bağlantıyı kullanın: https ://www .mql5 .com /en /channels /koalatradingsolution Bu ürünün MT4 versiyonu aşağıdaki bağlantıdan indirilebilir: https ://www .mql5 .com /en /market /product /52023 ProEngulfing Tanıtımı – MT4 için Profesyonel Engulfing
Based on the trading model/strategy/system of gold double-position hedging and arbitrage launched by Goodtrade Brokers, problems encountered in daily operations: 1. Account B immediately places an order immediately following account A. 2: After account A places an order, account B will automatically copy the stop loss and take profit. 3: Account A closes the position of Account B and closes the position at the same time. 4: When account B closes the position, account A also closes the position.
Weis Wave Scouter
Jean Carlos Martins Roso
MetaTrader 5 için geliştirilen Weis Wave Scouter ile gelişmiş hacim analizinin gücünü keşfedin! Bu devrim niteliğindeki gösterge, Wyckoff yönteminin ve Hacim Yayılımı Analizinin (VSA) kanıtlanmış ilkelerini birleştiriyor. Operasyonlarında doğruluk ve derinlik arayan yatırımcılar için tasarlanmıştır ve kümülatif hacim dalgası analizi yoluyla piyasanın taktiksel bir okumasını sunar. Weis Wave Scouter, Classic, NightVision ve OceanBreeze gibi özelleştirilebilir renk temaları ile renkli histogramlar
Your Trend Friend
Luigi Nunes Labigalini
5 (1)
The trend is your friend! Look at the color of the indicator and trade on that direction. It does not  repaint. After each candle is closed, that's the color of the trend. You can focus on shorter faster trends or major trends, just test what's most suitable for the symbol and timeframe you trade. Simply change the "Length" parameter and the indicator will automatically adapt. You can also change the color, thickness and style of the lines. Download and give it a try! There are big movements w
Unlock key market insights with automated support and resistance lines Tired of plotting support and resistance lines? This is a multi-timeframe indicator that detects and plots supports and resistance lines in the chart with the same precision as a human eye would. As price levels are tested over time and its importance increases, the lines become thicker and darker, making price leves easy to glance and evaluate. [ Installation Guide | Update Guide | Troubleshooting | FAQ | All Products ] Boos
Ortalama geri dönüş ticareti için profesyonel ve nicel bir yaklaşım uygulayan benzersiz gösterge. Fiyatın tahmin edilebilir ve ölçülebilir bir şekilde ortalamaya döndüğü ve yön değiştirdiği gerçeğinden yararlanır, bu da nicel olmayan ticaret stratejilerinden büyük ölçüde daha iyi performans gösteren net giriş ve çıkış kurallarına izin verir. [ Installation Guide | Update Guide | Troubleshooting | FAQ | All Products ] Ticaret sinyallerini temizle Ticaret yapmak inanılmaz derecede kolay Özelleşt
Delta Profile Volume
Teresinha Moraes Correia
Technical Description of the Indicator – Delta Profile for MetaTrader 5 The Delta Profile is an indicator developed for MetaTrader 5 focused on detailed analysis of volume flow within a defined range of candles. It organizes and displays information about the imbalance of positive volumes (associated with upward movements) and negative volumes (associated with downward movements) at different price levels. The result is a clear view of the chart points where the highest concentration of trades o
Premium seviye, %80'den fazla doğru tahmin doğruluğuna sahip benzersiz bir göstergedir! Bu gösterge en iyi Ticaret Uzmanları tarafından iki aydan uzun süredir test edilmiştir! Yazarın göstergesini başka hiçbir yerde bulamazsınız! Ekran görüntülerinden bu aracın doğruluğunu kendiniz görebilirsiniz! 1, sona erme süresi 1 mum olan ikili opsiyon ticareti için harikadır. 2 tüm döviz çiftleri, hisse senetleri, emtialar, kripto para birimleri üzerinde çalışır Talimatlar: Kırmızı ok göründüğü an
Support & Resistance indicator is a modification of the standard Bill Williams' Fractals indicator. The indicator works on any timeframes. It displays support and resistance levels on the chart and allows setting stop loss and take profit levels (you can check the exact value by putting the mouse cursor over the level). Blue dashed lines are support level. Red dashed lines are resistance levels. If you want, you can change the style and color of these lines. If the price approaches a support lev
Supply and Demand Indicator + FREE Currency Strength Meter ADD-ON Looking for a powerful tool that can help you identify the most reactive zones in the forex market? Our supply and demand indicator for MetaTrader 4 and 5 is exactly what you need. With its advanced algorithms and real-time analysis, this indicator helps traders of all experience levels make informed trading decisions. The supply and demand indicator is a cutting-edge tool that helps traders identify areas where buyers and sellers
Trade smarter, not harder: Empower your trading with Harmonacci Patterns This is arguably the most complete harmonic price formation auto-recognition indicator you can find for the MetaTrader Platform. It detects 19 different patterns, takes fibonacci projections as seriously as you do, displays the Potential Reversal Zone (PRZ) and finds suitable stop-loss and take-profit levels. [ Installation Guide | Update Guide | Troubleshooting | FAQ | All Products ] It detects 19 different harmonic pri
This z-score indicator shows the correct z-score of an asset, as it uses the normalized price data for calculation, which is the only correct way. Z-score is only applicable for normal distributed data, therefore not the actual price is considered, but the normalised returns, which were assumed to follow a normal distribution. Returns are mean reverting and assumed to follow a normal distribution, therefore z-score calculation of returns is more reliable than z-score on price, as price is NOT m
##   ONLY GOLD ##   Тiльки Золото ## **Mercaria Professional Trading Zones - Complete Guide** ## **Mercaria Professional Trading Zones - Повний посібник** ### **How Mercaria Zones Work / Як працюють зони Mercaria** **English:** Mercaria Zones is an advanced trading indicator that identifies high-probability support and resistance areas using ZigZag extremes combined with mathematical zone calculations. The indicator works on multiple timeframes simultaneously, providing a comprehensive view
RAD CRITICAL LEVES RAD indicator tracks “Relevant Volume” in real time, identifying accumulation and distribution processes, projecting them in the chart as SUPPORT or RESISTANCE zones. Natural   support   and resistance levels are generated by Volume Accumulation and Distribution processes. As these processes evolve, levels at which the relevant volume in the market place is positioned, become difficult areas to cross upwards or downwards. By using this information, traders can identify very s
Before installing the HeatMap indicator make sure you are using a broker that gives you access to the Depth of market (DOM) !! This indicator creates a heatmap on your chart allowing you to see the buy or sell limit orders easily and in real time. You have the possibility to change the setting and the colors of the HeatMap in order to adapt to all markets and all charts. Here is an example of a setting you can use with the NASDAQ100 on the AMPGlobal broker :  https://www.youtube.com/watch?v=x0Y
Mine Farm is one of the most classic and time-tested scalping strategies based on the breakdown of strong price levels. Mine Farm is the author's modification of the system for determining entry and exit points into the market... Mine Farm - is the combination of great potential with reliability and safety. Why Mine Farm?! - each order has a short dynamic Stop Loss - the advisor does not use any risky methods (averaging, martingale, grid, locking, etc.) - the advisor tries to get the most
KT Renko Patterns MT5
KEENBASE SOFTWARE SOLUTIONS
KT Renko Patterns, Renko grafiğini tuğla tuğla tarayarak, farklı finansal piyasalarda yatırımcılar tarafından sıkça kullanılan popüler grafik formasyonlarını tespit eder. Zaman tabanlı grafiklerle karşılaştırıldığında, Renko grafiklerinde işlem yapmak daha kolay ve belirgindir çünkü grafik sade ve temiz bir yapıya sahiptir. KT Renko Patterns birçok Renko formasyonunu içerir ve bunların çoğu Prashant Shah'ın “Renko Grafikleriyle Karlı Ticaret” adlı kitabında ayrıntılı olarak açıklanmıştır. Bu g
Owl Smart Levels MT5
Sergey Ermolov
4.03 (32)
MT4 versiyonu  |  FAQ Owl Smart Levels Indicator , Bill Williams'ın gelişmiş fraktalları , piyasanın doğru dalga yapısını oluşturan Valable ZigZag ve kesin giriş seviyelerini gösteren Fibonacci seviyeleri gibi popüler piyasa analiz araçlarını içeren tek gösterge içinde eksiksiz bir ticaret sistemidir. pazara ve kar elde edilecek yerlere. Stratejinin ayrıntılı açıklaması Gösterge ile çalışma talimatı Baykuş Yardımcısı ticaretinde Danışman Yardımcısı Kullanıcıların özel sohbeti -> Satın aldıktan
M & W Pattern Pro is an advanced scanner for M and W patters , it uses extra filters to ensure scanned patterns are profitable. The indicator can be used with all symbols and time frames. The indicator is a non repaint indicator with accurate statistics calculations. To use , simply scan the most profitable pair using the statistics dashboard accuracy , then enter trades on signal arrow and exit at the TP and SL levels. STATISTICS : Accuracy 1 : This is the percentage of the times price hits TP
Volume Profile V6
Andrey Kolesnik
4.67 (3)
The volume profile indicator of the market + a smart oscillator. It works on almost all instruments-currency pairs, stocks, futures, cryptocurrency, on real volumes and on tick ones. You can set both the automatic definition of the profile range, for example, for a week or a month, etc., and set the range manually by moving the boundaries (two vertical lines red and blue). It is shown as a histogram. The width of the histogram at this level means, conditionally, the number of transactions condu
OrderFlow Absorption – MT5 için Profesyonel Delta ve Absorpsiyon Sinyal Göstergesi OrderFlow Absorption ile gerçek emir akışı analizinin gücünü keşfedin – MetaTrader 5 için nihai delta histogramı ve absorpsiyon sinyal göstergesi. Fiyat hareketlerinin arkasında gerçekte neler olduğunu görmek isteyen traderlar için tasarlanan bu araç, piyasayı hareket ettiren gizli alım/satım baskısını ve absorpsiyon olaylarını ortaya çıkarır. Özellikler Delta Histogramı Görselleştirme:   Alım ve satım baskısını a
FFx Patterns Alerter gives trade suggestions with Entry, Target 1, Target 2 and StopLoss .... for any of the selected patterns (PinBar, Engulfing, InsideBar, OutsideBar) Below are the different options available: Multiple instances can be applied on the same chart to monitor different patterns Entry suggestion - pips to be added over the break for the entry 3 different options to calculate the SL - by pips, by ATR multiplier or at the pattern High/Low 3 different options to calculate the 2 TPs -
Overview Heiken Ashi CE Filtered MT5 is a technical indicator for the MetaTrader 5 platform. It integrates smoothed candlestick charting with a dynamic exit strategy and a customizable trend filter to deliver clear buy and sell signals. The indicator is designed to improve trend detection and signal reliability by reducing market noise. If you want to see more high-quality products or order the development/conversion of your own products, visit my partners' website: 4xDev Get 10% OFF on manual
# Timeframepro - MT5 Candle Timer Countdown Indicator ## Overview Timeframepro is a professional MT5 indicator that displays a real-time countdown timer showing the remaining time before the current bar closes and a new bar forms. It provides essential time management functionality for traders who need to track candle closure times accurately. ## Key Features ### ️ Core Functionality - **Real-time Countdown Timer**: Displays remaining time in MM:SS format (e.g., "Time: 12:45") - **Server Ti
DYJ BoS göstergesi, piyasa yapısındaki değişimlerin temel unsurlarını otomatik olarak belirler ve işaretler, bunlar arasında şunlar yer alır: Yapının Kırılması (BoS): Fiyatın önceki bir yapı noktasını kırarak önemli bir hareket yapması durumunda tespit edilir. Olası yükseliş trendi çizgilerini ve düşüş trendi çizgilerini (UP & DN, yani sürekli yeni zirveler ve yeni dipler) işaretler ve fiyat bu çizgileri aştığında kırmızı (AYI) ve yeşil (BOĞA) okları işaretler BoS genellikle fiyatın önceki f
This indicator has been developed to identify and display these trends quickly and easily, allowing you to see instantly, those currency pairs which are trending, and those which are not – and in all timeframes, with just one click. The 28 currency pairs are displayed as a fan as they sweep from strong to weak and back again, and this is why we call it the ‘currency array’. All 28 pairs are arrayed before you, giving an instant visual description of those pairs that are trending strongly, those
Advanced Volume Profile Analysis Tool for MetaTrader 5 The Kecia Volume Profile Order Finder provides traders with volume profile analysis capabilities. This MT5 indicator combines volume profile visualization with statistical calculations to help identify potential trading opportunities and suggests entry, stop loss, and take profit levels based on market structure. Market Profile Visualization Transform your chart with customizable volume profile visualizations: Multiple visualization options
Manus Pro
Itumeleng Mohlouwa Kgotso Tladi
MANUS PRO EA The Trading Revolution You've Been Waiting For Are you TIRED of watching other traders make consistent profits while your account bleeds red?   The financial markets don't wait for anyone – and neither should you. MANUS PRO isn't just another Expert Advisor... it's your   TICKET TO FINANCIAL FREEDOM . Why MANUS PRO is Different (And Why Everyone's Talking About It) FOR BEGINNERS: Your Trading Mentor That Never Sleeps Zero Learning Curve   – Install, activate, and watch it wo
Bu ürünün alıcıları ayrıca şunları da satın alıyor
Azimuth Pro
Ottaviano De Cicco
5 (1)
LAUNCH PROMO Azimuth Pro price is initially set at 299$ for the first 100 buyers. Final price will be 499$ . THE DIFFERENCE BETWEEN RETAIL AND INSTITUTIONAL ENTRIES ISN'T THE INDICATOR — IT'S THE LOCATION. Most traders enter at arbitrary price levels, chasing momentum or reacting to lagging signals. Institutions wait for price to reach structured levels where supply and demand actually shift. Azimuth Pro maps these levels automatically: swing-anchored VWAP, multi-timeframe structure lines, an
ÜCRETSİZ AUX Göstergesi ve EA Desteğini Alın  Doğrudan indirme — Buraya tıklayın [ D.I.C.E ] The DICE Indicator  Divergence in Chaos Environment, Elliott Dalga Teorisi’ni Trading Chaos teknikleriyle birleştiren trader’lar için geliştirilmiş özel bir MT5 aracıdır. Bill Williams’ın tanımladığı kaotik piyasa ortamıyla senkronize olarak fiyat hareketlerindeki gizli ve normal uyumsuzlukları tespit eder. Ana Özellikler Elliott Dalgası Uyumlu Uyumsuzluk: Dalga yapılarıyla uyumlu boğa ve ayı uyumsuzluk
Rtc ML Ai Predictor
Muhammad Faisal Sagala
Rtc ML Ai | Predictor CORE MACHINE LEARNING ENGINE Adaptive ML Market Predictor – Multi-Bar Trend & Candle Forecast What This Indicator Does This indicator is a  real-time market prediction engine  designed to analyze price behavior and estimate  future market tendencies . Unlike conventional indicators, this system  does not rely on static parameters or historical curve-fitting , but adapts its internal state dynamically during live market operation. Instead of using static rules, the indic
" Dynamic Scalper System MT5 " göstergesi, trend dalgaları içinde işlem yapmak için scalping yöntemi için tasarlanmıştır. Başlıca döviz çiftleri ve altın üzerinde test edilmiştir, diğer işlem araçlarıyla uyumluluğu mümkündür. Ek fiyat hareketi desteğiyle trend boyunca pozisyonların kısa vadeli açılması için sinyaller sağlar. Göstergenin prensibi. Büyük oklar trend yönünü belirler. Küçük oklar şeklinde scalping için sinyaller üreten bir algoritma trend dalgaları içinde çalışır. Kırmızı oklar yü
Weis Wave with Alert MT5
Trade The Volume Waves Single Member P.C.
4.94 (17)
Rental/Lifetime Package Options and Privileges  Rent Monthly Six Months   Yearly/Lifetime Weis Wave with Speed with Alert+Speed Index x x x Manual  x x x Quick Set up Video x x x Blog x x x Lifetime Updates x x x Setup and Training Material x x Discord Access Channel "The SI traders"          x Rectangle Break Alert Tool      x How to trade with it:    http://www.tradethevolumewaves.com   ** If you purchase please contact me to setup your  : Training Room and  complete manual access.  Wei
ARIPoint
Temirlan Kdyrkhan
1 (1)
ARIPoint is a powerful trading companion designed to generate high-probability entry signals with dynamic TP/SL/DP levels based on volatility. Built-in performance tracking shows win/loss stats, PP1/PP2 hits, and success rates all updated live. Key Features: Buy/Sell signals with adaptive volatility bands Real-time TP/SL/DP levels based on ATR Built-in MA Filter with optional ATR/StdDev volatility Performance stats panel (Success, Profit/Loss, PP1/PP2) Alerts via popup, sound, push, or email Cu
Ne kadar harika geriye dönük testler, canlı hesap performans kanıtları ve her yerde fantastik istatistikler sunan bir alım satım göstergesi aldınız, ancak onu kullandıktan sonra hesabınızı **patlatmakla mı sonuçlandınız?** Bir sinyale tek başına güvenmemelisiniz, öncelikle neden ortaya çıktığını bilmeniz gerekir ve RelicusRoad Pro bunu en iyi şekilde yapar! Kullanım Kılavuzu + Stratejiler + Eğitim Videoları + VIP Erişimli Özel Grup + Mobil Sürüm Mevcut Piyasaya Bakmanın Yeni Bir Yolu RelicusR
SynaptixQuant Dominance Matrix
Devie Arevalo Montemayor
5 (1)
SynaptixQuant Dominance Matrix: Institutional-Grade Market State Extraction Engineered for traders who require a data-driven view of market behaviour beyond surface-level indicators. The Synaptix Quant (SQ) Dominance Matrix is not a conventional currency strength display. Behind its intentionally streamlined interface runs a sophisticated analytical architecture designed to quantify market conditions with precision. Every output is generated through layered signal processing built to identify d
Prices move for many reasons and these can vary from one operator to another: software, private and institutional traders simultaneously contribute to the formation of the price, making predictive art very difficult. However, there are measurable factors that bind the price to an underlying trend in line with the physical reality that the financial asset represents: these are the macroeconomic indicators. Large investors use this information wisely to set their strategies. Understanding these m
WARNING: This indicator is distributed EXCLUSIVELY on MQL5.com MT4 version:   https://www.mql5.com/it/market/product/160363 MT5 version:   https://www.mql5.com/it/market/product/160410 ============================================================================================= MAX RIBBON ver 1.00 The indicator that shows you the TREND clearly and unambiguously! ============================================================================================= DESCRIPTION MAX RIBBON is an advanced tre
Matreshka
Dimitr Trifonov
5 (2)
Matreshka self-testing and self-optimizing indicator: 1. Is an interpretation of the Elliott Wave Analysis Theory. 2. Based on the principle of the indicator type ZigZag, and the waves are based on the principle of interpretation of the theory of DeMark. 3. Filters waves in length and height. 4. Draws up to six levels of ZigZag at the same time, tracking waves of different orders. 5. Marks Pulsed and Recoil Waves. 6. Draws arrows to open positions 7. Draws three channels. 8. Notes support and re
CGE Trading Suite
Carl Gustav Johan Ekstrom
5 (1)
CGE Trading Suite is a market analysis system designed to eliminate guesswork from trading. It continuously adapts to real-time price behavior, helping traders stay aligned with key market levels and evolving market conditions. This comprehensive system integrates multiple analytical tools into a single workflow, including dynamic grid mapping, liquidity behavior analysis, ECM, trend lines, supply and demand zones, MIDAS, trade cycles, and directional channel projections. Together, these tools p
TrendMaestro5
Stefano Frisetti
note: this indicator is for METATRADER4, if you want the version for METATRADER5 this is the link:  https://www.mql5.com/it/market/product/108106 TRENDMAESTRO ver 2.5 TRENDMAESTRO recognizes a new TREND from the start, he never makes mistakes. The certainty of identifying a new TREND is priceless. DESCRIPTION TRENDMAESTRO identifies a new TREND in the bud, this indicator examines the volatility, volumes and momentum to identify the moment in which there is an explosion of one or more of these da
VTrende Pro
Andrii Diachenko
5 (1)
VTrende Pro - MTF indicator for trend trading with a display panel for MT5 *** Videos can be translated into any language using subtitles (video language - Russian) Although the signals of the VTrende Pro indicator can be used as signals of a full-fledged trading system, it is recommended to use them in conjunction with the Bill Williams TS. VTrende Pro is an extended version of the VTrende indicator. Difference between Pro version and VTrende: - Time zones - Signal V - signal 1-2 waves -    S
+++++++++++++++++++++++++++++++++++++++++++++++++++++++++++++++++++++++++++++++++++++++++++++++++ +++ Link to EURUSD Only Free Version -->  https://www.mql5.com/en/market/product/156904?source=Unknown +++++++++++++++++++++++++++++++++++++++++++++++++++++++++++++++++++++++++++++++++++++++++++++++++ Hallo Trader, This is a traditional GANN & FIBONACCI strategy based on detection of an impulsive move in the opposite direction. This is called a Breakout. At the moment of Breakout, the indicator draw
WanaScalper
Isaac Wanasolo
1 (1)
A scalping indicator based on mathematical patterns, which on average gives signals with relatively small SL, and also occasionally helps to catch big moves in the markets (more information in the video) This indicator has three main types of notifications: The first type warns of a possible/upcoming signal on the next bar The second type indicates the presence of a ready signal to enter the market/open a position The third type is for SL and TP levels - you will be notified every time price re
Hyperbolic
Konstantin Gruzdev
The indicator is stable on noise fluctuations in price and quickly reacts to the trend. It is based on an algorithm from a system of hyperbolic functions that allows you to aggressively smooth the flat with minimal lag on the trend. It can be applied directly to the price chart, to itself, or to other indicators in order to eliminate false signals. The main purpose of the indicator is to smooth out small sawtooth price movements as much as possible. The higher the Hyperbolic parameter, the stron
ÜCRETSİZ AUX Göstergesini, EA desteğini ve tam kılavuzu alın, lütfen ziyaret edin – https://www.mql5.com/en/blogs/post/763955 Trend'i Belirle. Deseni Oku. Girişi Zamanla. 30 Saniyede 3 Adım! Kolayca işlem yapın — analiz gerektirmez, Akıllı yardımcınız iş akışınızı basitleştirmeye hazır Artık grafik yüklemesi yok. Akıllı yönelim tespiti ile güvenle işlem yapın. Tüm para birimleri, kripto, hisse senetleri, metaller, endeksler ve herhangi bir zaman dilimi ile uyumludur. Sadece tıklayın ve yürütün
This indicator uses support and resistance, volume and some special formula to calculate the volume to filter the candles. If the volume reaches a specific value, And at the same time, Candle breaks the support/resistance line, There would be a signal and we can enter the market. Signals appear when the current candle closes. then you can enter the trade when a new candle appears. Please don't forget to follow your money management plan. MT4 Version Support/Resistance Breakout MT4 :   https:/
The iChannels
BeeXXI Corporation
5 (2)
Ultra-fast recognition of parabolic channels (as well as linear, horizontal and wavy channels) throughout the depth of history, creating a hierarchy of channels. Required setting: Max bars in chart: Unlimited This indicator is designed primarily for algorithmic trading, but can also be used for manual trading.  This indicator will have a very active evolution in the near future and detailed descriptions on how to apply to create robots
TREND HARMONY MT5 – Multi Timeframe Trend and Phase and Pullback Level Visualizer indicator for Metatrader5 The TREND HARMONY indicator automates deep trend analysis and generates visualizations for you. Take control of your trades by eliminating uncertainty! Revolutionize your trading experience with precision and insight through the TREND HARMONY Multi Timeframe indicator – your ultimate MT5 trend visualization indicator. [  Features and Manual   | MT4 version |   All Products   ] Are you tir
BookMap HeatMap
Roberto Spadim
1 (2)
This Indicator creates a heatmap based on depth of market of the current symbol or another symbol. Other symbol is useful when you trade futures market and a contract has 'mini' and 'full' split. For example, in Brazil (B3 - BMF&Bovespa), WDO and DOL are future Forex contract of BRL/USD (where 1 DOL = 5 WDO) and big banks work mostly with DOL (where liquidity is important). Please use with M1 timeframe , objects are too small to be displayed at higher timeframes (MT5 limit). The number of level
Key level wedge pro MT5
Presley Annais Tatenda Meck
Its our anniversary! To give back enjoy this 60% discount for the next week (original price $239) We have combined all of our beloved indicators the likes of: Key level order block ,   Key level supply and demand ,   Key level liquidity grab   and   Key level wedge   into one single indicator and dashboard. Whats new Dashboard : There is an easy access dashboard for all your needs. Multi-timeframe button : There is now a multi-timeframe option for Order Blocks and Supply and demand zones, maki
IQ FX Gann Levels a precision trading indicator based on W.D. Gann’s square root methods . It plots real-time, non-repainting support and resistance levels to help traders confidently spot intraday and scalping opportunities with high accuracy. William Delbert Gann (W.D. Gann) was an exceptional market analyst, whose trading technique was based on a complex blend of mathematics, geometry, astrology, and ancient mathematics which proved to be extremely accurate. Setup & Guide:  Download  MT4 Ver
Hello I Want to introduce The Forex Buy Sell Arrow Premium MT5 i recently release this premium indicator! its 1000% Non Repaint Indicator, It Work Perfectly Well,, i tested it day by day, Just mind blowing Result,  Including Powerful trend Algorithm! How It Work? well, it work market trend formula, when trend Bullish Or when trend Bearish,  Recommend Timeframe M30, H1 it work all timeframe, and all currency pair, 100% non repaint, How to take signal From Forex Buy Sell Arrow Premium Ind
The ChanLun or Chan theory is one of the most popular trading theories in China. But it seems like that it has little influence in western countries. Actually, the Chan Theory is based on a sophisticated mathematical model. The basic idea ChanLun is to simplify the bar chart by its model. With the help of ChanLun, a trader can analyze and predict the trend of future goods, stocks. In ChanLun, there are several basic elements called fractals, strokes, line segments and pivots . A trader should pa
Support Resistance Catcher Indicator Features and Explanation Overview: The Support Resistance Catcher is a custom MT5 indicator designed to identify and visualize supply (resistance) and demand (support) zones based on candlestick price action. It detects zones where price has reversed after rallies or drops, using wick rejections and clustering. The indicator draws horizontal rectangles for active and historical zones, with customizable colors, labels, and alerts. Key Features: 1. Zone Det
Göstergе, herhangi bir noktadan hacmi analiz eder ve bu hacim için piyasanın tükeniş seviyelerini hesaplar. Meravith’in ana çizgileri: Boğa hacim tükeniş çizgisi – hedef olarak kullanılır. Ayı hacim tükeniş çizgisi – hedef olarak kullanılır. Trend çizgisi – piyasa trendini gösterir. Piyasanın boğa mı ayı mı olduğuna bağlı olarak rengi değişir ve trend desteği görevi görür. Nasıl kullanılır: Mor dikey çizgiye çift tıklayın ve istediğiniz konuma taşıyın. Her şeyi analiz edebilirsiniz – trendleri v
Pantera Indicator
Temirlan Kdyrkhan
5 (1)
A tool for on-chart strategy backtesting and performance analysis. A utility for developing, debugging, and testing custom trading ideas and indicator functions. An indicator designed to quickly test trading concepts and visualize the effectiveness of different input parameters. An all-in-one sandbox for testing everything from simple crossovers to complex, multi-condition trading systems.
Frontier Pivots
Nestor Jose Mendez Boza
FRONTIER PIVOTS - Geometric Levels Indicator This indicator plots support and resistance levels/ranges on the chart using mathematical calculations. It helps traders identify potential price reaction zones based on geometric patterns. Main Features: Automatically calculates and displays key price levels Plots both support and resistance lines Uses daily price data for level calculation Clean visual presentation with different colors for different level types No repainting - levels remain static
Filtrele:
İnceleme yok
İncelemeye yanıt