Better Volume OnOff MT5
- Göstergeler
- Sürüm: 1.1
- Güncellendi: 27 Nisan 2021
- Etkinleştirmeler: 7

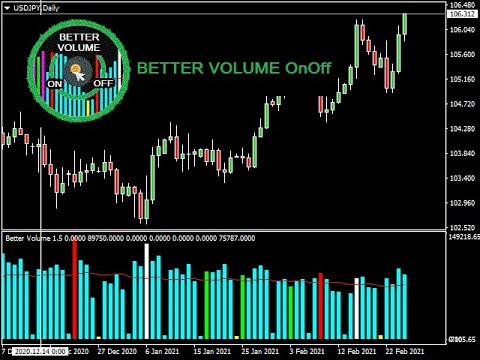
The Better Volume indictator improves the comprehension on volume by coloring the classical histogram bars. The colors point out differents nature of volume.
The Better Volume OnOff allows to open/close the subwindow through a botton or using the keyboard only.
There is the possibility to customize 3 symbols and assign them different parameters for each time frame.
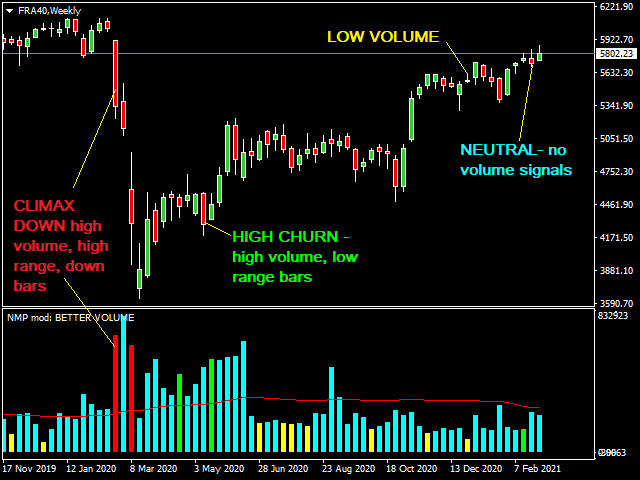
The indicator improves the comprehension on volume by coloring the classical histogram bars:
- CLIMAX UP - it points out high volume, high range, up bars - White
- CLIMAX DOWN - it indicates high volume, high range, down bars - Red
- LOW VOLUME - it can be seen at the similar places to the low churn bar - Yellow
- HIGH CHURN - it shows high volume, low range bars - Lime
- CLIMAX CHURN - it's the combination of Volume Climax plus High Volume Churn - Magenta
- NEUTRAL - there aren't volume signals - Cyan
- Moving Average of volume - Red
Input
- You can set up the lookBack periods over which the indicator is calculated
- It is possible to choose the MA periods for calculating the volume moving average
- You can setup custom parameters for 3 symbols or shut them down all or singularly
- It is possible to shut down the button and setup your favorite keys to on-off the indicator. The default keys are: numpad 1 ON - numpad 2 OFF
- It is possible to customize the button: the position on the screen, the size, the colors and the label
Alerts:
- It's possible set up alerts on colors
- in the metatrader terminal with sound and graphical interface or only with sound
- sending email. You have to fill Email in metatrader platform: 'Tools-Options-Email' tab"